| Param | Original file | Final file |
|---|---|---|
| Filename | modeM0/AS1A14_083T03_9000006562_56816cztM0_level2.fits | modeM0/AS1A14_083T03_9000006562_56816cztM0_level2_quad_clean.evt |
| Size (bytes) | 560,534,400 | 107,982,720 |
| Size | 534.6 MB | 103.0 MB |
| Events in quadrant A | 5,359,358 | 714,554 |
| Events in quadrant B | 5,554,249 | 745,893 |
| Events in quadrant C | 5,624,882 | 630,888 |
| Events in quadrant D | 3,616,454 | 645,209 |
| Mode SS | |||
|---|---|---|---|
| Quadrant | BADHDUFLAG | Total packets | Discarded packets |
| A | 0 | 154 | 0 |
| B | 0 | 154 | 0 |
| C | 0 | 154 | 0 |
| D | 0 | 154 | 0 |
| Mode M0 | |||
|---|---|---|---|
| Quadrant | BADHDUFLAG | Total packets | Discarded packets |
| A | 0 | 21348 | 0 |
| B | 0 | 21805 | 0 |
| C | 0 | 22171 | 0 |
| D | 0 | 16599 | 0 |
| Quadrant | Total seconds | Saturated seconds | Saturation percentage |
|---|---|---|---|
| A | 7658 | 90 | 1.175242% |
| B | 7659 | 429 | 5.601253% |
| C | 7659 | 670 | 8.747878% |
| D | 7658 | 59 | 0.770436% |
Noise dominated data is calculated using 1-second bins in cleaned event files. If a bin has >2000 counts, and if more than 50% of those come from <1% of pixels, then it is considered to be noise-dominated and hence unusable.
| Quadrant | # 1 sec bins | Bins with >0 counts | Bins with >2000 counts | High rate bins dominated by noise | Noise dominated (total time) | Noise dominated (detector-on time) | Marked lightcurve |
|---|---|---|---|---|---|---|---|
| A | 7658 | 7658 | 61 | 61 | 0.80% | 0.80% | 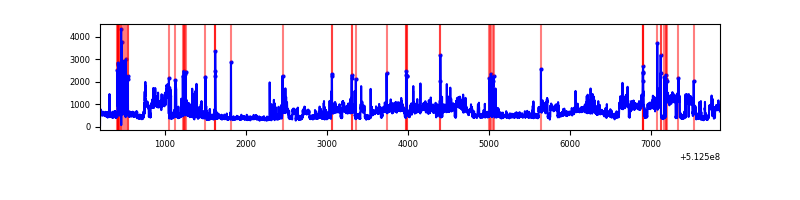 |
| B | 7659 | 7659 | 273 | 273 | 3.56% | 3.56% | 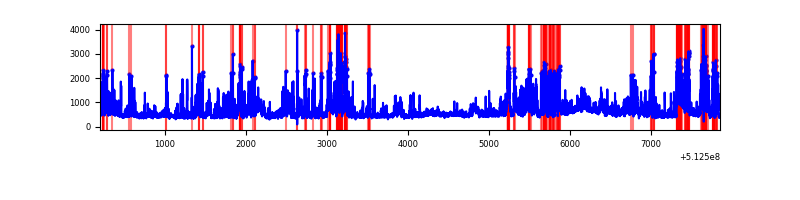 |
| C | 7659 | 7659 | 608 | 608 | 7.94% | 7.94% | 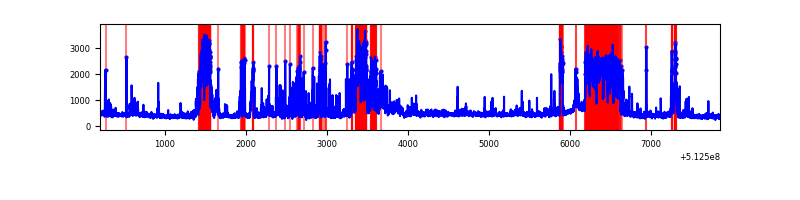 |
| D | 7658 | 7658 | 53 | 53 | 0.69% | 0.69% | 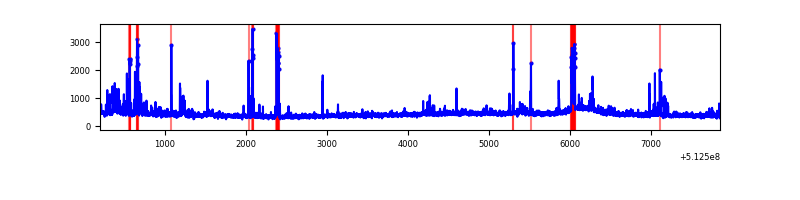 |
Top three noisy pixels from each quadrant. If the there are fewer than three noisy pixels in the level2.evt file, extra rows are filled as -1
| Pixel properties | Quadrant properties | ||||||
|---|---|---|---|---|---|---|---|
| Quadrant | DetID | PixID | Counts | Sigma | Mean | Median | Sigma |
| A | 3 | 14 | 1773861 | 8850.68 | 811 | 789 | 200.3 |
| A | 10 | 251 | 366782 | 1826.93 | 811 | 789 | 200.3 |
| A | 4 | 249 | 30743 | 149.52 | 811 | 789 | 200.3 |
| B | 4 | 206 | 977546 | 5708.64 | 794 | 767 | 171.1 |
| B | 5 | 185 | 712602 | 4160.22 | 794 | 767 | 171.1 |
| B | 2 | 249 | 242510 | 1412.83 | 794 | 767 | 171.1 |
| C | 15 | 230 | 1785064 | 8670.38 | 752 | 743 | 205.8 |
| C | 13 | 3 | 326960 | 1585.15 | 752 | 743 | 205.8 |
| C | 12 | 249 | 244395 | 1183.95 | 752 | 743 | 205.8 |
| D | 2 | 249 | 234998 | 1064.75 | 782 | 745 | 220.0 |
| D | 2 | 31 | 117879 | 532.41 | 782 | 745 | 220.0 |
| D | 5 | 173 | 66042 | 296.79 | 782 | 745 | 220.0 |
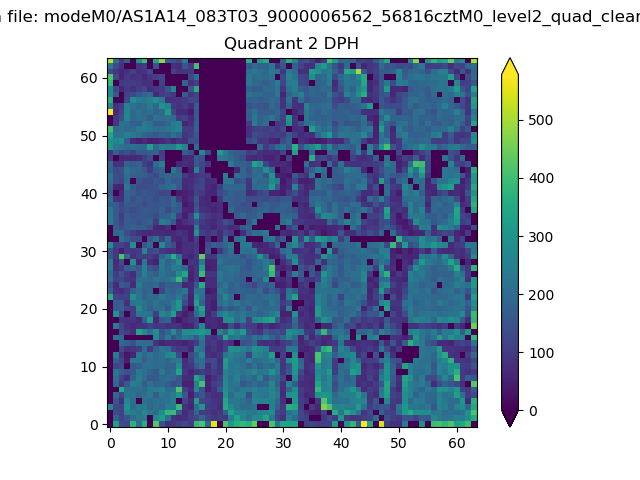
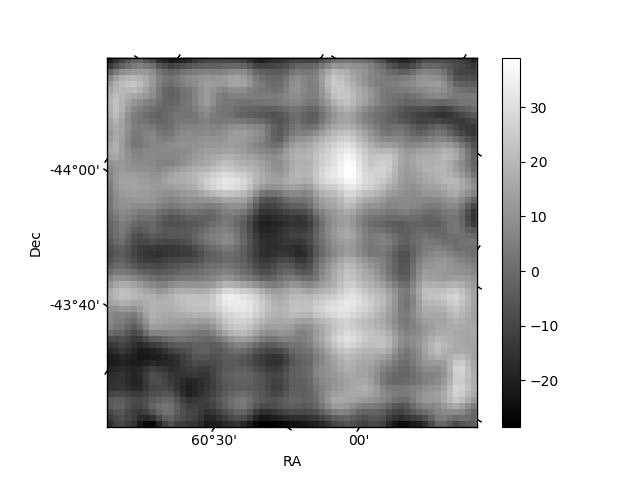
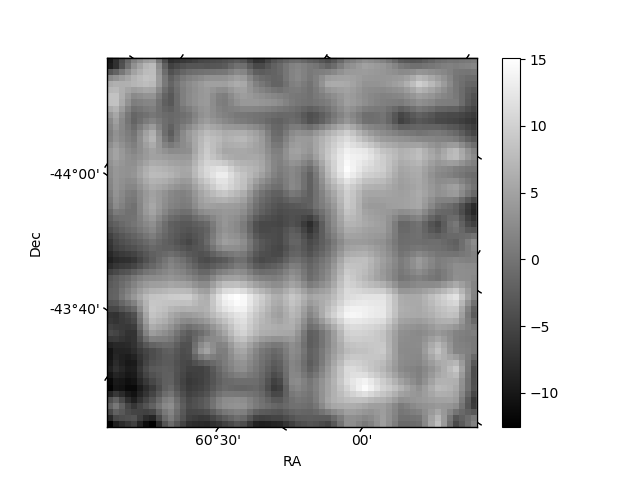
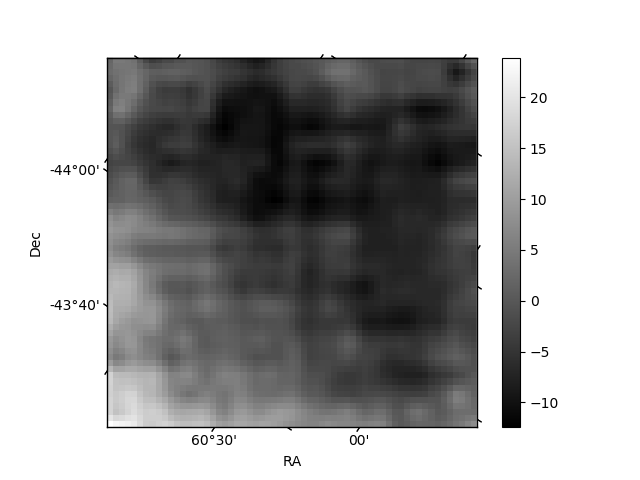
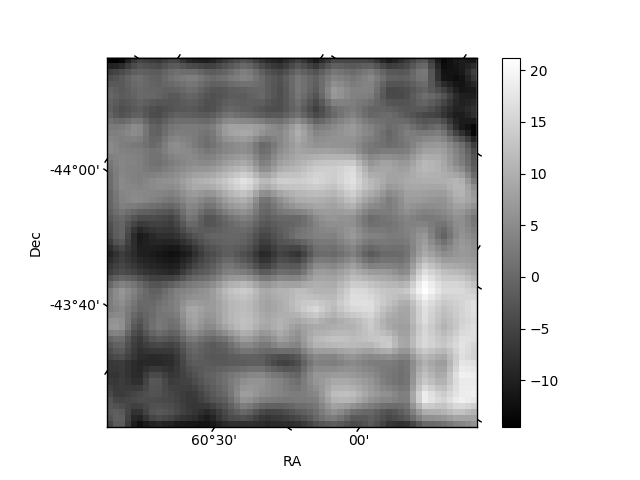
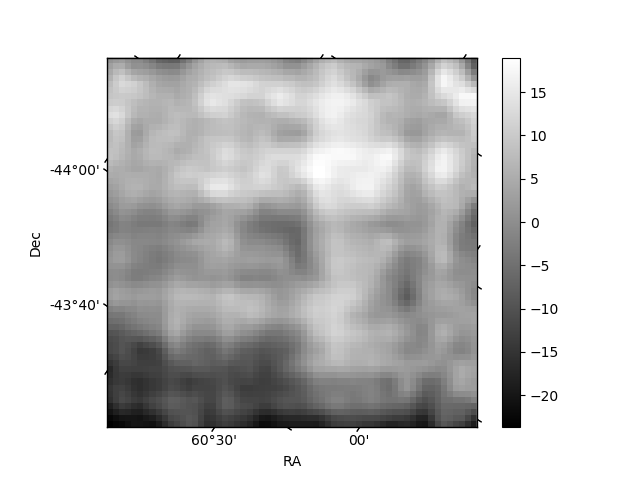
Histogram calculated using DETX and DETY for each event in the final _common_clean file
| Quadrant A | 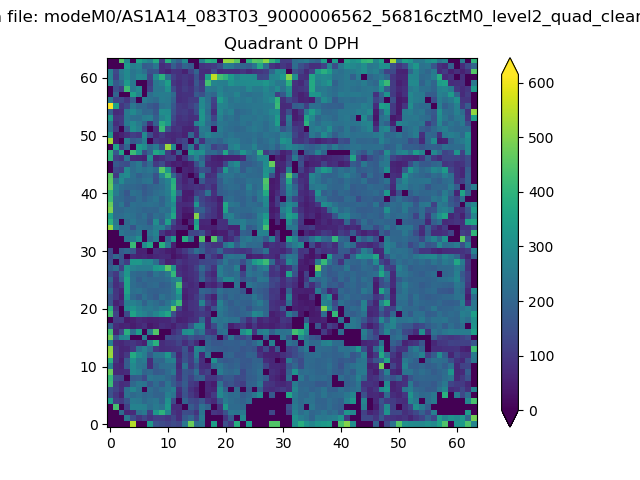 |
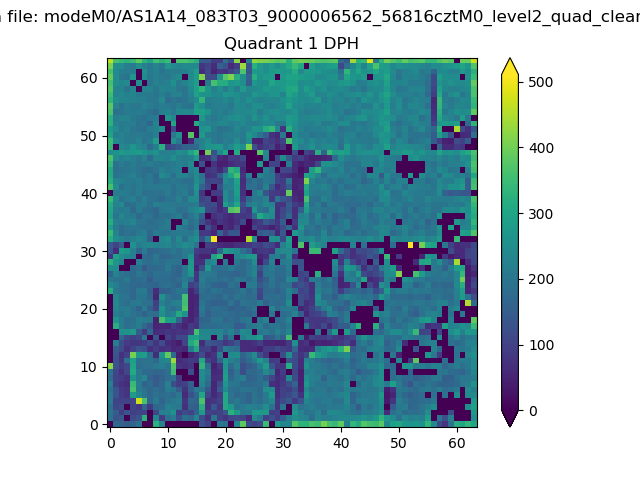 |
Quadrant B |
|---|---|---|---|
| Quadrant D | 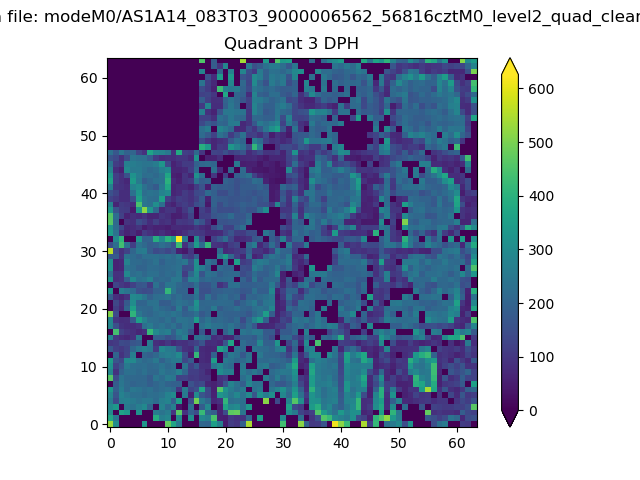 |
 |
Quadrant C |
| Plot type | Count rate plots | Images |
|---|---|---|
| Comparison with Poisson distribution Blue bars denote a histogram of data divided into 1 sec bins. Red curve is a Poisson curve with rate = median count rate of data. |
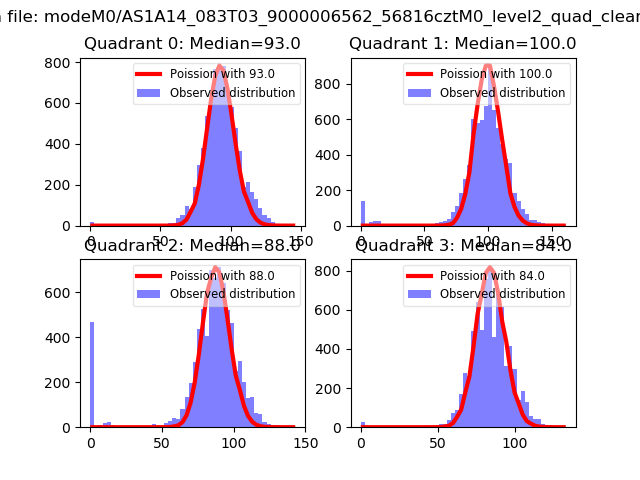 |
 |
| Quadrant-wise count rates Data is divided into 100 sec bins |
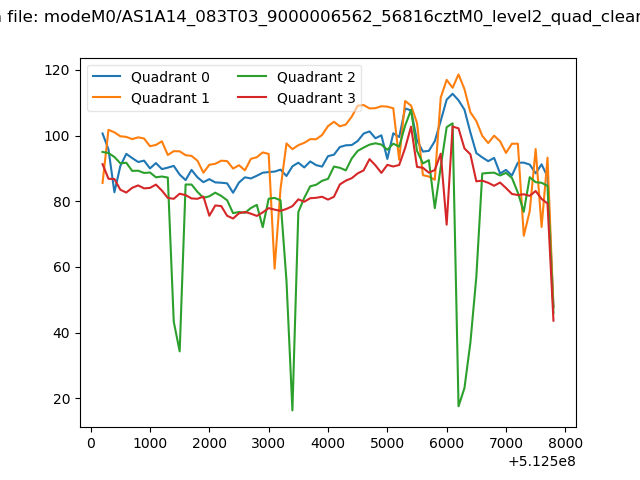 |
|
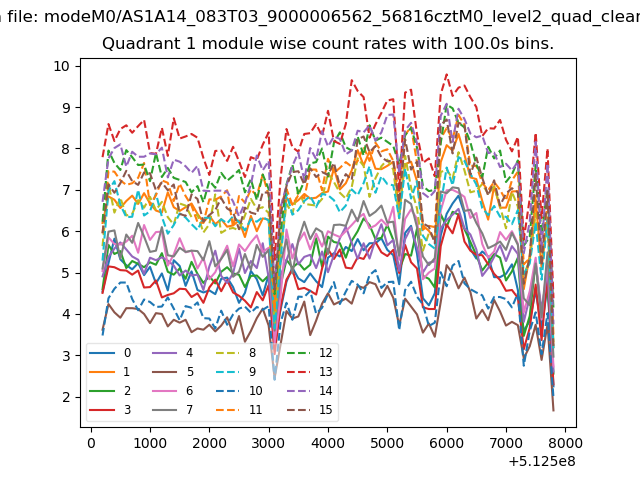
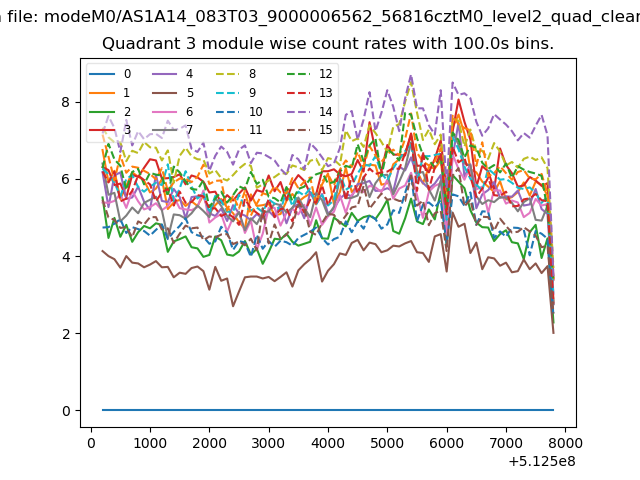
| Module-wise count rates for Quadrant A Data is divided into 100 sec bins |
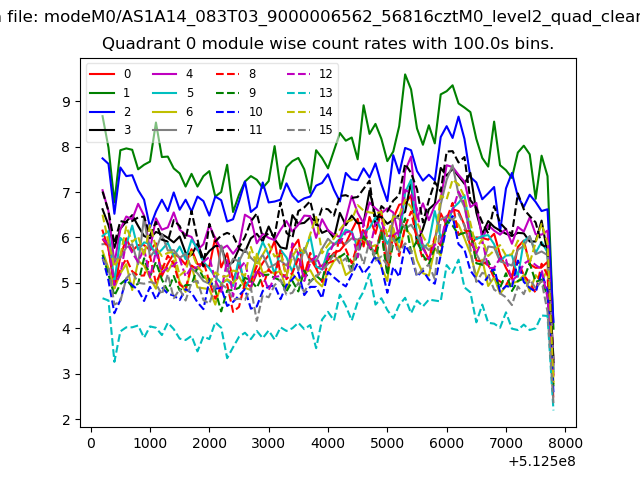 |
 |
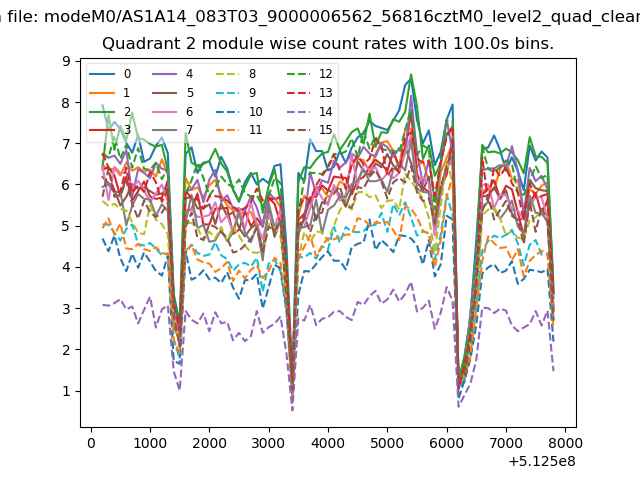
| Module-wise count rates for Quadrant B Data is divided into 100 sec bins |
 |
 |
| Module-wise count rates for Quadrant C Data is divided into 100 sec bins |
 |
 |
| Module-wise count rates for Quadrant D Data is divided into 100 sec bins |
 |
 |
| Parameter | Plot |
|---|---|
| CZT HV Monitor | 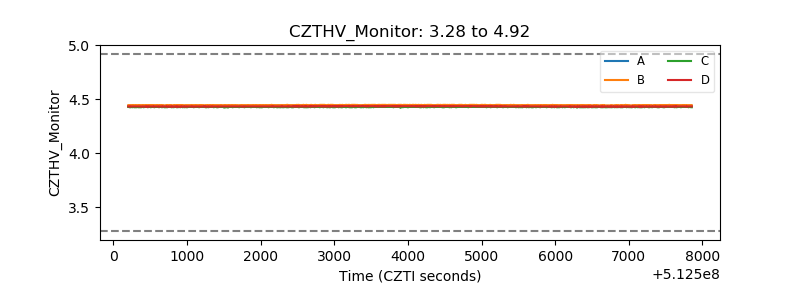 |
| D_VDD | 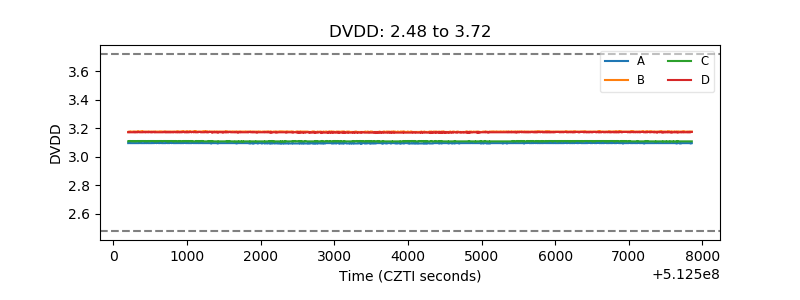 |
| Temperature 1 | 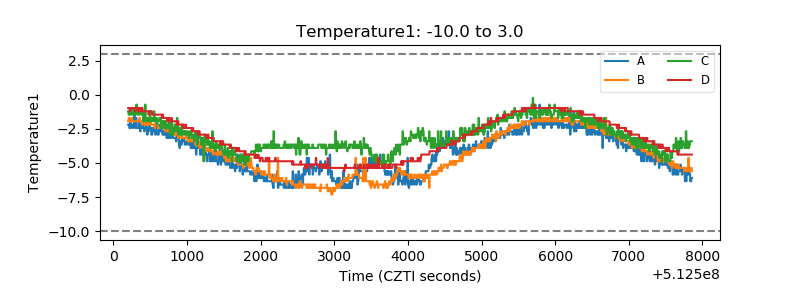 |
| Veto HV Monitor | 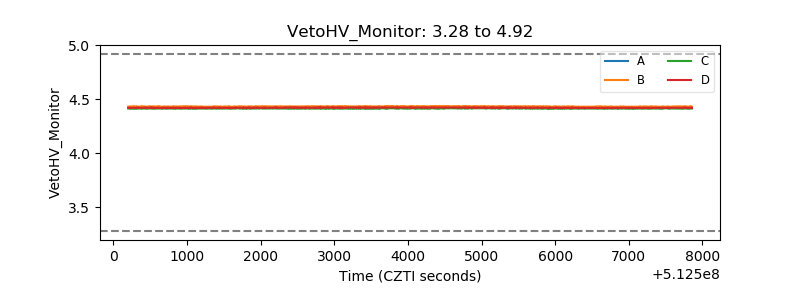 |
| Veto LLD | 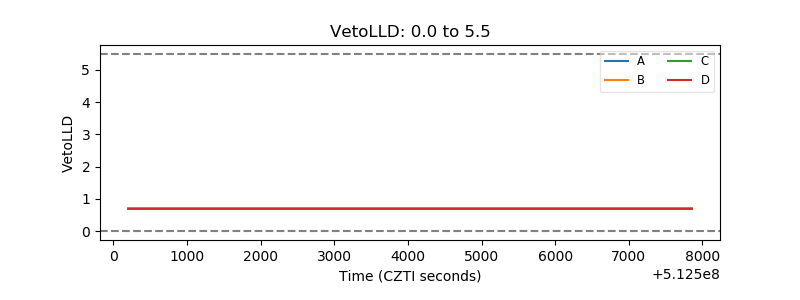 |
| Alpha Counter | 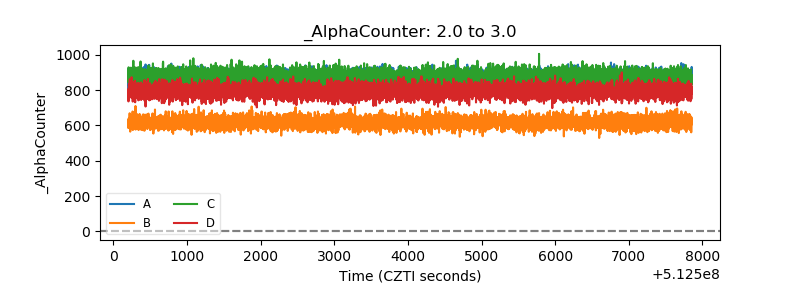 |
| _CPM_Rate |  |
| CZT Counter | 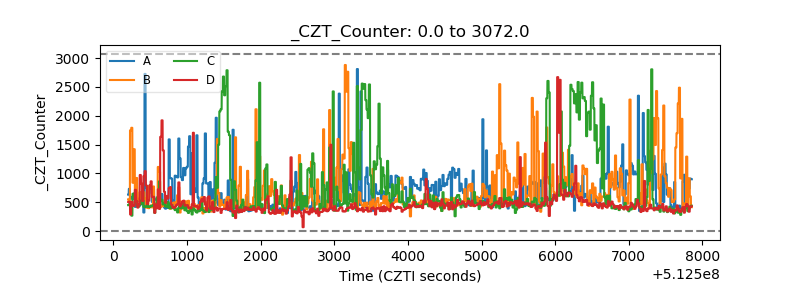 |
| +2.5 Volts monitor |  |
| +5 Volts monitor | 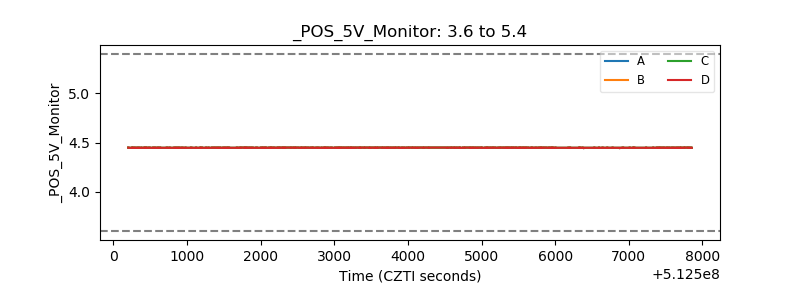 |
| _ROLL_ROT | 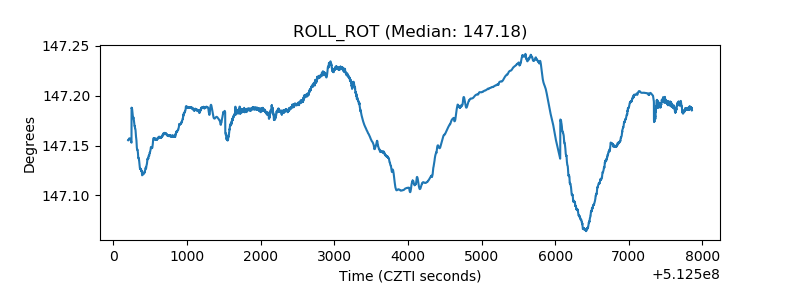 |
| _Roll_DEC | 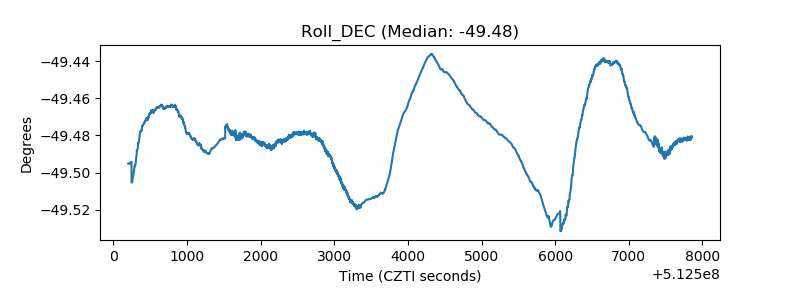 |
| _Roll_RA | 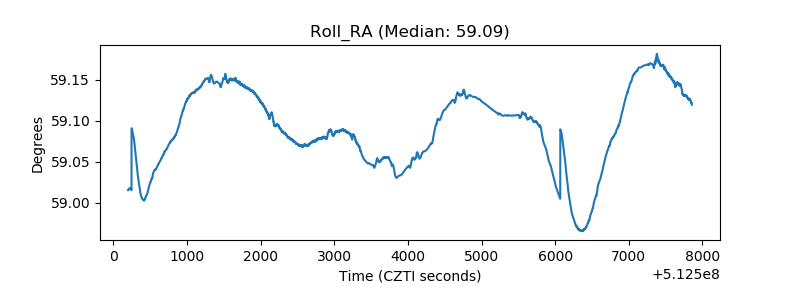 |
| Veto Counter | 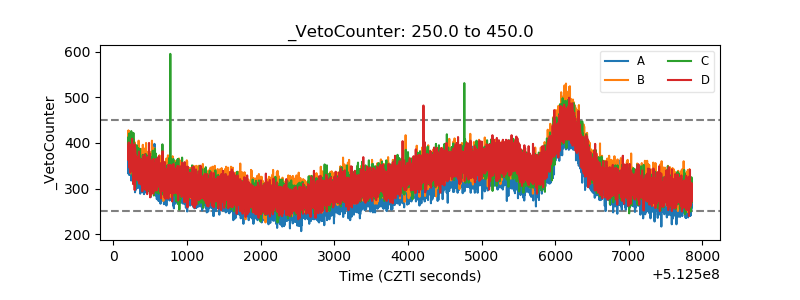 |