| Param | Original file | Final file |
|---|---|---|
| Filename | modeM0/AS1A14_083T03_9000006562_56817cztM0_level2.fits | modeM0/AS1A14_083T03_9000006562_56817cztM0_level2_quad_clean.evt |
| Size (bytes) | 694,961,280 | 109,788,480 |
| Size | 662.8 MB | 104.7 MB |
| Events in quadrant A | 6,038,352 | 750,217 |
| Events in quadrant B | 8,476,370 | 711,023 |
| Events in quadrant C | 6,663,249 | 626,391 |
| Events in quadrant D | 3,922,337 | 675,399 |
| Mode SS | |||
|---|---|---|---|
| Quadrant | BADHDUFLAG | Total packets | Discarded packets |
| A | 0 | 162 | 0 |
| B | 0 | 162 | 0 |
| C | 0 | 162 | 0 |
| D | 0 | 162 | 0 |
| Mode M0 | |||
|---|---|---|---|
| Quadrant | BADHDUFLAG | Total packets | Discarded packets |
| A | 0 | 23726 | 0 |
| B | 0 | 30819 | 0 |
| C | 0 | 25772 | 0 |
| D | 0 | 17856 | 1 |
| Quadrant | Total seconds | Saturated seconds | Saturation percentage |
|---|---|---|---|
| A | 8068 | 132 | 1.636093% |
| B | 8068 | 1314 | 16.286564% |
| C | 8069 | 1095 | 13.570455% |
| D | 8068 | 85 | 1.053545% |
Noise dominated data is calculated using 1-second bins in cleaned event files. If a bin has >2000 counts, and if more than 50% of those come from <1% of pixels, then it is considered to be noise-dominated and hence unusable.
| Quadrant | # 1 sec bins | Bins with >0 counts | Bins with >2000 counts | High rate bins dominated by noise | Noise dominated (total time) | Noise dominated (detector-on time) | Marked lightcurve |
|---|---|---|---|---|---|---|---|
| A | 8068 | 8068 | 78 | 78 | 0.97% | 0.97% | 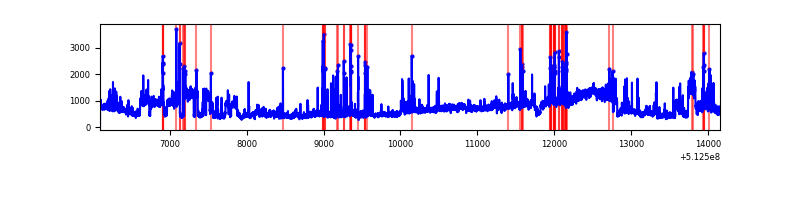 |
| B | 8068 | 8068 | 859 | 859 | 10.65% | 10.65% | 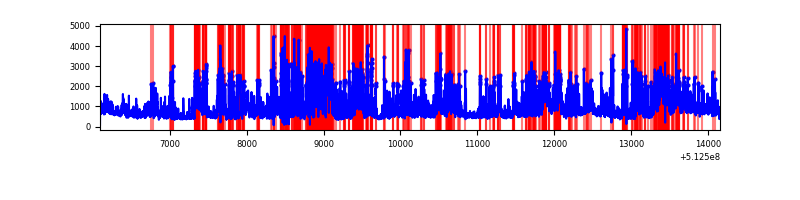 |
| C | 8069 | 8069 | 1065 | 1065 | 13.20% | 13.20% | 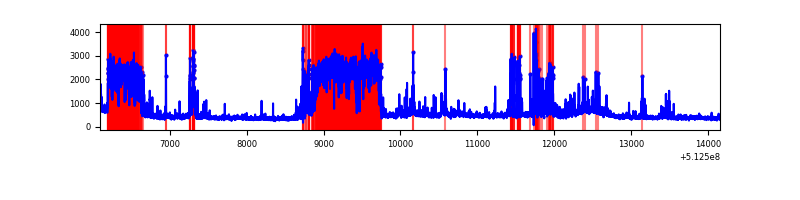 |
| D | 8068 | 8068 | 74 | 74 | 0.92% | 0.92% | 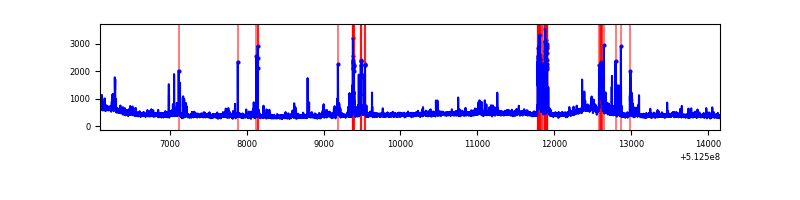 |
Top three noisy pixels from each quadrant. If the there are fewer than three noisy pixels in the level2.evt file, extra rows are filled as -1
| Pixel properties | Quadrant properties | ||||||
|---|---|---|---|---|---|---|---|
| Quadrant | DetID | PixID | Counts | Sigma | Mean | Median | Sigma |
| A | 3 | 14 | 2156896 | 10099.35 | 858 | 836 | 213.5 |
| A | 10 | 251 | 430191 | 2011.17 | 858 | 836 | 213.5 |
| A | 4 | 249 | 85578 | 396.94 | 858 | 836 | 213.5 |
| B | 2 | 249 | 1872907 | 10679.07 | 811 | 782 | 175.3 |
| B | 5 | 185 | 1850540 | 10551.48 | 811 | 782 | 175.3 |
| B | 4 | 206 | 981894 | 5596.51 | 811 | 782 | 175.3 |
| C | 15 | 230 | 2620697 | 12226.94 | 785 | 778 | 214.3 |
| C | 2 | 12 | 444172 | 2069.28 | 785 | 778 | 214.3 |
| C | 13 | 3 | 132970 | 616.93 | 785 | 778 | 214.3 |
| D | 2 | 249 | 369429 | 1584.62 | 825 | 788 | 232.6 |
| D | 5 | 173 | 79320 | 337.57 | 825 | 788 | 232.6 |
| D | 2 | 31 | 74943 | 318.76 | 825 | 788 | 232.6 |
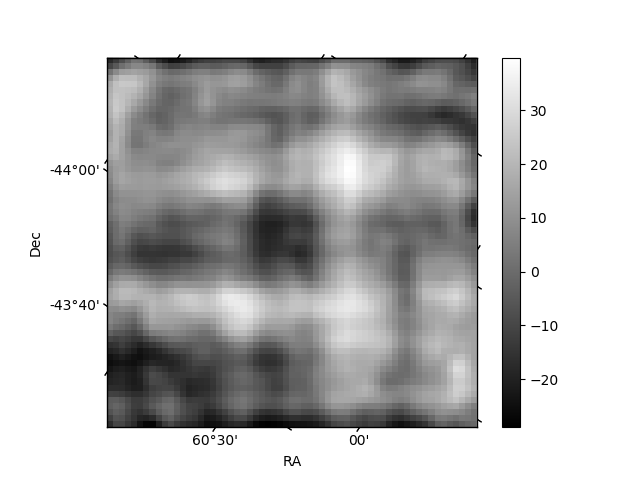
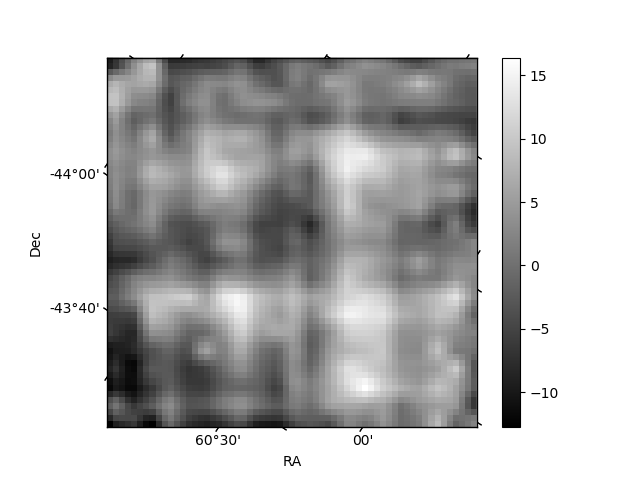
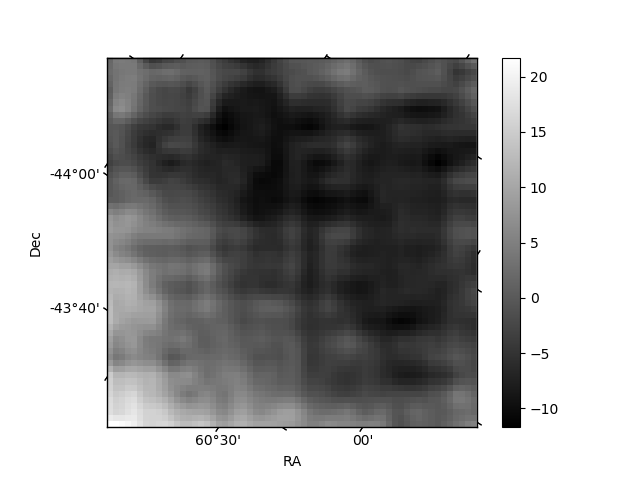
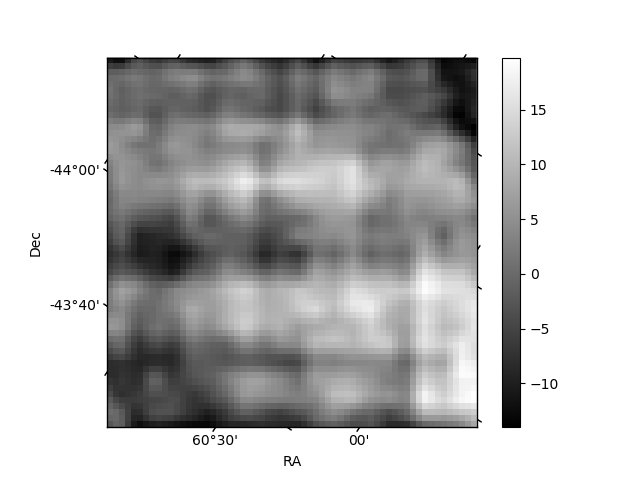
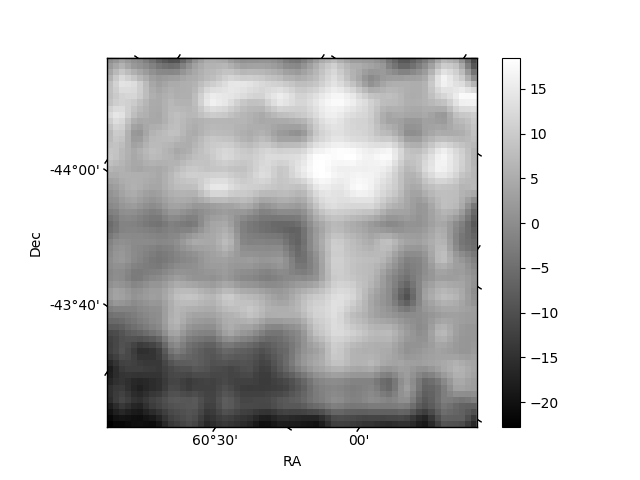
Histogram calculated using DETX and DETY for each event in the final _common_clean file
| Quadrant A | 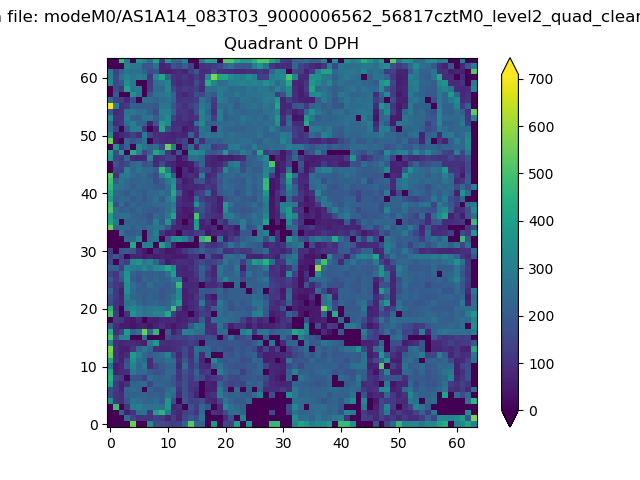 |
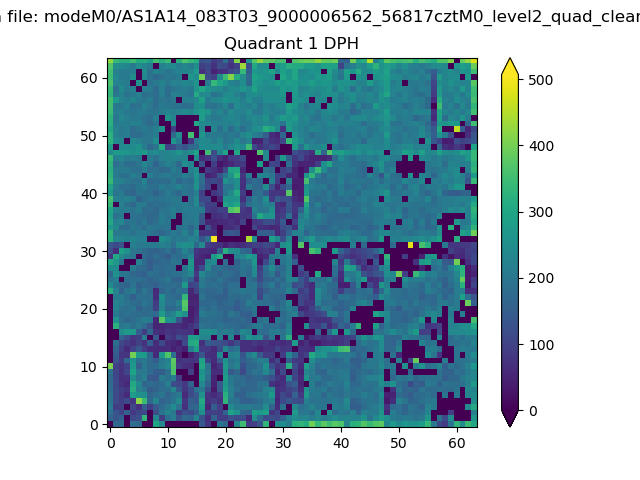 |
Quadrant B |
|---|---|---|---|
| Quadrant D | 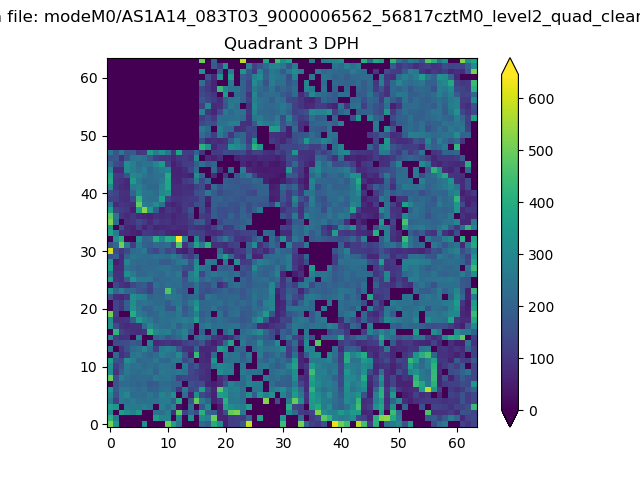 |
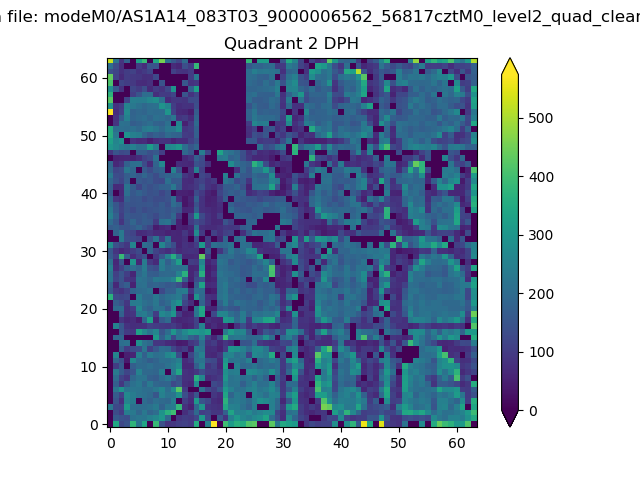 |
Quadrant C |
| Plot type | Count rate plots | Images |
|---|---|---|
| Comparison with Poisson distribution Blue bars denote a histogram of data divided into 1 sec bins. Red curve is a Poisson curve with rate = median count rate of data. |
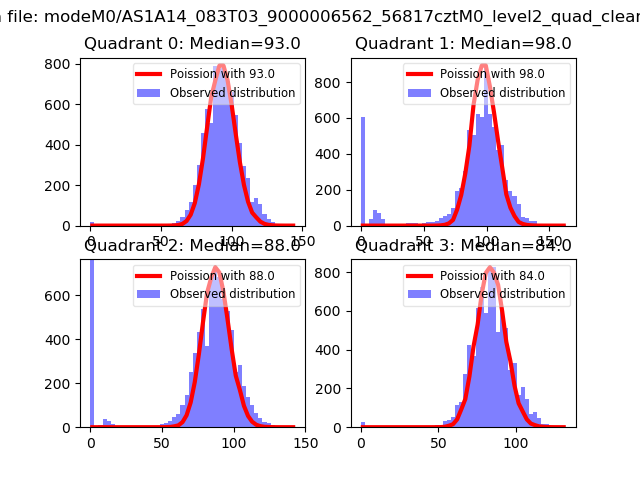 |
 |
| Quadrant-wise count rates Data is divided into 100 sec bins |
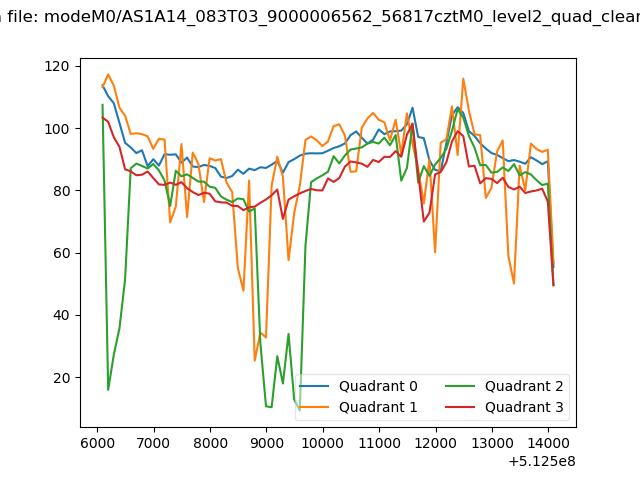 |
|
| Module-wise count rates for Quadrant A Data is divided into 100 sec bins |
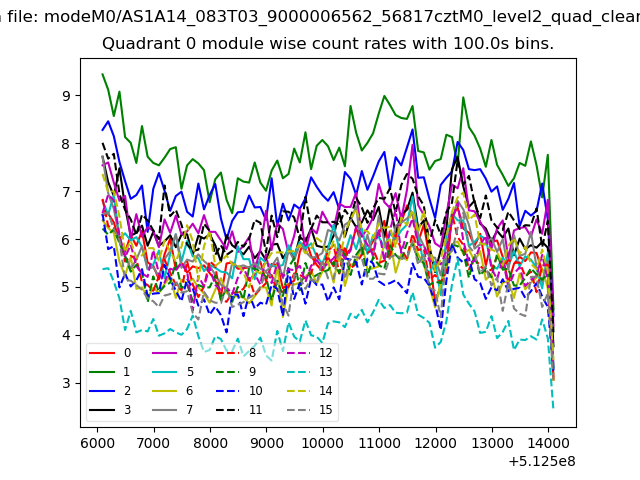 |
 |
| Module-wise count rates for Quadrant B Data is divided into 100 sec bins |
 |
 |
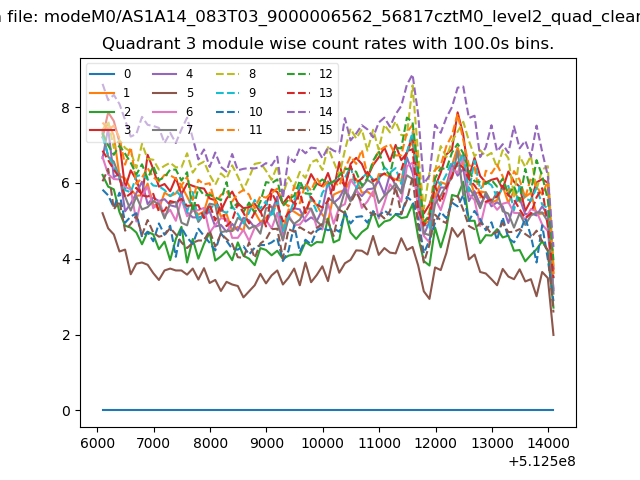
| Module-wise count rates for Quadrant C Data is divided into 100 sec bins |
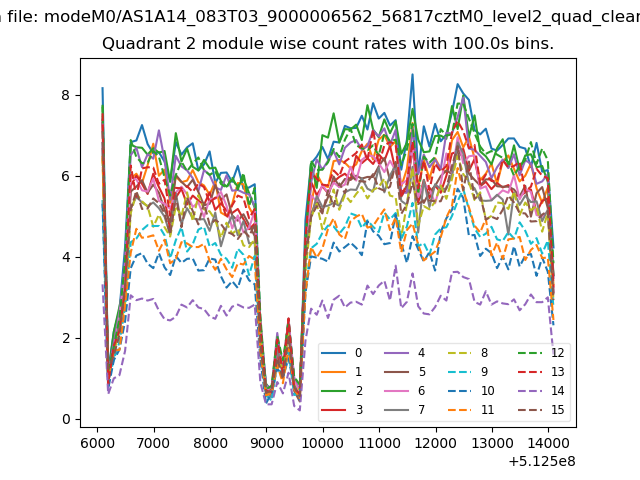 |
 |
| Module-wise count rates for Quadrant D Data is divided into 100 sec bins |
 |
 |
| Parameter | Plot |
|---|---|
| CZT HV Monitor | 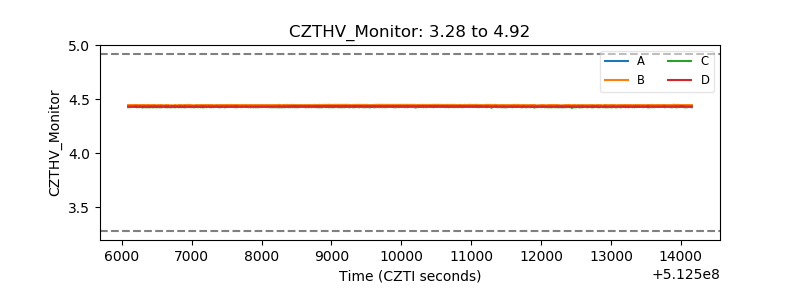 |
| D_VDD | 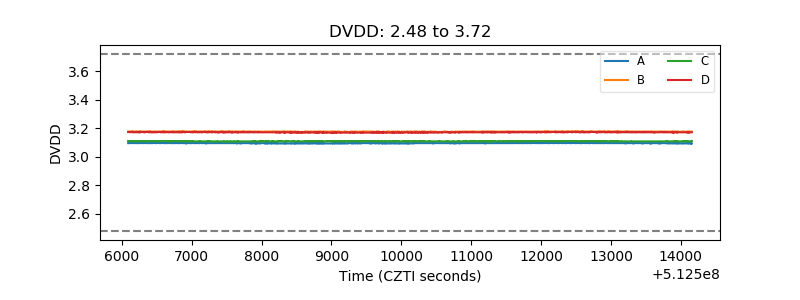 |
| Temperature 1 | 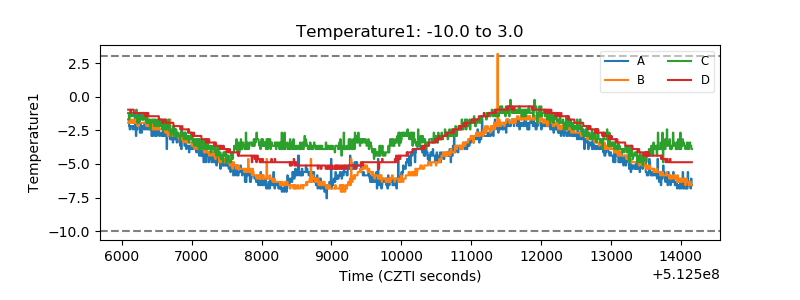 |
| Veto HV Monitor | 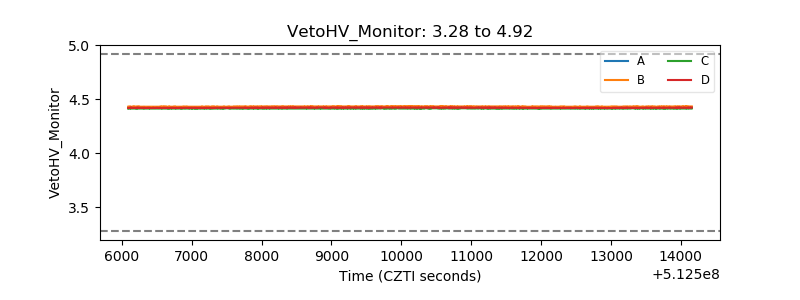 |
| Veto LLD | 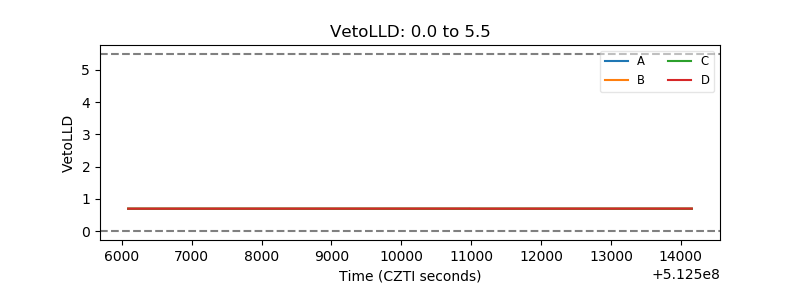 |
| Alpha Counter | 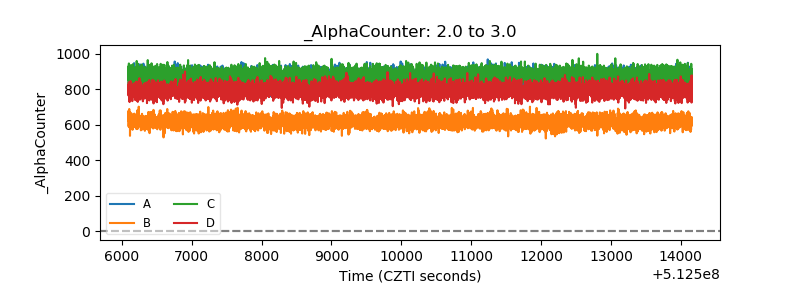 |
| _CPM_Rate | 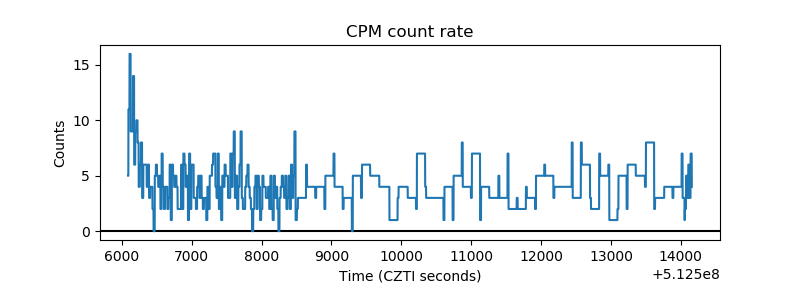 |
| CZT Counter | 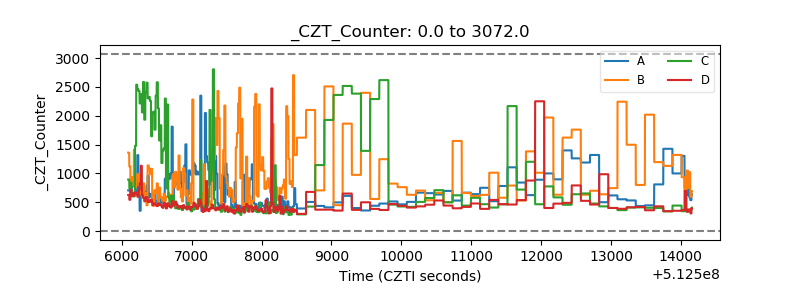 |
| +2.5 Volts monitor |  |
| +5 Volts monitor |  |
| _ROLL_ROT | 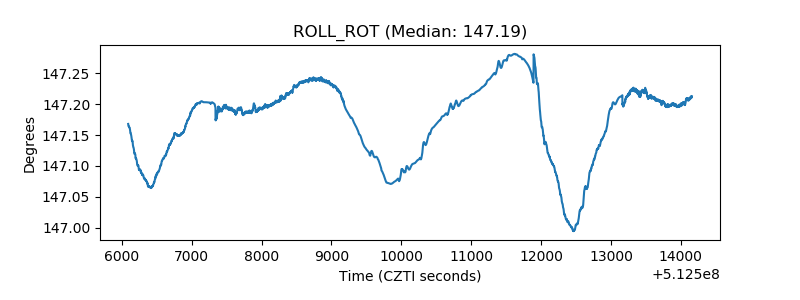 |
| _Roll_DEC | 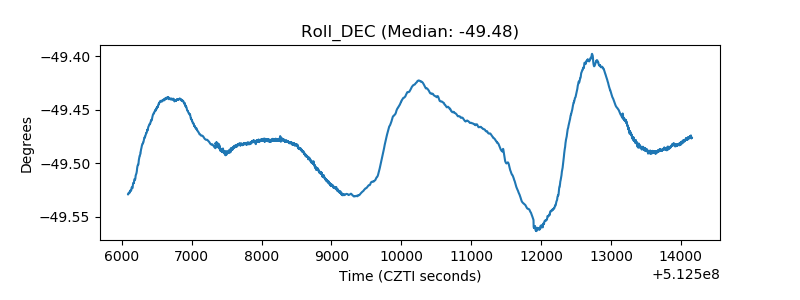 |
| _Roll_RA | 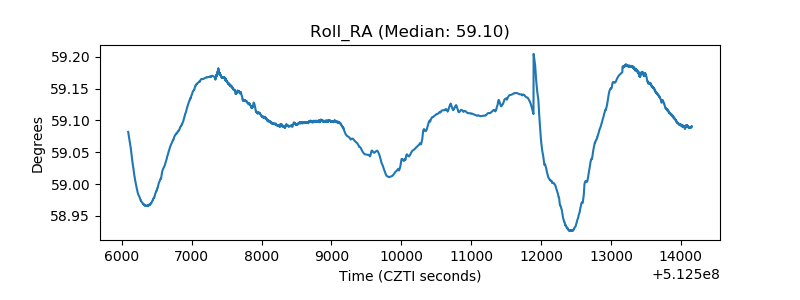 |
| Veto Counter | 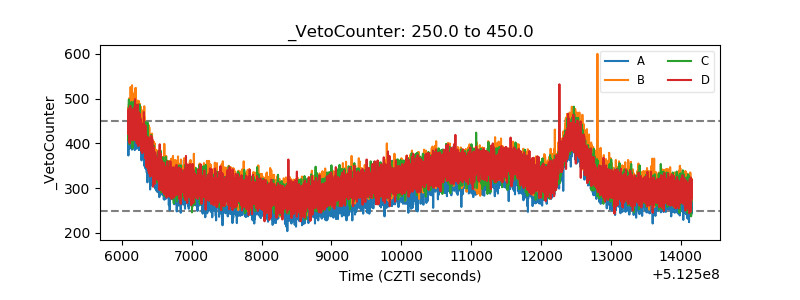 |