| Param | Original file | Final file |
|---|---|---|
| Filename | modeM0/AS1A14_083T03_9000006562_56818cztM0_level2.fits | modeM0/AS1A14_083T03_9000006562_56818cztM0_level2_quad_clean.evt |
| Size (bytes) | 701,942,400 | 105,238,080 |
| Size | 669.4 MB | 100.4 MB |
| Events in quadrant A | 5,967,651 | 733,618 |
| Events in quadrant B | 11,362,581 | 540,523 |
| Events in quadrant C | 4,248,302 | 687,167 |
| Events in quadrant D | 3,784,715 | 668,822 |
| Mode M9 | |||
|---|---|---|---|
| Quadrant | BADHDUFLAG | Total packets | Discarded packets |
| A | 0 | 1 | 0 |
| B | 0 | 1 | 0 |
| C | 0 | 1 | 0 |
| D | 0 | 1 | 0 |
| Mode SS | |||
|---|---|---|---|
| Quadrant | BADHDUFLAG | Total packets | Discarded packets |
| A | 0 | 162 | 0 |
| B | 0 | 162 | 0 |
| C | 0 | 162 | 0 |
| D | 0 | 162 | 0 |
| Mode M0 | |||
|---|---|---|---|
| Quadrant | BADHDUFLAG | Total packets | Discarded packets |
| A | 0 | 23328 | 1 |
| B | 0 | 39319 | 8 |
| C | 0 | 18870 | 1 |
| D | 0 | 17532 | 1 |
| Quadrant | Total seconds | Saturated seconds | Saturation percentage |
|---|---|---|---|
| A | 7998 | 236 | 2.950738% |
| B | 7997 | 2962 | 37.038890% |
| C | 7998 | 263 | 3.288322% |
| D | 7998 | 60 | 0.750188% |
Noise dominated data is calculated using 1-second bins in cleaned event files. If a bin has >2000 counts, and if more than 50% of those come from <1% of pixels, then it is considered to be noise-dominated and hence unusable.
| Quadrant | # 1 sec bins | Bins with >0 counts | Bins with >2000 counts | High rate bins dominated by noise | Noise dominated (total time) | Noise dominated (detector-on time) | Marked lightcurve |
|---|---|---|---|---|---|---|---|
| A | 8013 | 7999 | 37 | 37 | 0.46% | 0.46% | 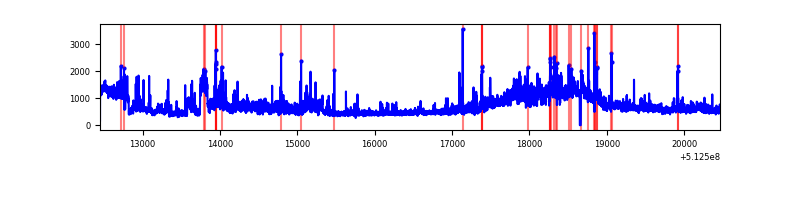 |
| B | 8012 | 7998 | 1991 | 1991 | 24.85% | 24.89% | 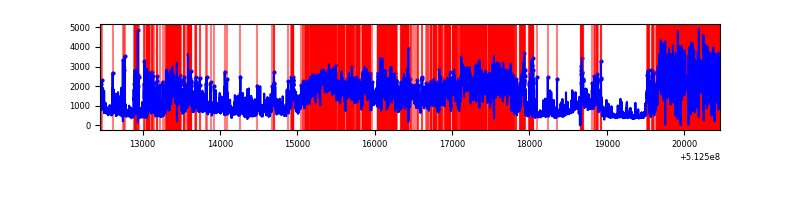 |
| C | 8013 | 7999 | 208 | 208 | 2.60% | 2.60% | 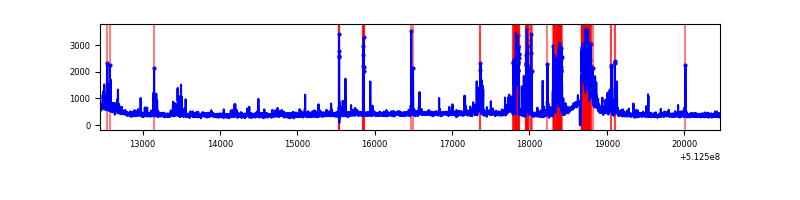 |
| D | 8013 | 7999 | 36 | 36 | 0.45% | 0.45% | 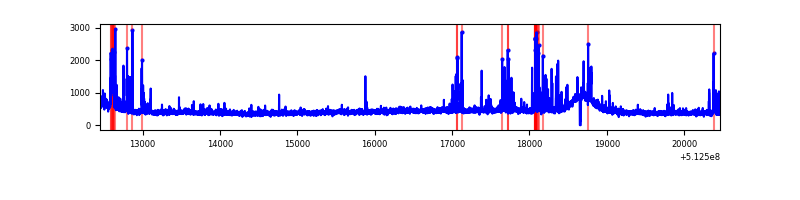 |
Top three noisy pixels from each quadrant. If the there are fewer than three noisy pixels in the level2.evt file, extra rows are filled as -1
| Pixel properties | Quadrant properties | ||||||
|---|---|---|---|---|---|---|---|
| Quadrant | DetID | PixID | Counts | Sigma | Mean | Median | Sigma |
| A | 3 | 14 | 1908829 | 8969.72 | 855 | 834 | 212.7 |
| A | 4 | 249 | 464931 | 2181.78 | 855 | 834 | 212.7 |
| A | 10 | 251 | 237780 | 1113.91 | 855 | 834 | 212.7 |
| B | 4 | 206 | 6434314 | 40846.97 | 720 | 695 | 157.5 |
| B | 5 | 185 | 1182526 | 7503.43 | 720 | 695 | 157.5 |
| B | 2 | 249 | 434449 | 2753.9 | 720 | 695 | 157.5 |
| C | 2 | 12 | 493735 | 2216.06 | 812 | 804 | 222.4 |
| C | 15 | 230 | 239205 | 1071.78 | 812 | 804 | 222.4 |
| C | 9 | 38 | 122874 | 548.79 | 812 | 804 | 222.4 |
| D | 2 | 31 | 181506 | 769.9 | 830 | 790 | 234.7 |
| D | 2 | 249 | 167964 | 712.21 | 830 | 790 | 234.7 |
| D | 5 | 173 | 80125 | 337.99 | 830 | 790 | 234.7 |
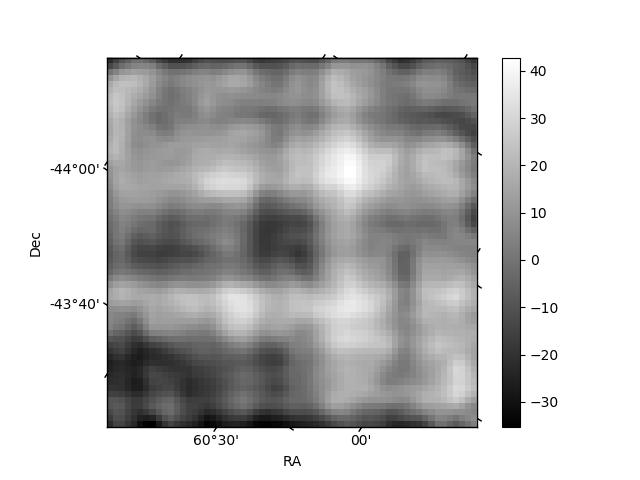
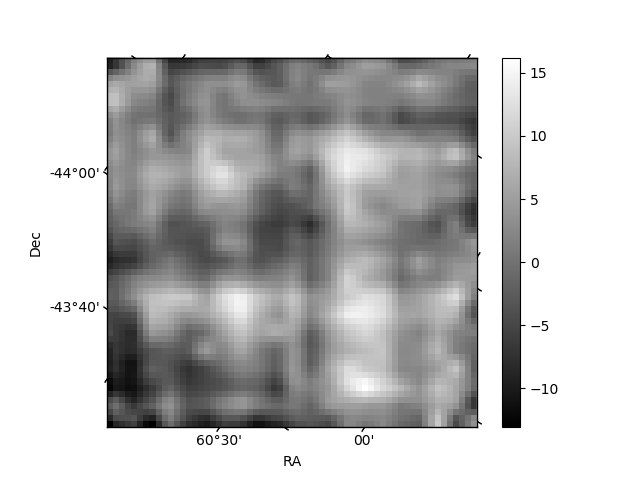
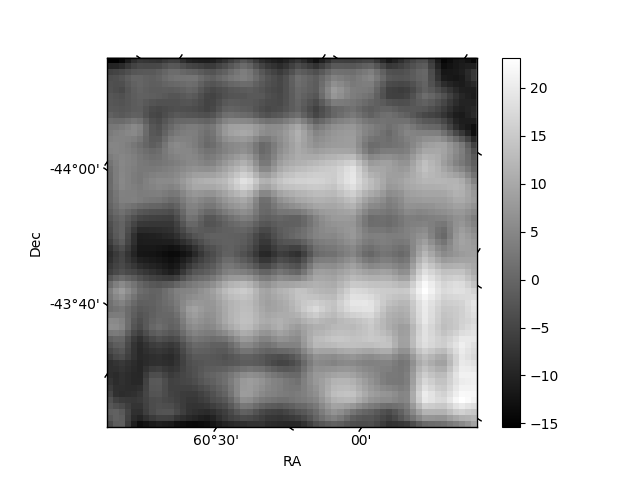
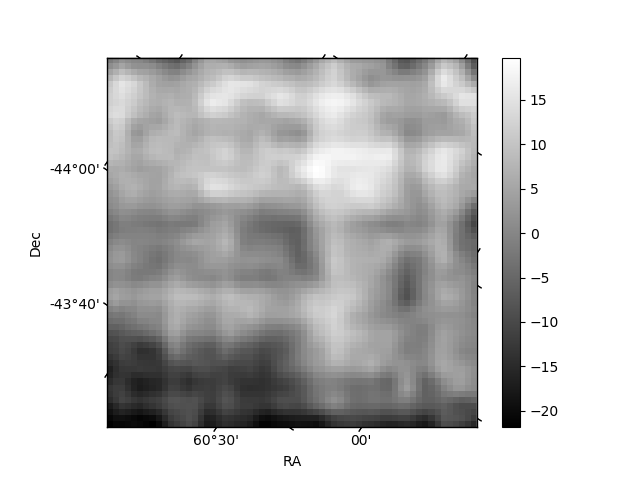
Histogram calculated using DETX and DETY for each event in the final _common_clean file
| Quadrant A | 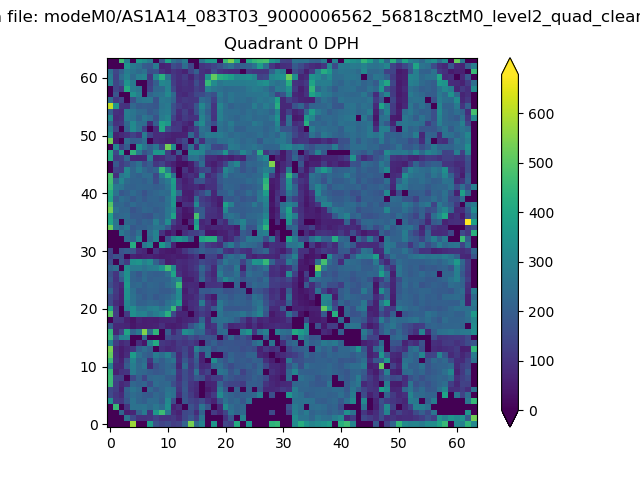 |
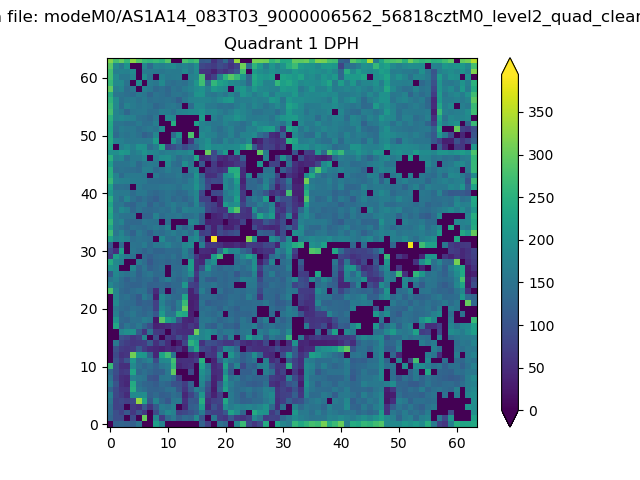 |
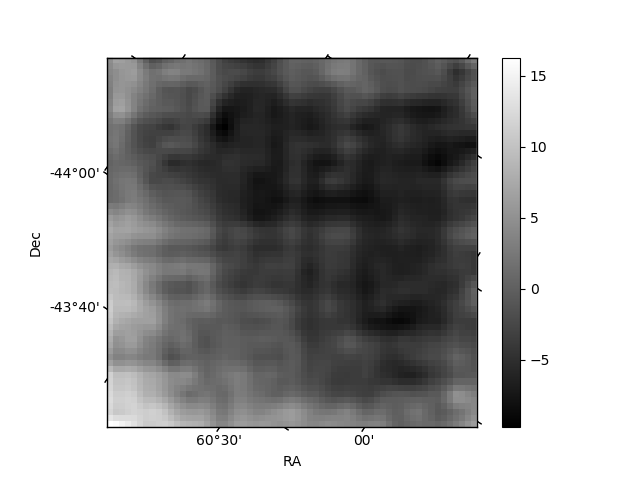
Quadrant B |
|---|---|---|---|
| Quadrant D | 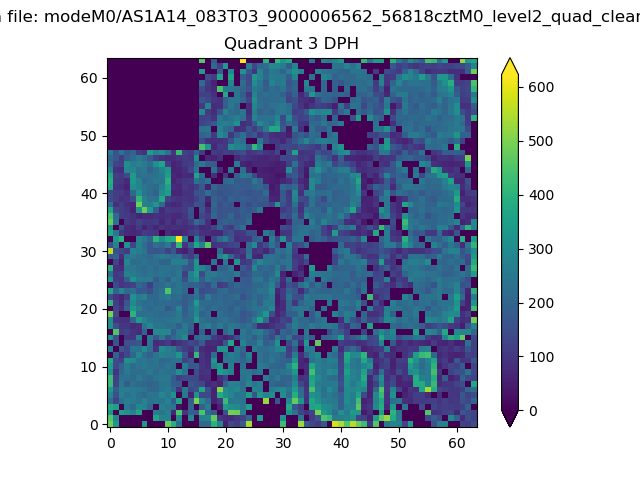 |
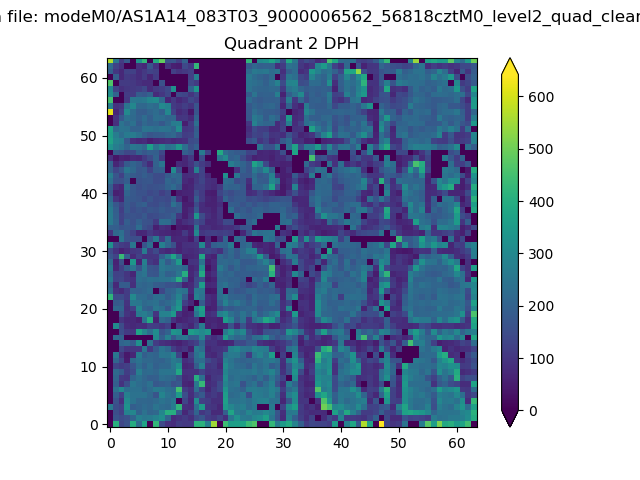 |
Quadrant C |
| Plot type | Count rate plots | Images |
|---|---|---|
| Comparison with Poisson distribution Blue bars denote a histogram of data divided into 1 sec bins. Red curve is a Poisson curve with rate = median count rate of data. |
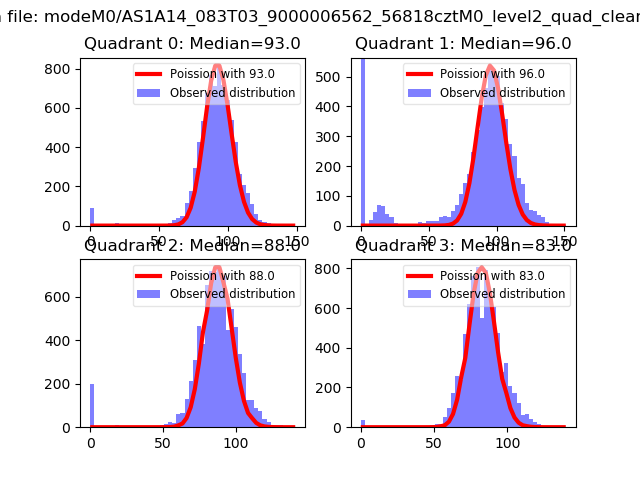 |
 |
| Quadrant-wise count rates Data is divided into 100 sec bins |
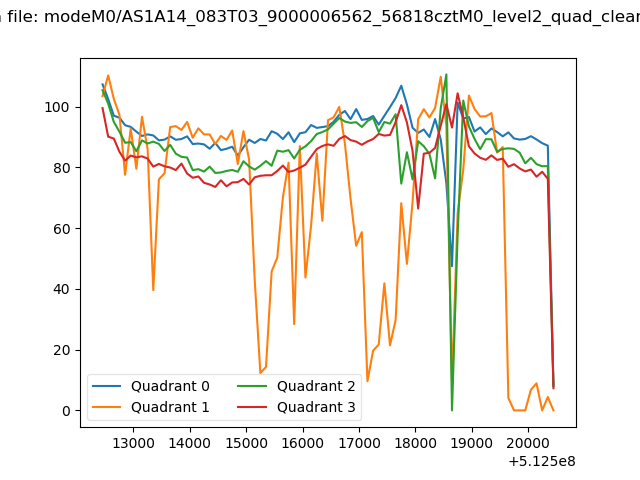 |
|
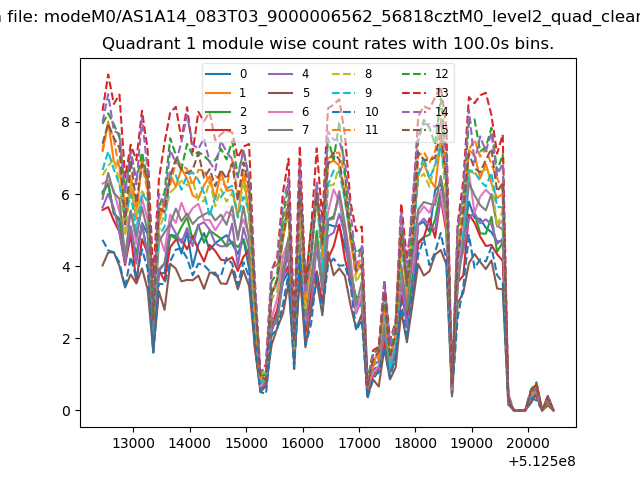
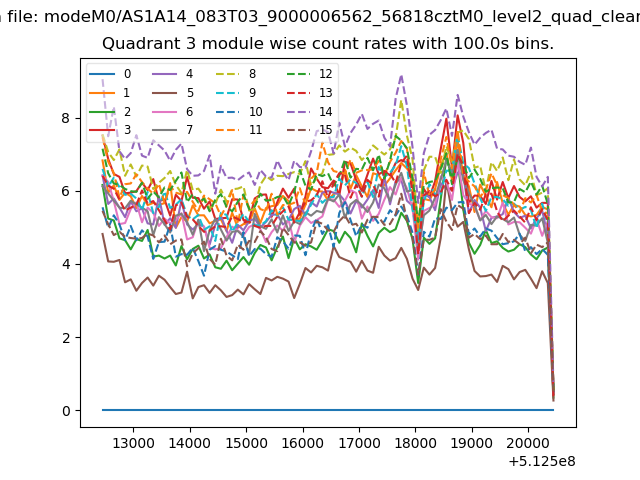
| Module-wise count rates for Quadrant A Data is divided into 100 sec bins |
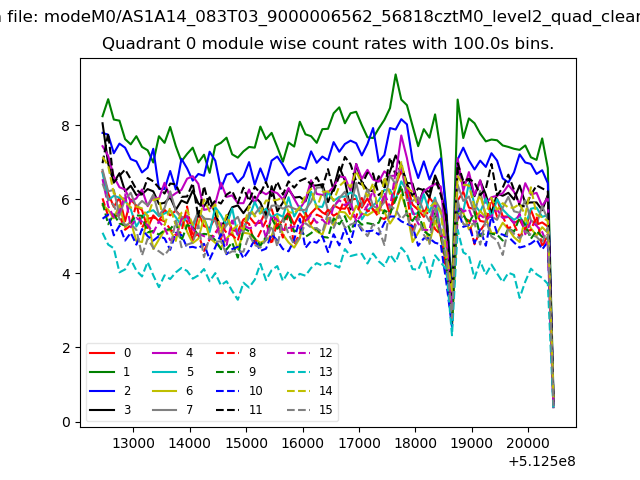 |
 |
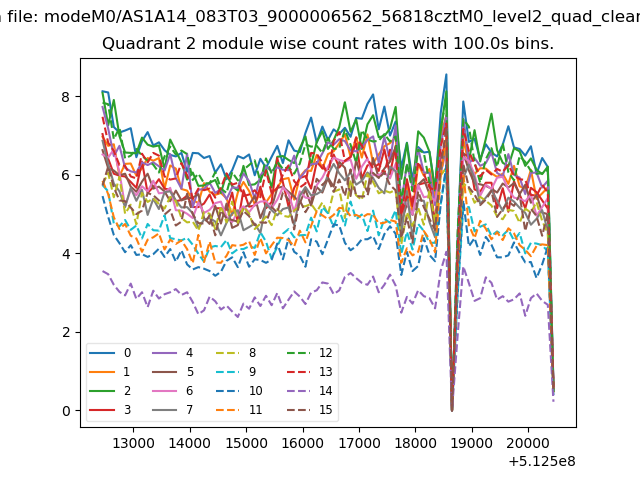
| Module-wise count rates for Quadrant B Data is divided into 100 sec bins |
 |
 |
| Module-wise count rates for Quadrant C Data is divided into 100 sec bins |
 |
 |
| Module-wise count rates for Quadrant D Data is divided into 100 sec bins |
 |
 |
| Parameter | Plot |
|---|---|
| CZT HV Monitor |  |
| D_VDD | 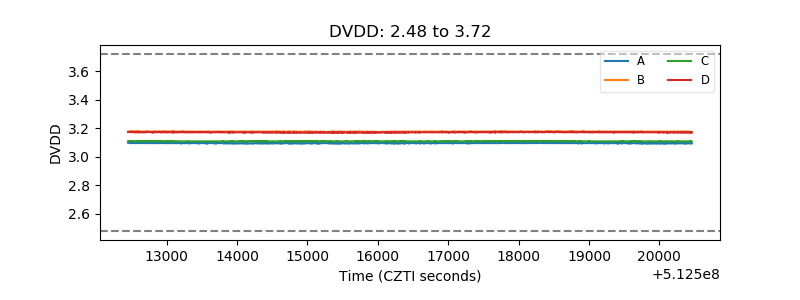 |
| Temperature 1 | 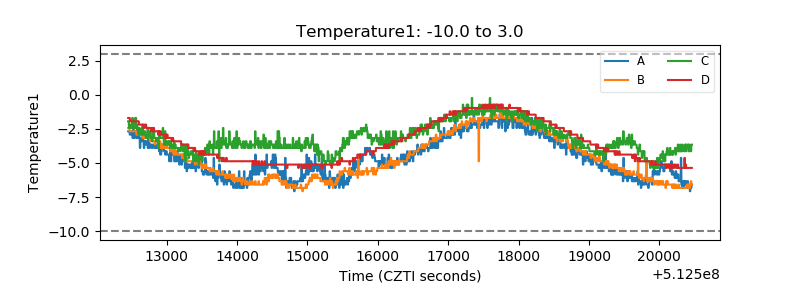 |
| Veto HV Monitor | 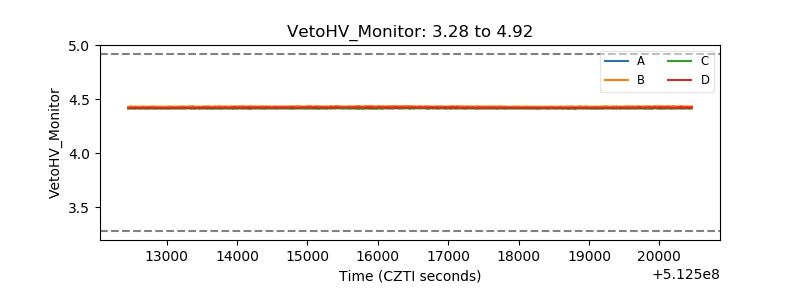 |
| Veto LLD | 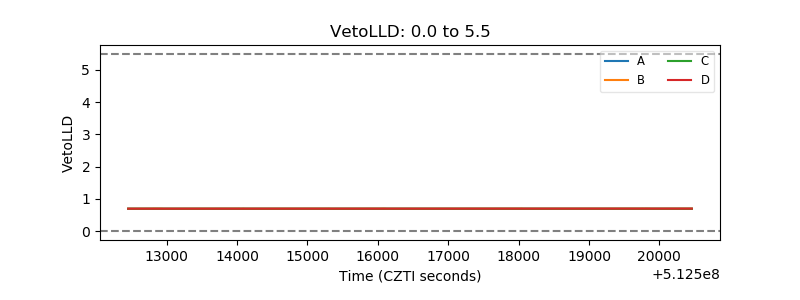 |
| Alpha Counter | 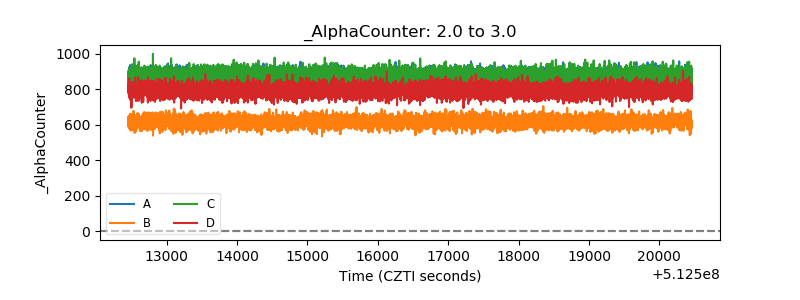 |
| _CPM_Rate | 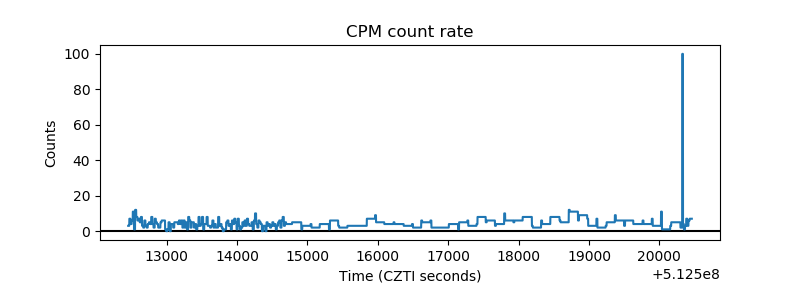 |
| CZT Counter | 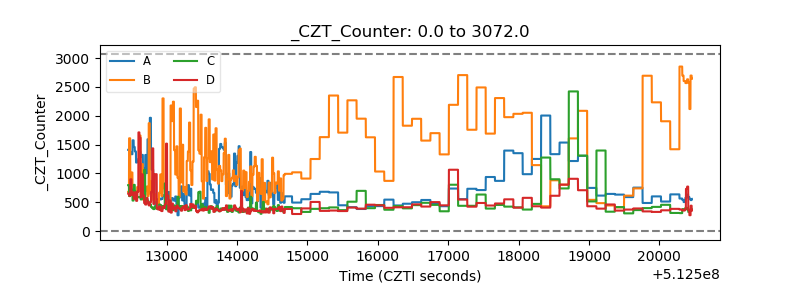 |
| +2.5 Volts monitor |  |
| +5 Volts monitor |  |
| _ROLL_ROT | 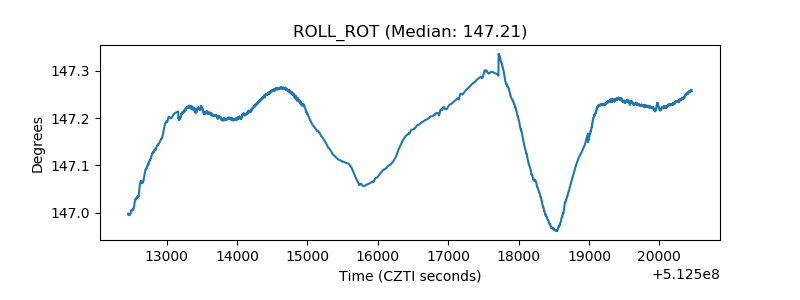 |
| _Roll_DEC | 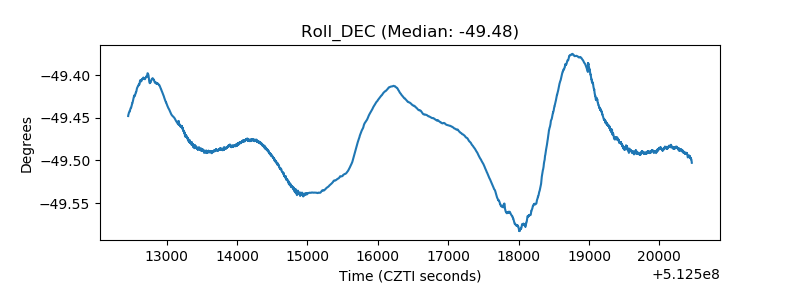 |
| _Roll_RA | 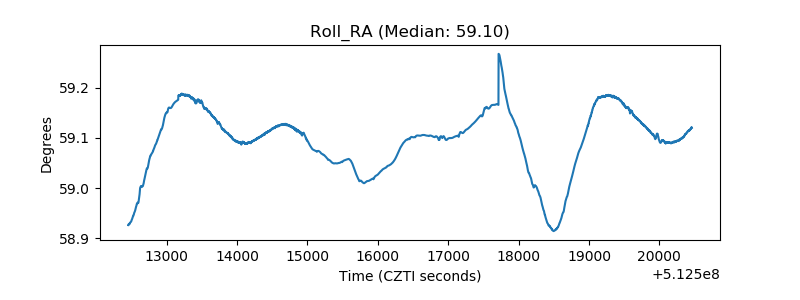 |
| Veto Counter | 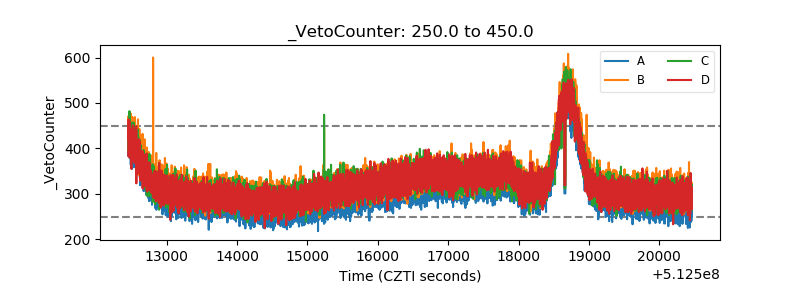 |