| Param | Original file | Final file |
|---|---|---|
| Filename | modeM0/AS1A14_083T03_9000006562_56821cztM0_level2.fits | modeM0/AS1A14_083T03_9000006562_56821cztM0_level2_quad_clean.evt |
| Size (bytes) | 1,611,610,560 | 247,677,120 |
| Size | 1.5 GB | 236.2 MB |
| Events in quadrant A | 13,080,516 | 1,700,840 |
| Events in quadrant B | 22,270,625 | 1,382,043 |
| Events in quadrant C | 9,891,088 | 1,619,576 |
| Events in quadrant D | 12,968,754 | 1,506,951 |
| Mode M9 | |||
|---|---|---|---|
| Quadrant | BADHDUFLAG | Total packets | Discarded packets |
| A | 0 | 18 | 0 |
| B | 0 | 18 | 0 |
| C | 0 | 18 | 0 |
| D | 0 | 18 | 0 |
| Mode SS | |||
|---|---|---|---|
| Quadrant | BADHDUFLAG | Total packets | Discarded packets |
| A | 0 | 376 | 0 |
| B | 0 | 376 | 0 |
| C | 0 | 376 | 0 |
| D | 0 | 376 | 0 |
| Mode M0 | |||
|---|---|---|---|
| Quadrant | BADHDUFLAG | Total packets | Discarded packets |
| A | 0 | 51941 | 3 |
| B | 0 | 79035 | 3 |
| C | 0 | 43230 | 3 |
| D | 0 | 52122 | 3 |
| Quadrant | Total seconds | Saturated seconds | Saturation percentage |
|---|---|---|---|
| A | 18721 | 387 | 2.067197% |
| B | 18721 | 4824 | 25.767854% |
| C | 18722 | 349 | 1.864117% |
| D | 18722 | 607 | 3.242175% |
Noise dominated data is calculated using 1-second bins in cleaned event files. If a bin has >2000 counts, and if more than 50% of those come from <1% of pixels, then it is considered to be noise-dominated and hence unusable.
| Quadrant | # 1 sec bins | Bins with >0 counts | Bins with >2000 counts | High rate bins dominated by noise | Noise dominated (total time) | Noise dominated (detector-on time) | Marked lightcurve |
|---|---|---|---|---|---|---|---|
| A | 20356 | 18724 | 125 | 125 | 0.61% | 0.67% | 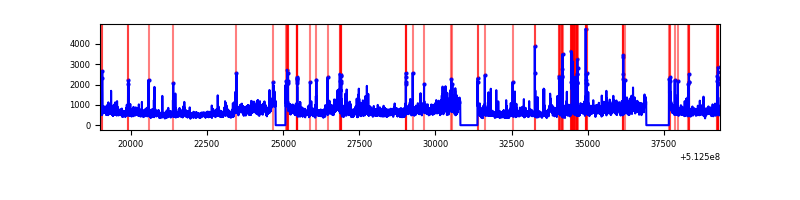 |
| B | 20356 | 18724 | 3377 | 3377 | 16.59% | 18.04% | 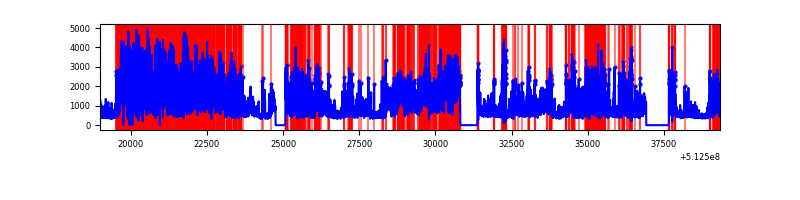 |
| C | 20357 | 18725 | 130 | 130 | 0.64% | 0.69% | 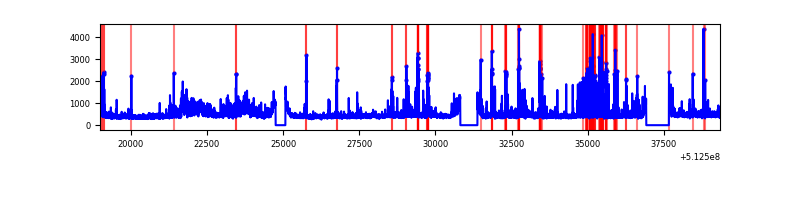 |
| D | 20357 | 18725 | 604 | 604 | 2.97% | 3.23% | 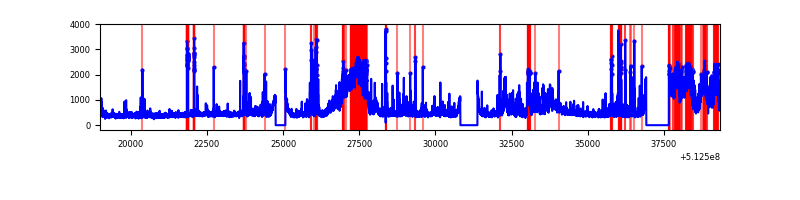 |
Top three noisy pixels from each quadrant. If the there are fewer than three noisy pixels in the level2.evt file, extra rows are filled as -1
| Pixel properties | Quadrant properties | ||||||
|---|---|---|---|---|---|---|---|
| Quadrant | DetID | PixID | Counts | Sigma | Mean | Median | Sigma |
| A | 3 | 14 | 4251586 | 8743.38 | 1974 | 1924 | 486.0 |
| A | 10 | 251 | 684660 | 1404.68 | 1974 | 1924 | 486.0 |
| A | 4 | 249 | 355127 | 726.69 | 1974 | 1924 | 486.0 |
| B | 4 | 206 | 9669745 | 26085.29 | 1735 | 1670 | 370.6 |
| B | 5 | 185 | 2655842 | 7161.18 | 1735 | 1670 | 370.6 |
| B | 5 | 172 | 1392709 | 3753.14 | 1735 | 1670 | 370.6 |
| C | 13 | 3 | 975577 | 1843.8 | 1931 | 1906 | 528.1 |
| C | 9 | 38 | 516363 | 974.21 | 1931 | 1906 | 528.1 |
| C | 12 | 249 | 322239 | 606.6 | 1931 | 1906 | 528.1 |
| D | 15 | 142 | 4317082 | 8071.98 | 1909 | 1823 | 534.6 |
| D | 2 | 31 | 477517 | 889.82 | 1909 | 1823 | 534.6 |
| D | 2 | 249 | 287808 | 534.95 | 1909 | 1823 | 534.6 |
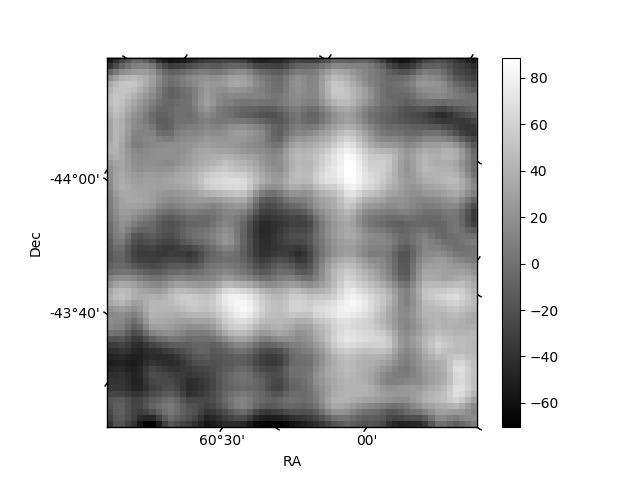
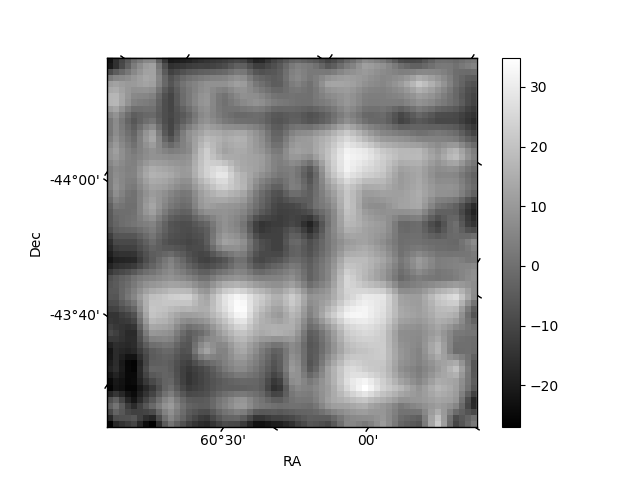
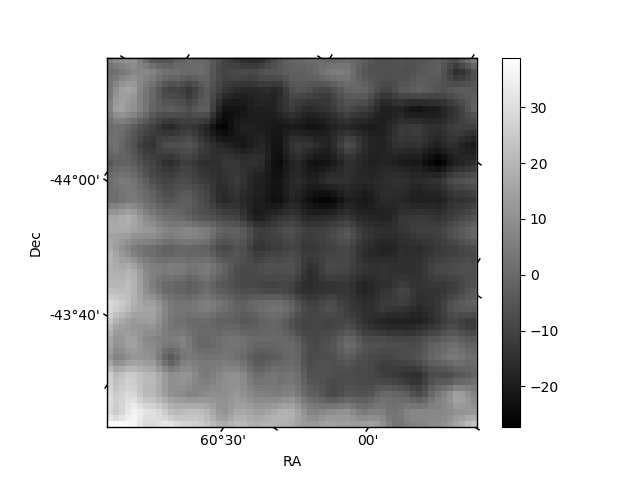
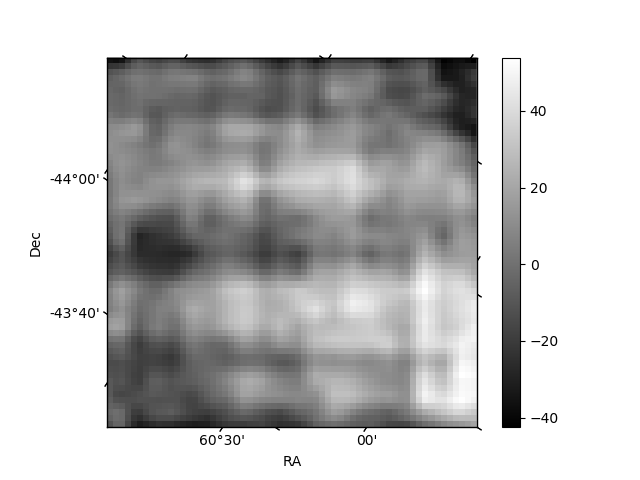
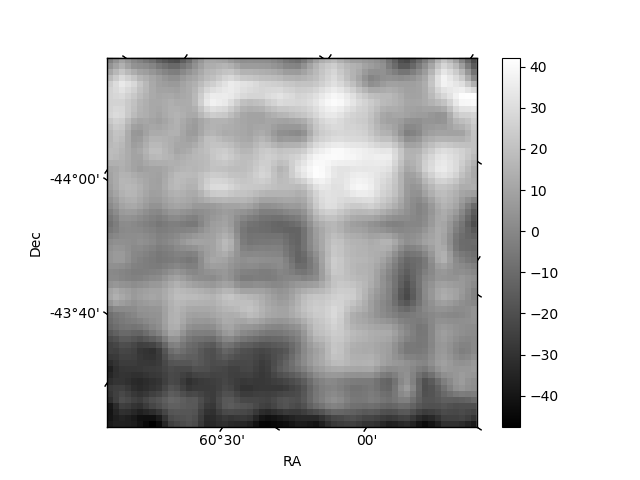
Histogram calculated using DETX and DETY for each event in the final _common_clean file
| Quadrant A | 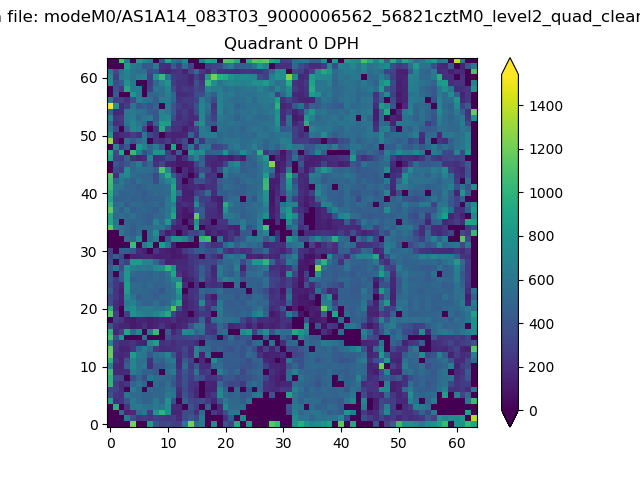 |
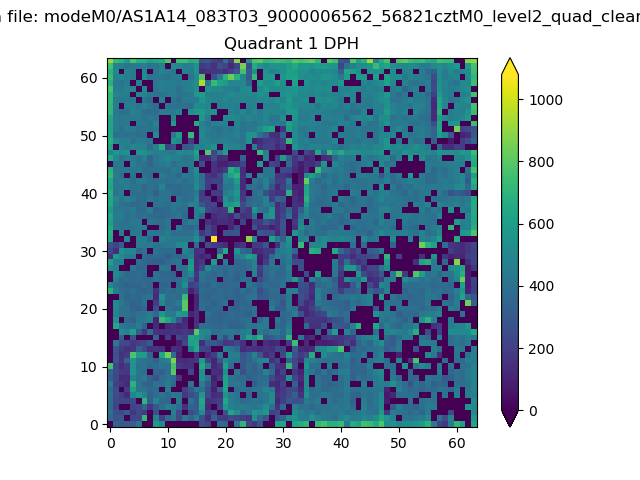 |
Quadrant B |
|---|---|---|---|
| Quadrant D | 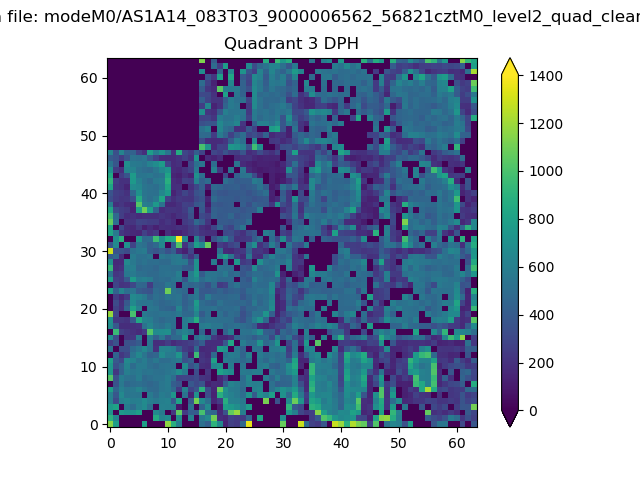 |
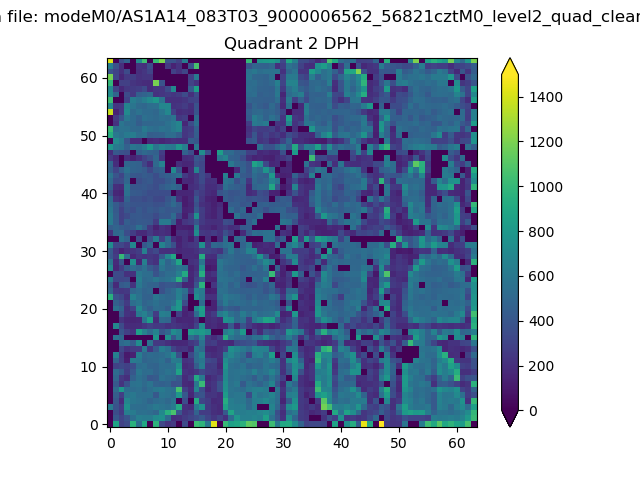 |
Quadrant C |
| Plot type | Count rate plots | Images |
|---|---|---|
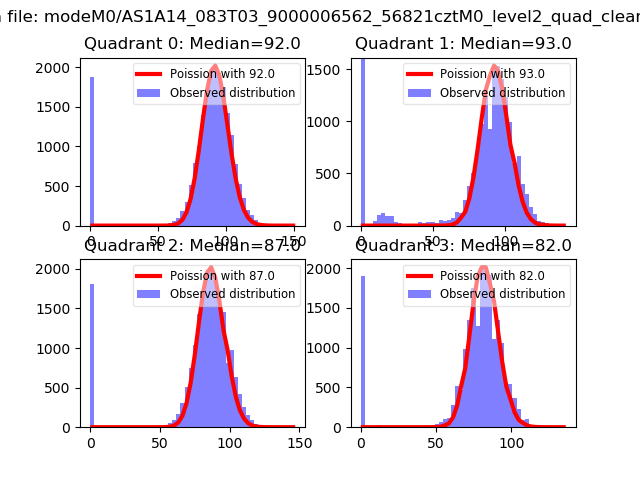
| Comparison with Poisson distribution Blue bars denote a histogram of data divided into 1 sec bins. Red curve is a Poisson curve with rate = median count rate of data. |
 |
 |
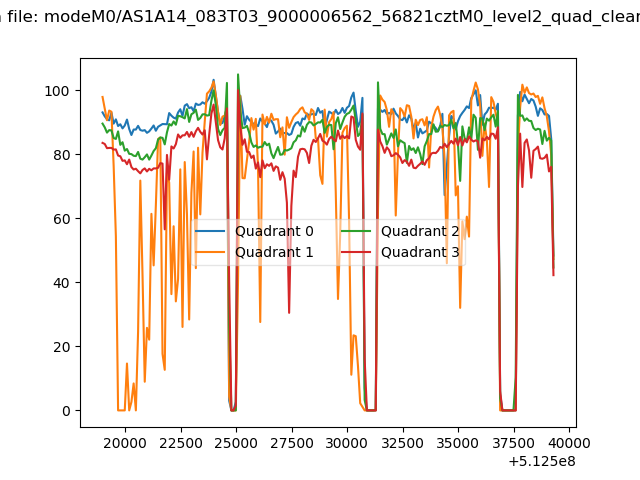
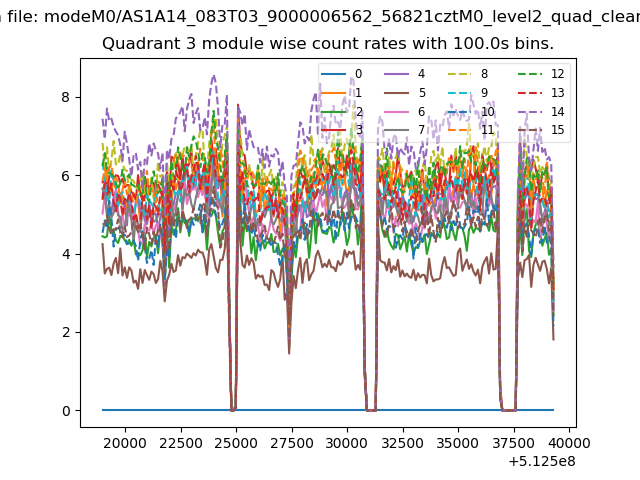
| Quadrant-wise count rates Data is divided into 100 sec bins |
 |
|
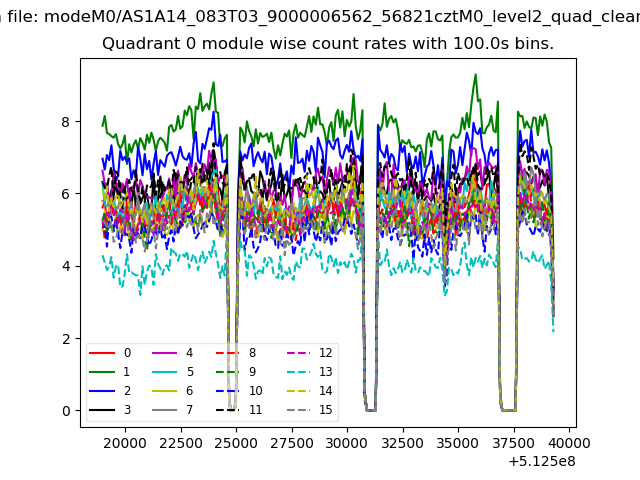
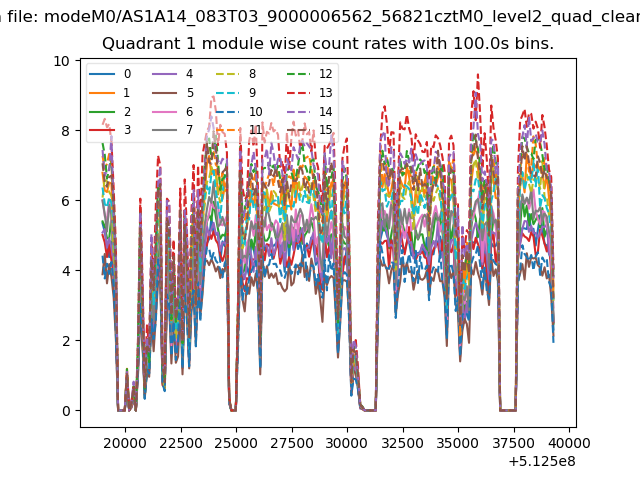
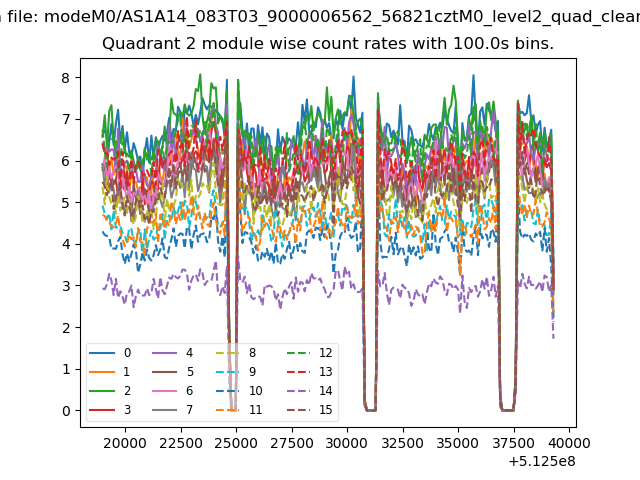
| Module-wise count rates for Quadrant A Data is divided into 100 sec bins |
 |
 |
| Module-wise count rates for Quadrant B Data is divided into 100 sec bins |
 |
 |
| Module-wise count rates for Quadrant C Data is divided into 100 sec bins |
 |
 |
| Module-wise count rates for Quadrant D Data is divided into 100 sec bins |
 |
 |
| Parameter | Plot |
|---|---|
| CZT HV Monitor | 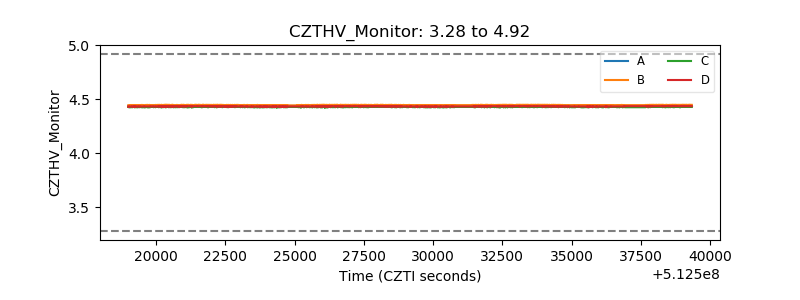 |
| D_VDD | 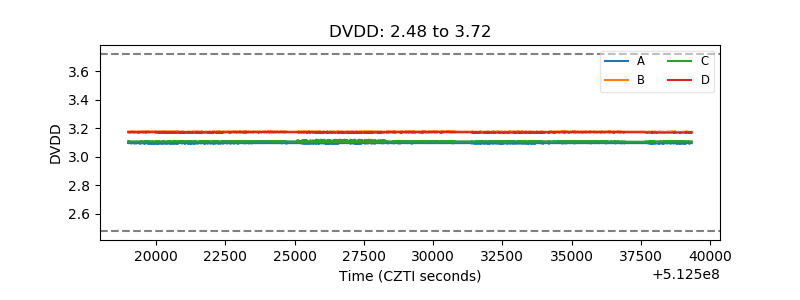 |
| Temperature 1 | 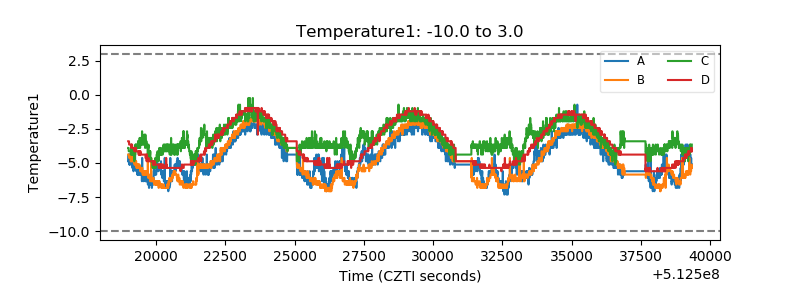 |
| Veto HV Monitor | 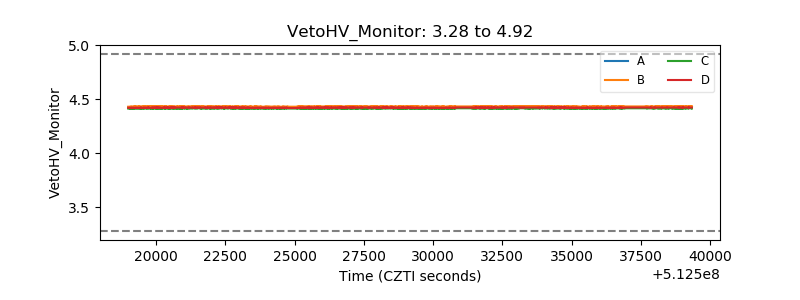 |
| Veto LLD | 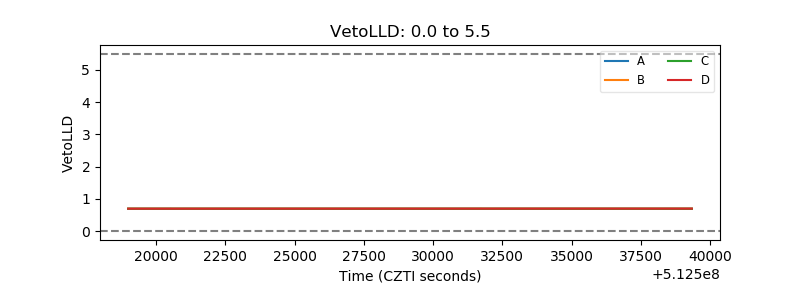 |
| Alpha Counter | 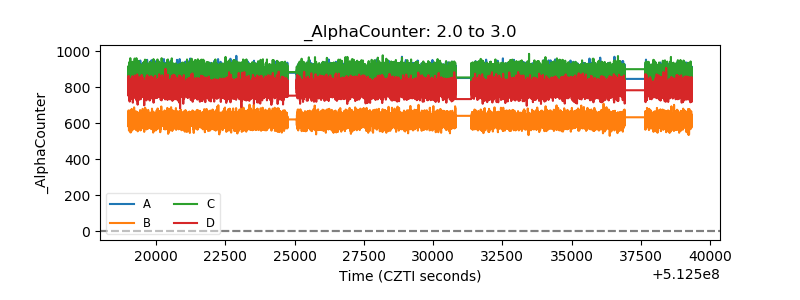 |
| _CPM_Rate | 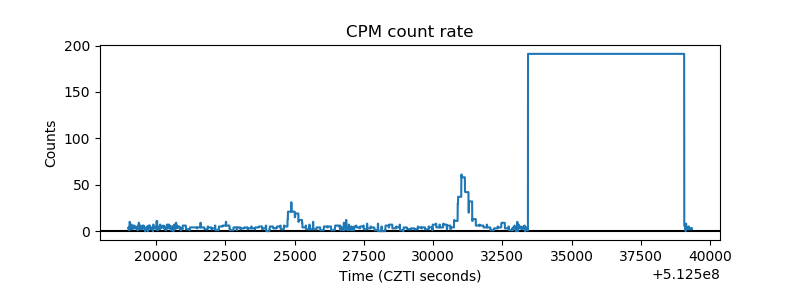 |
| CZT Counter | 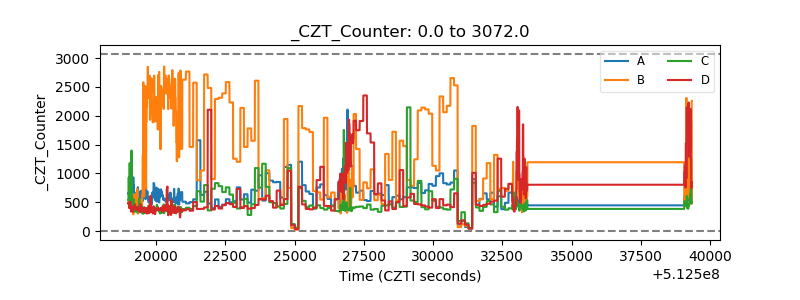 |
| +2.5 Volts monitor |  |
| +5 Volts monitor |  |
| _ROLL_ROT |  |
| _Roll_DEC | 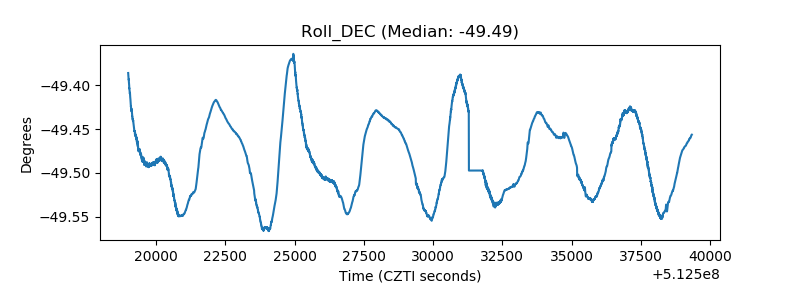 |
| _Roll_RA | 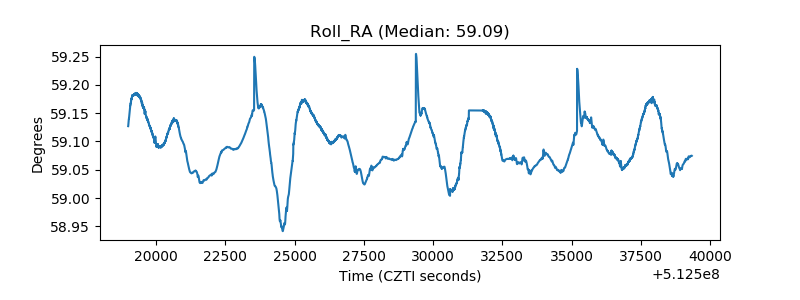 |
| Veto Counter | 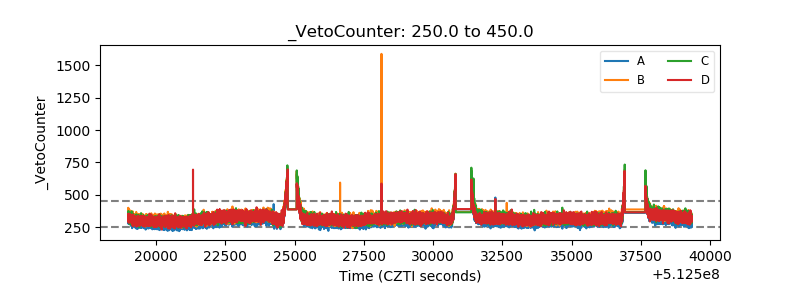 |