| Param | Original file | Final file |
|---|---|---|
| Filename | modeM0/AS1A14_083T03_9000006562_56824cztM0_level2.fits | modeM0/AS1A14_083T03_9000006562_56824cztM0_level2_quad_clean.evt |
| Size (bytes) | 509,014,080 | 86,598,720 |
| Size | 485.4 MB | 82.6 MB |
| Events in quadrant A | 3,688,433 | 590,533 |
| Events in quadrant B | 3,420,845 | 636,826 |
| Events in quadrant C | 3,660,789 | 557,420 |
| Events in quadrant D | 7,589,891 | 404,591 |
| Mode M9 | |||
|---|---|---|---|
| Quadrant | BADHDUFLAG | Total packets | Discarded packets |
| A | 0 | 10 | 0 |
| B | 0 | 10 | 0 |
| C | 0 | 10 | 0 |
| D | 0 | 10 | 0 |
| Mode SS | |||
|---|---|---|---|
| Quadrant | BADHDUFLAG | Total packets | Discarded packets |
| A | 0 | 126 | 0 |
| B | 0 | 126 | 0 |
| C | 0 | 126 | 0 |
| D | 0 | 126 | 0 |
| Mode M0 | |||
|---|---|---|---|
| Quadrant | BADHDUFLAG | Total packets | Discarded packets |
| A | 0 | 15699 | 1 |
| B | 0 | 14422 | 1 |
| C | 0 | 15350 | 1 |
| D | 0 | 26880 | 1 |
| Quadrant | Total seconds | Saturated seconds | Saturation percentage |
|---|---|---|---|
| A | 6201 | 158 | 2.547976% |
| B | 6201 | 177 | 2.854378% |
| C | 6201 | 266 | 4.289631% |
| D | 6201 | 1648 | 26.576359% |
Noise dominated data is calculated using 1-second bins in cleaned event files. If a bin has >2000 counts, and if more than 50% of those come from <1% of pixels, then it is considered to be noise-dominated and hence unusable.
| Quadrant | # 1 sec bins | Bins with >0 counts | Bins with >2000 counts | High rate bins dominated by noise | Noise dominated (total time) | Noise dominated (detector-on time) | Marked lightcurve |
|---|---|---|---|---|---|---|---|
| A | 7216 | 6202 | 45 | 45 | 0.62% | 0.73% | 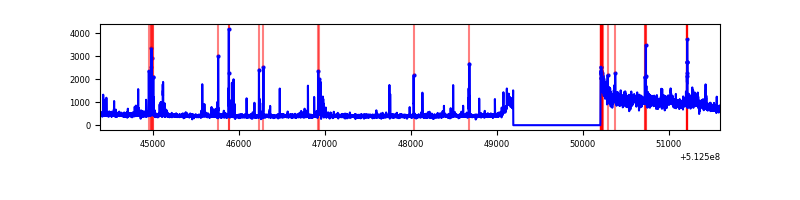 |
| B | 7216 | 6202 | 56 | 56 | 0.78% | 0.90% | 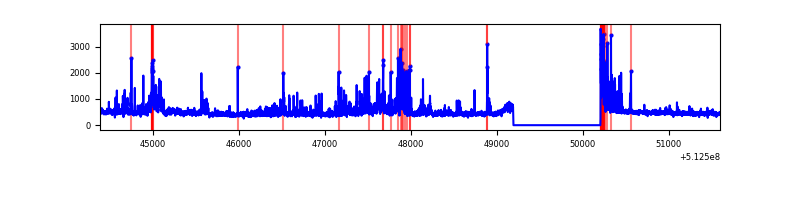 |
| C | 7216 | 6202 | 165 | 165 | 2.29% | 2.66% | 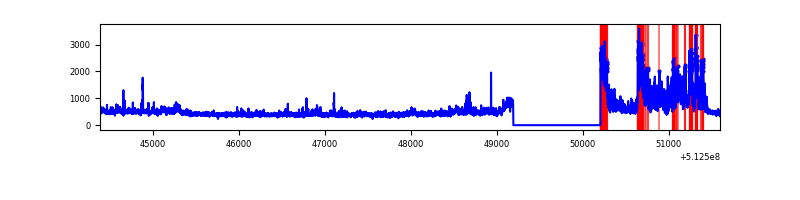 |
| D | 7216 | 6202 | 1552 | 1552 | 21.51% | 25.02% | 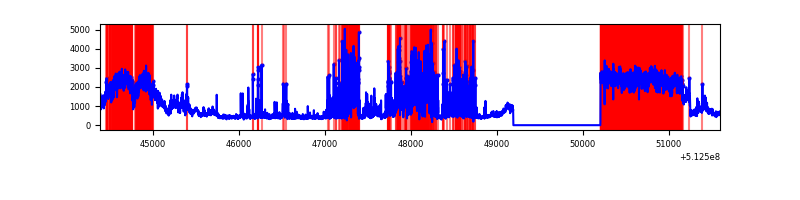 |
Top three noisy pixels from each quadrant. If the there are fewer than three noisy pixels in the level2.evt file, extra rows are filled as -1
| Pixel properties | Quadrant properties | ||||||
|---|---|---|---|---|---|---|---|
| Quadrant | DetID | PixID | Counts | Sigma | Mean | Median | Sigma |
| A | 3 | 14 | 828837 | 5010.32 | 671 | 655 | 165.3 |
| A | 10 | 251 | 230520 | 1390.63 | 671 | 655 | 165.3 |
| A | 7 | 64 | 16040 | 93.08 | 671 | 655 | 165.3 |
| B | 8 | 128 | 178746 | 1250.44 | 661 | 637 | 142.4 |
| B | 5 | 185 | 178112 | 1245.98 | 661 | 637 | 142.4 |
| B | 4 | 206 | 177792 | 1243.74 | 661 | 637 | 142.4 |
| C | 15 | 230 | 629736 | 3569.68 | 651 | 644 | 176.2 |
| C | 1 | 16 | 119542 | 674.67 | 651 | 644 | 176.2 |
| C | 6 | 13 | 113027 | 637.7 | 651 | 644 | 176.2 |
| D | 15 | 142 | 3528947 | 21230.95 | 595 | 570 | 166.2 |
| D | 2 | 249 | 1504489 | 9049.38 | 595 | 570 | 166.2 |
| D | 2 | 120 | 81934 | 489.58 | 595 | 570 | 166.2 |
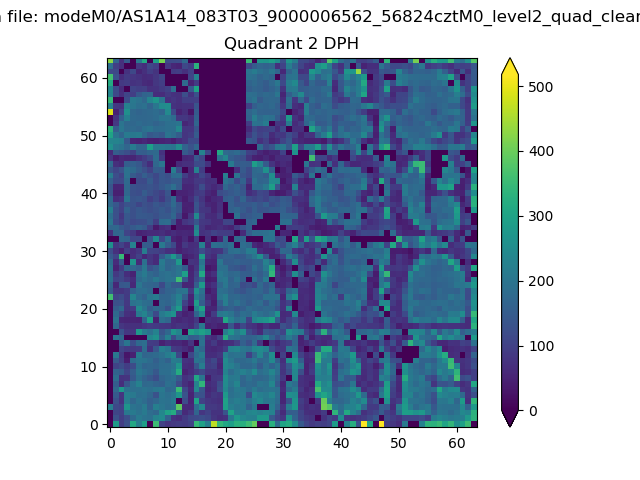
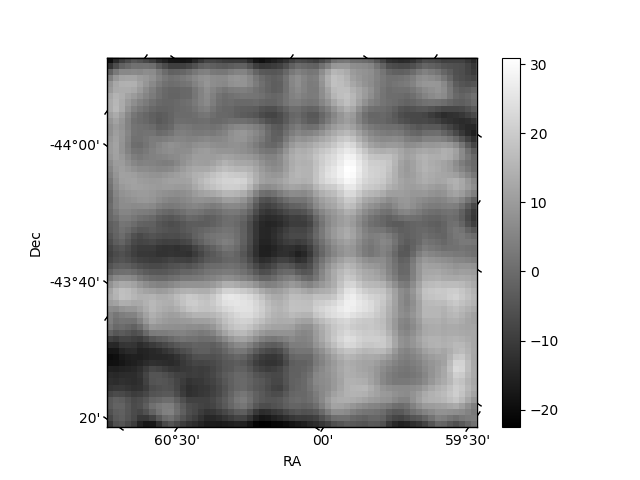
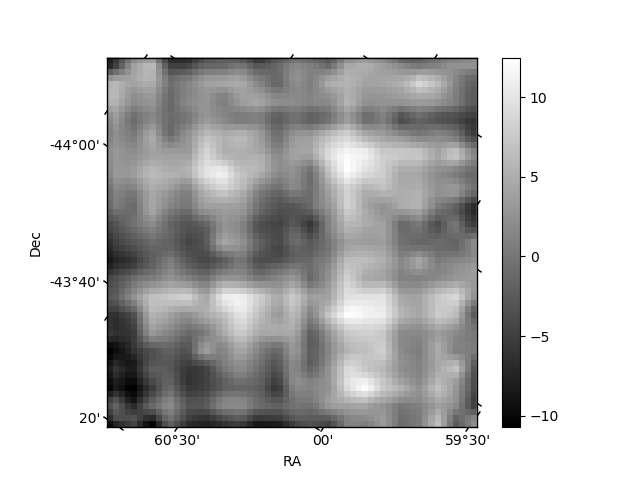
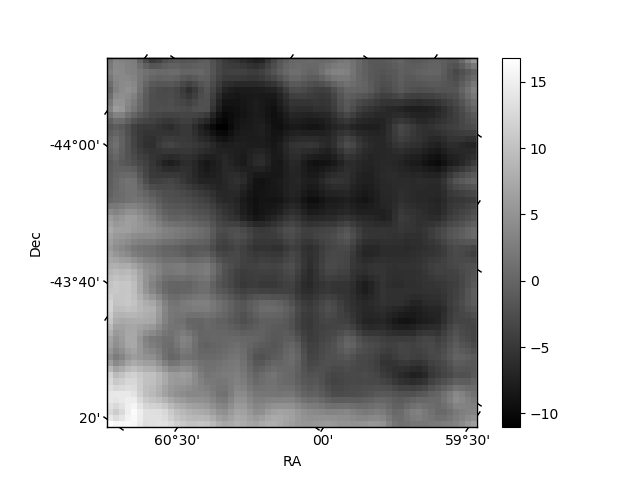
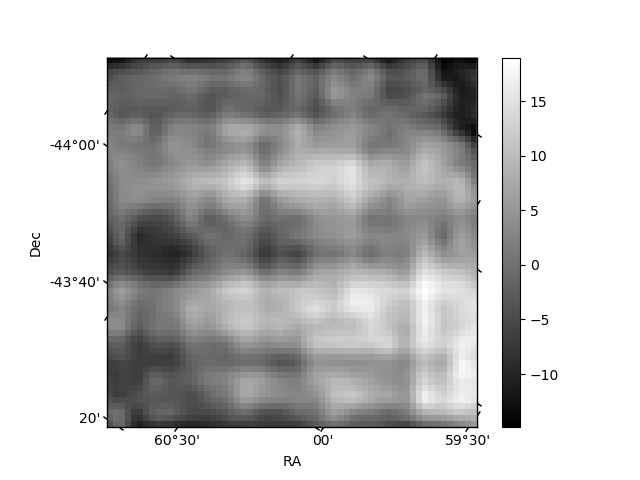
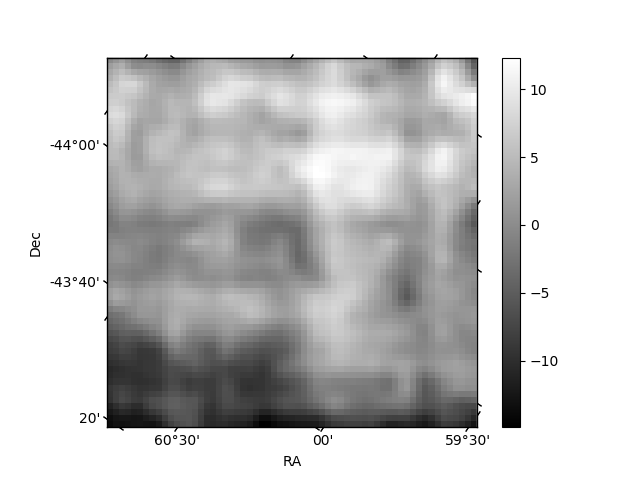
Histogram calculated using DETX and DETY for each event in the final _common_clean file
| Quadrant A | 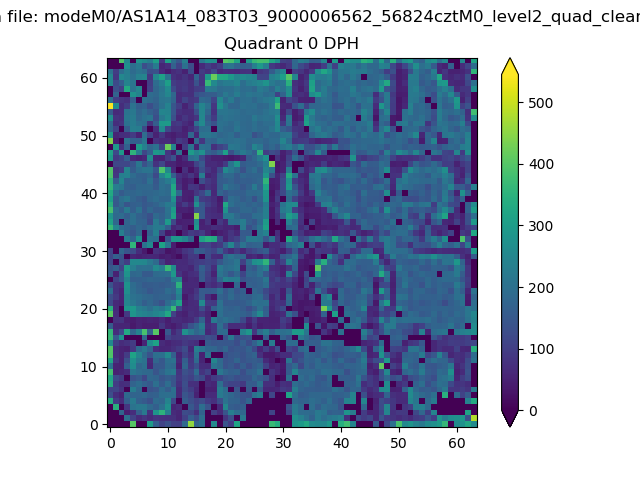 |
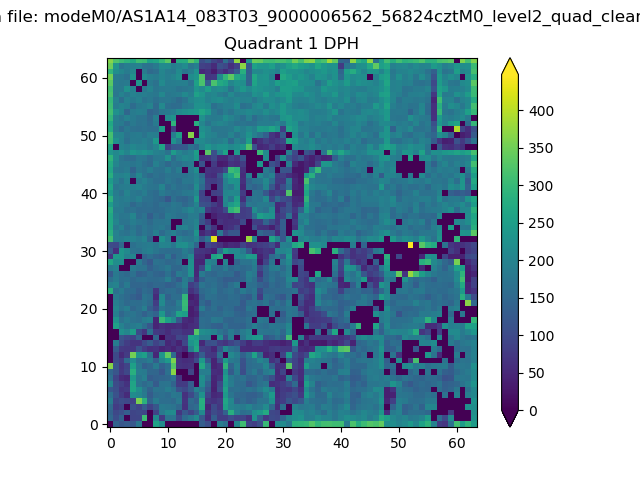 |
Quadrant B |
|---|---|---|---|
| Quadrant D | 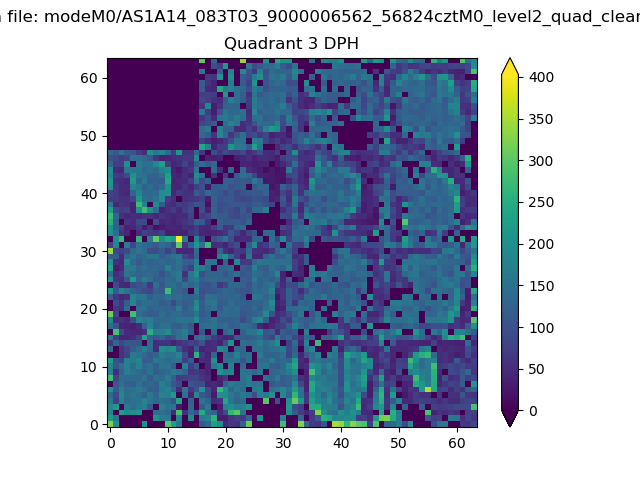 |
 |
Quadrant C |
| Plot type | Count rate plots | Images |
|---|---|---|
| Comparison with Poisson distribution Blue bars denote a histogram of data divided into 1 sec bins. Red curve is a Poisson curve with rate = median count rate of data. |
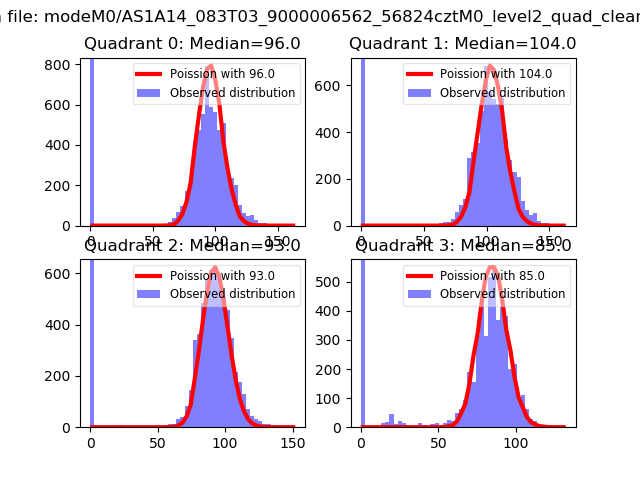 |
 |
| Quadrant-wise count rates Data is divided into 100 sec bins |
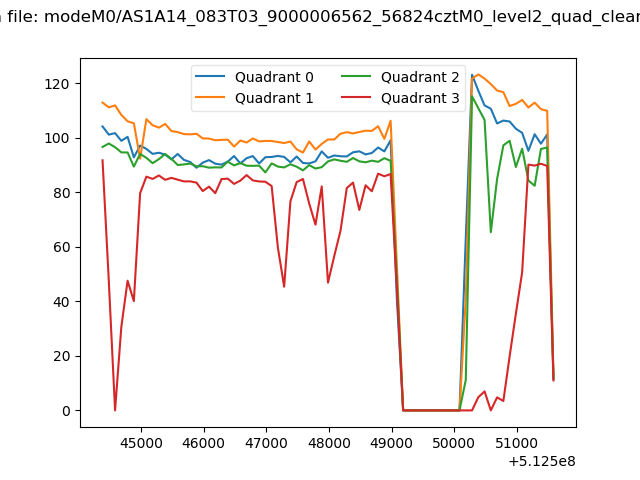 |
|
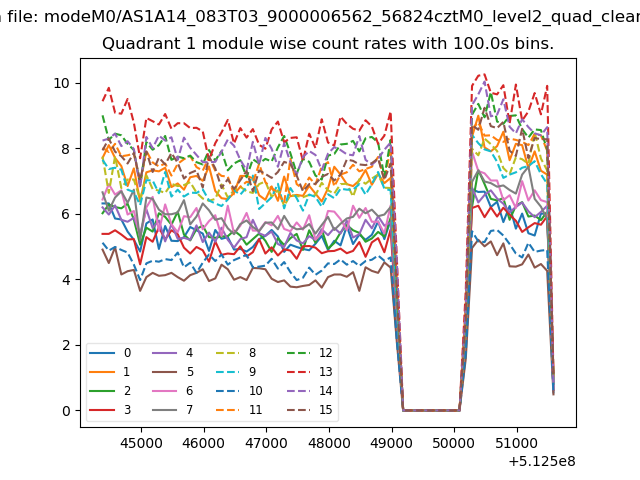
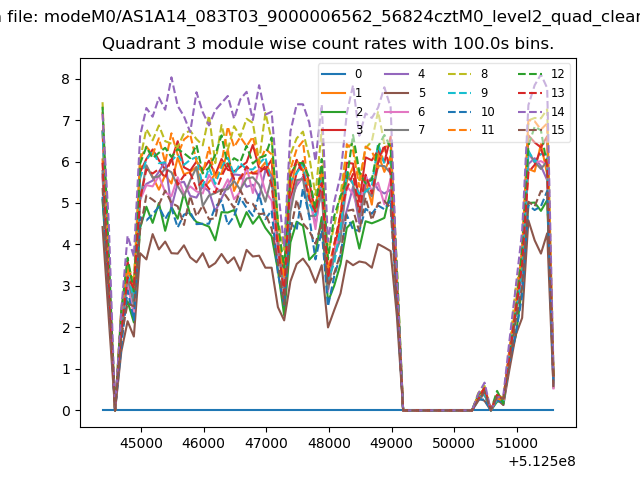
| Module-wise count rates for Quadrant A Data is divided into 100 sec bins |
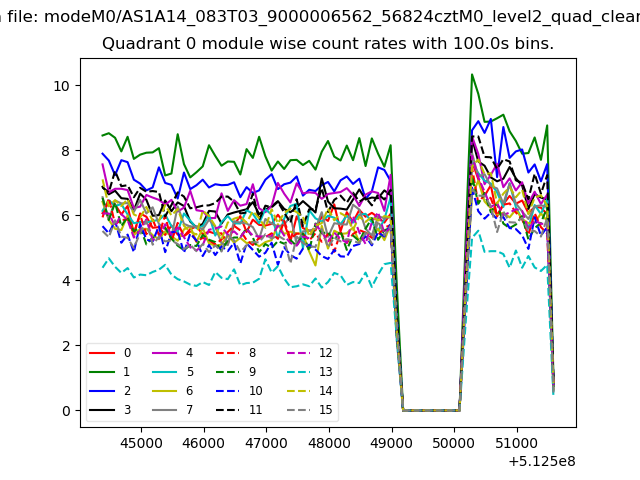 |
 |
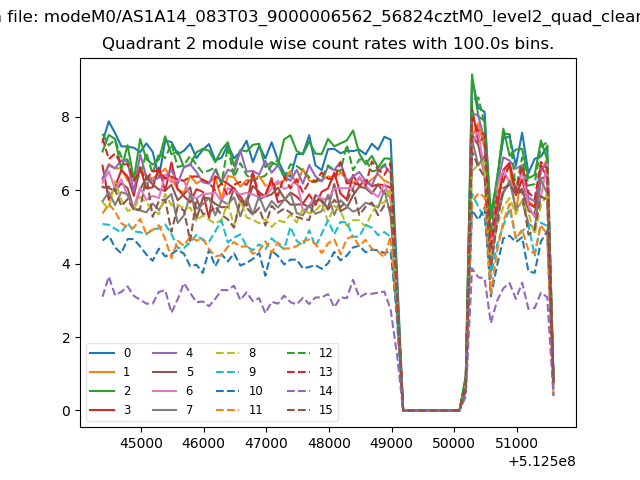
| Module-wise count rates for Quadrant B Data is divided into 100 sec bins |
 |
 |
| Module-wise count rates for Quadrant C Data is divided into 100 sec bins |
 |
 |
| Module-wise count rates for Quadrant D Data is divided into 100 sec bins |
 |
 |
| Parameter | Plot |
|---|---|
| CZT HV Monitor | 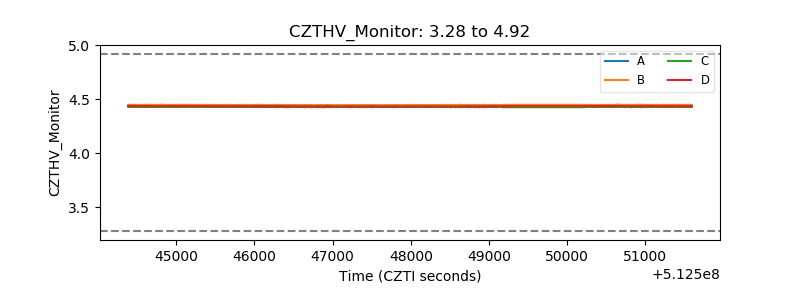 |
| D_VDD | 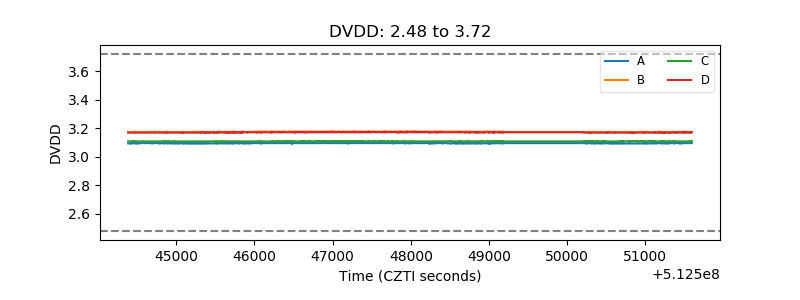 |
| Temperature 1 | 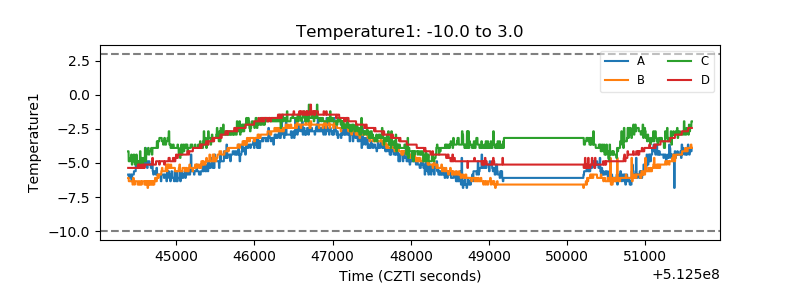 |
| Veto HV Monitor | 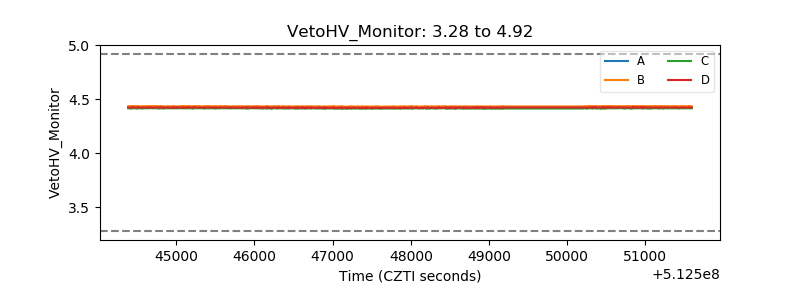 |
| Veto LLD | 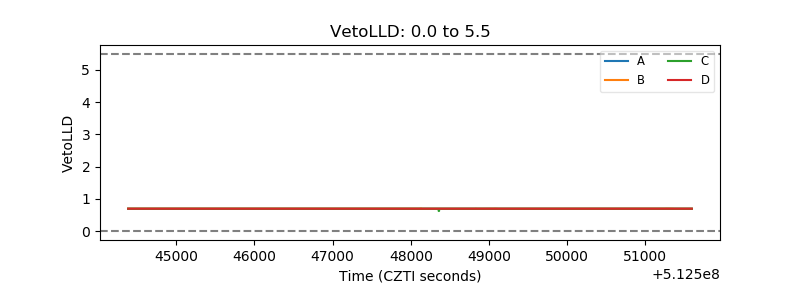 |
| Alpha Counter | 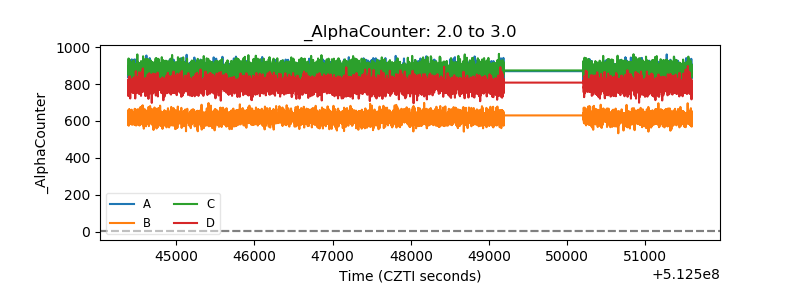 |
| _CPM_Rate | 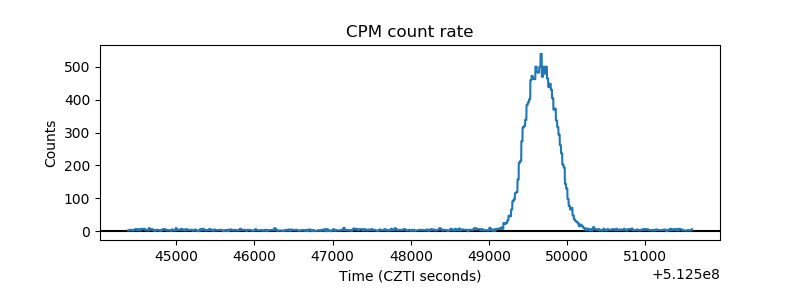 |
| CZT Counter | 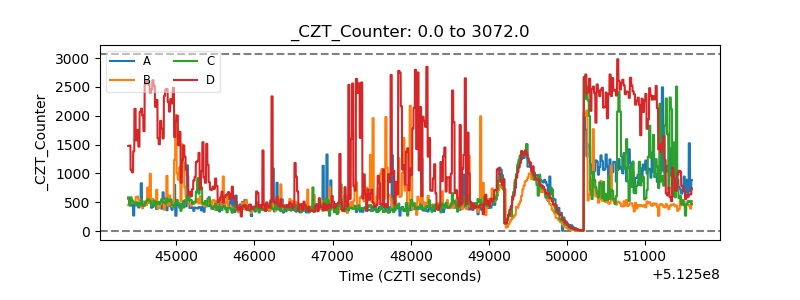 |
| +2.5 Volts monitor |  |
| +5 Volts monitor |  |
| _ROLL_ROT | 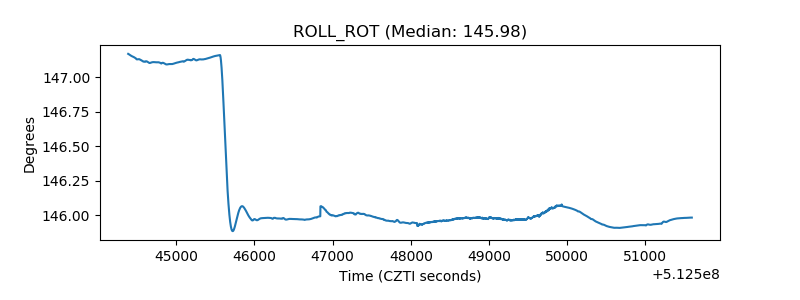 |
| _Roll_DEC | 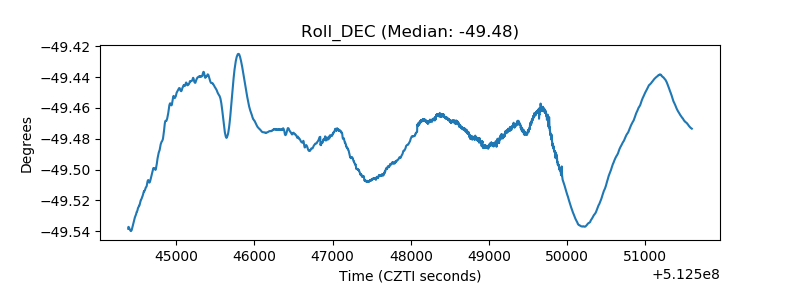 |
| _Roll_RA | 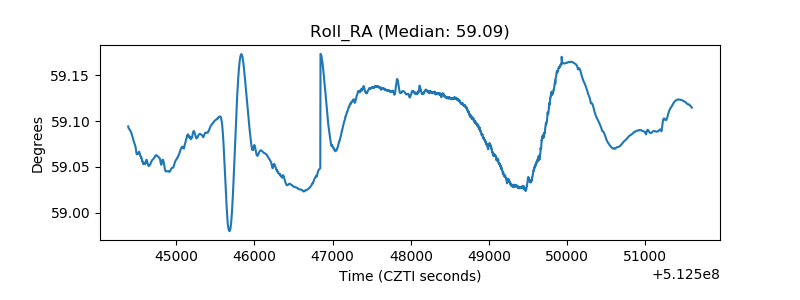 |
| Veto Counter | 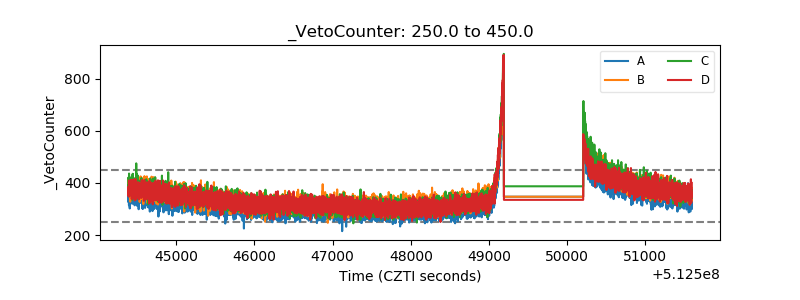 |