| Param | Original file | Final file |
|---|---|---|
| Filename | modeM0/AS1A14_083T03_9000006562_56825cztM0_level2.fits | modeM0/AS1A14_083T03_9000006562_56825cztM0_level2_quad_clean.evt |
| Size (bytes) | 524,214,720 | 93,173,760 |
| Size | 499.9 MB | 88.9 MB |
| Events in quadrant A | 6,172,520 | 621,102 |
| Events in quadrant B | 3,402,494 | 671,552 |
| Events in quadrant C | 3,907,391 | 593,099 |
| Events in quadrant D | 5,432,245 | 494,852 |
| Mode M9 | |||
|---|---|---|---|
| Quadrant | BADHDUFLAG | Total packets | Discarded packets |
| A | 0 | 11 | 0 |
| B | 0 | 11 | 0 |
| C | 0 | 11 | 0 |
| D | 0 | 11 | 0 |
| Mode SS | |||
|---|---|---|---|
| Quadrant | BADHDUFLAG | Total packets | Discarded packets |
| A | 0 | 128 | 0 |
| B | 0 | 128 | 0 |
| C | 0 | 128 | 0 |
| D | 0 | 128 | 0 |
| Mode M0 | |||
|---|---|---|---|
| Quadrant | BADHDUFLAG | Total packets | Discarded packets |
| A | 0 | 22881 | 1 |
| B | 0 | 14434 | 1 |
| C | 0 | 15887 | 1 |
| D | 0 | 20433 | 1 |
| Quadrant | Total seconds | Saturated seconds | Saturation percentage |
|---|---|---|---|
| A | 6318 | 187 | 2.959797% |
| B | 6318 | 176 | 2.785692% |
| C | 6318 | 206 | 3.260525% |
| D | 6319 | 927 | 14.670043% |
Noise dominated data is calculated using 1-second bins in cleaned event files. If a bin has >2000 counts, and if more than 50% of those come from <1% of pixels, then it is considered to be noise-dominated and hence unusable.
| Quadrant | # 1 sec bins | Bins with >0 counts | Bins with >2000 counts | High rate bins dominated by noise | Noise dominated (total time) | Noise dominated (detector-on time) | Marked lightcurve |
|---|---|---|---|---|---|---|---|
| A | 7388 | 6319 | 52 | 52 | 0.70% | 0.82% | 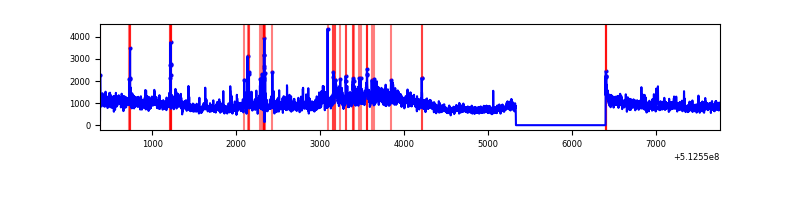 |
| B | 7388 | 6319 | 42 | 42 | 0.57% | 0.66% | 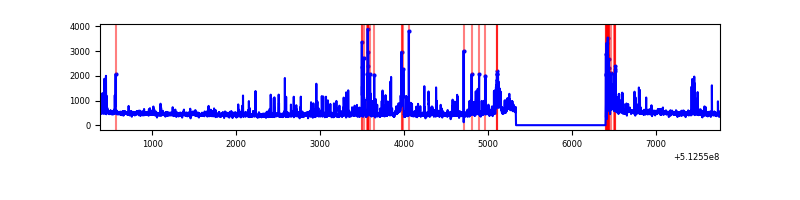 |
| C | 7388 | 6319 | 118 | 118 | 1.60% | 1.87% | 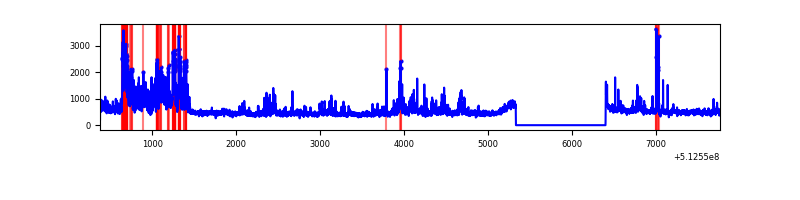 |
| D | 7389 | 6320 | 844 | 844 | 11.42% | 13.35% | 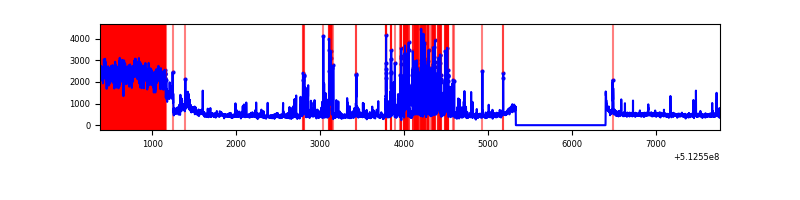 |
Top three noisy pixels from each quadrant. If the there are fewer than three noisy pixels in the level2.evt file, extra rows are filled as -1
| Pixel properties | Quadrant properties | ||||||
|---|---|---|---|---|---|---|---|
| Quadrant | DetID | PixID | Counts | Sigma | Mean | Median | Sigma |
| A | 3 | 14 | 3174614 | 18476.07 | 698 | 680 | 171.8 |
| A | 7 | 64 | 155640 | 902.05 | 698 | 680 | 171.8 |
| A | 10 | 251 | 134049 | 776.37 | 698 | 680 | 171.8 |
| B | 10 | 16 | 116845 | 787.75 | 687 | 662 | 147.5 |
| B | 0 | 152 | 94145 | 633.84 | 687 | 662 | 147.5 |
| B | 5 | 248 | 80323 | 540.12 | 687 | 662 | 147.5 |
| C | 15 | 230 | 637937 | 3473.71 | 678 | 671 | 183.5 |
| C | 6 | 13 | 215794 | 1172.63 | 678 | 671 | 183.5 |
| C | 1 | 16 | 188114 | 1021.74 | 678 | 671 | 183.5 |
| D | 15 | 142 | 1780314 | 9654.03 | 654 | 624 | 184.3 |
| D | 2 | 249 | 762177 | 4131.09 | 654 | 624 | 184.3 |
| D | 2 | 31 | 95751 | 516.02 | 654 | 624 | 184.3 |
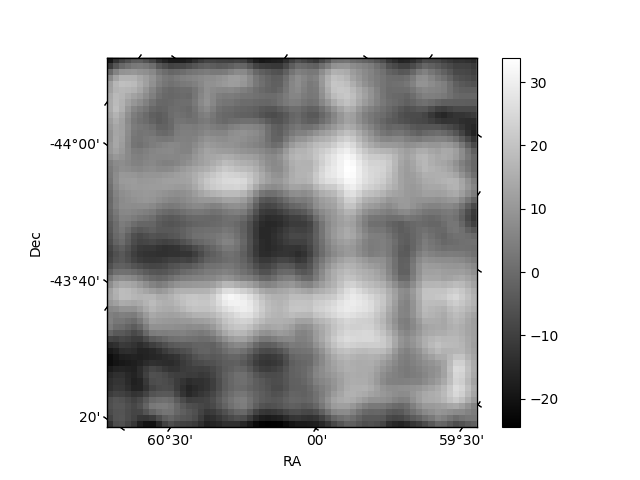
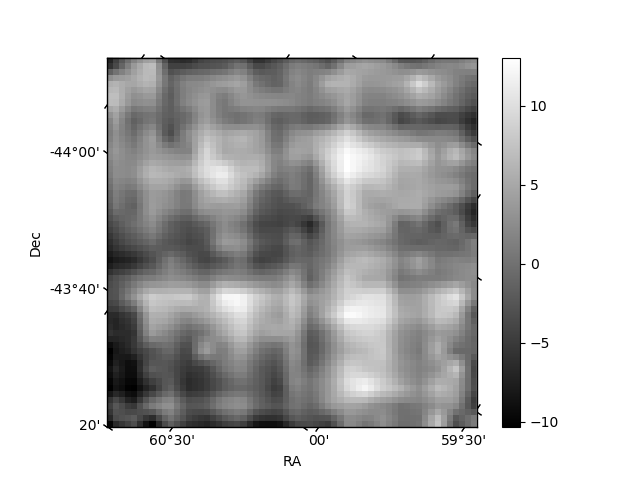
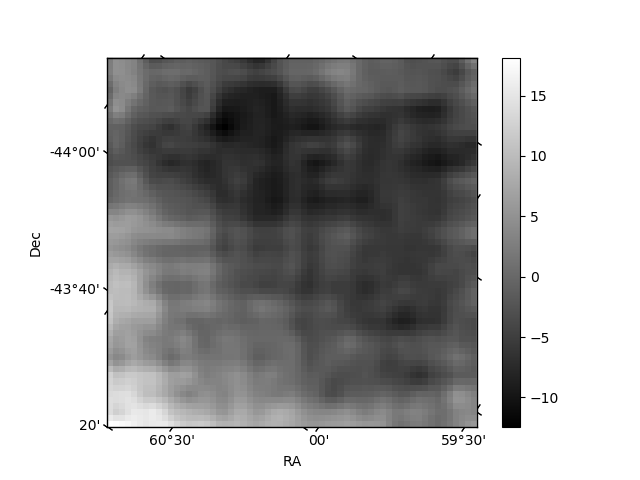
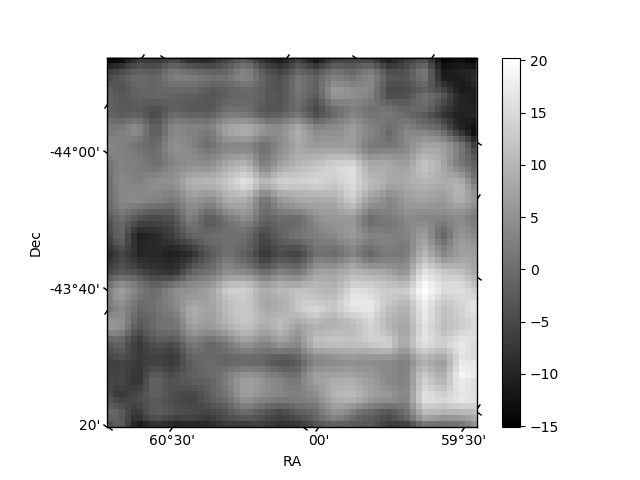
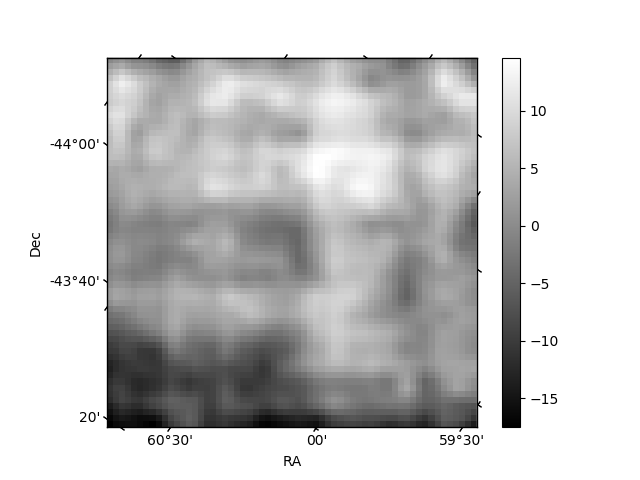
Histogram calculated using DETX and DETY for each event in the final _common_clean file
| Quadrant A | 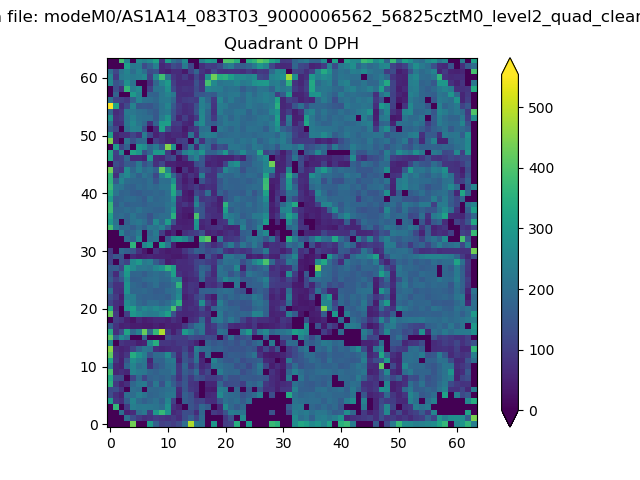 |
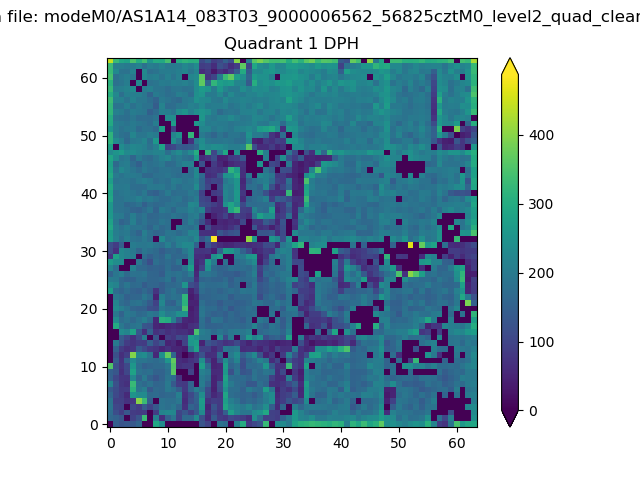 |
Quadrant B |
|---|---|---|---|
| Quadrant D | 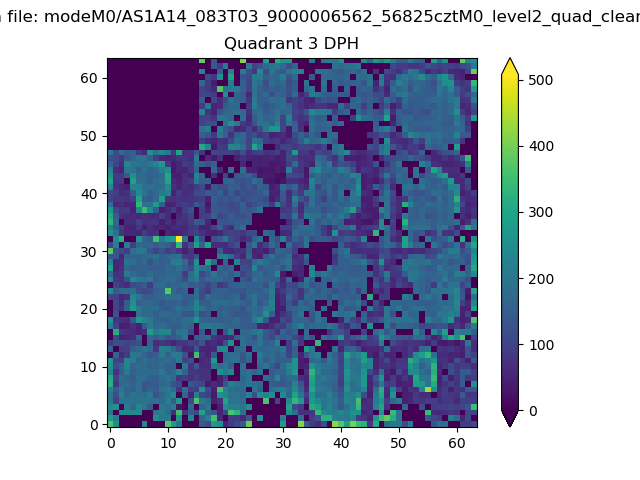 |
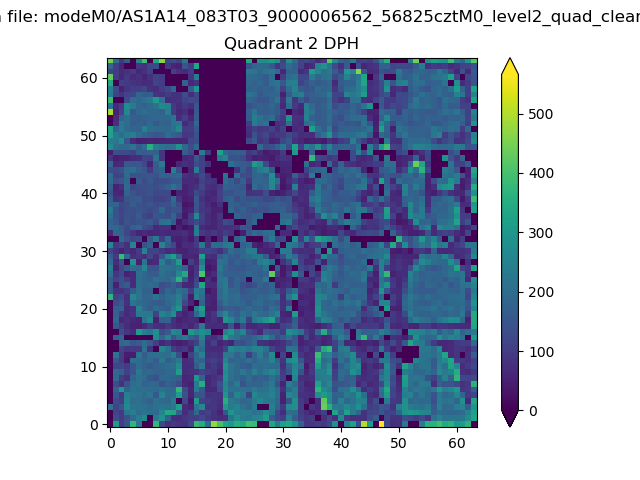 |
Quadrant C |
| Plot type | Count rate plots | Images |
|---|---|---|
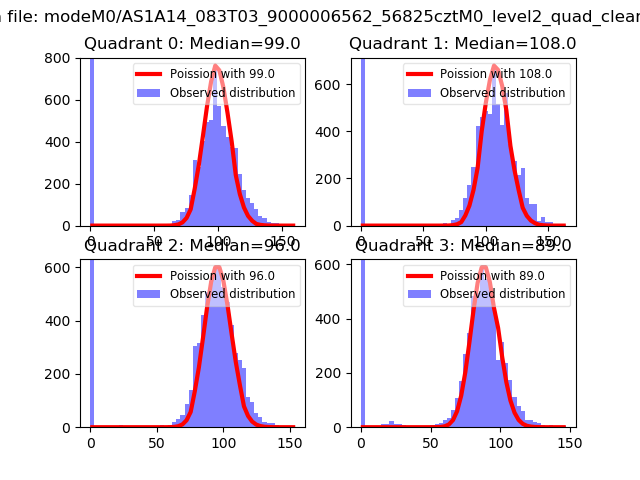
| Comparison with Poisson distribution Blue bars denote a histogram of data divided into 1 sec bins. Red curve is a Poisson curve with rate = median count rate of data. |
 |
 |
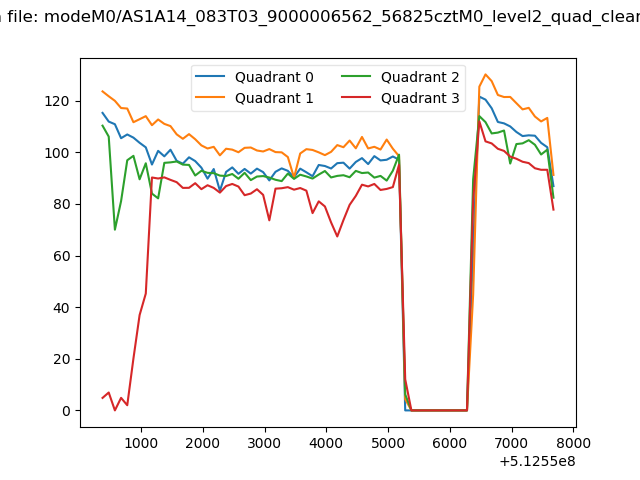
| Quadrant-wise count rates Data is divided into 100 sec bins |
 |
|
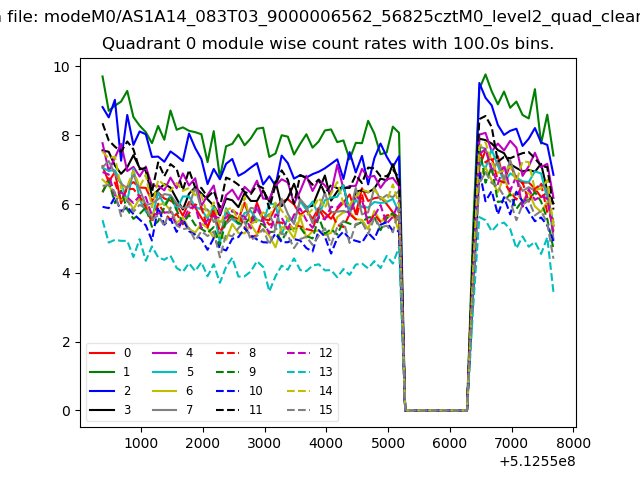
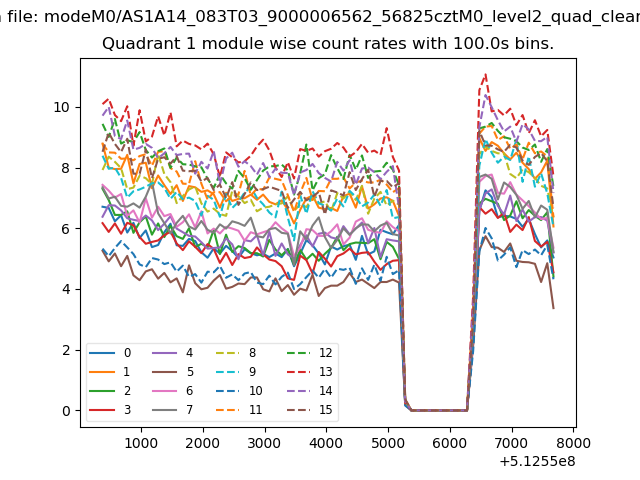
| Module-wise count rates for Quadrant A Data is divided into 100 sec bins |
 |
 |
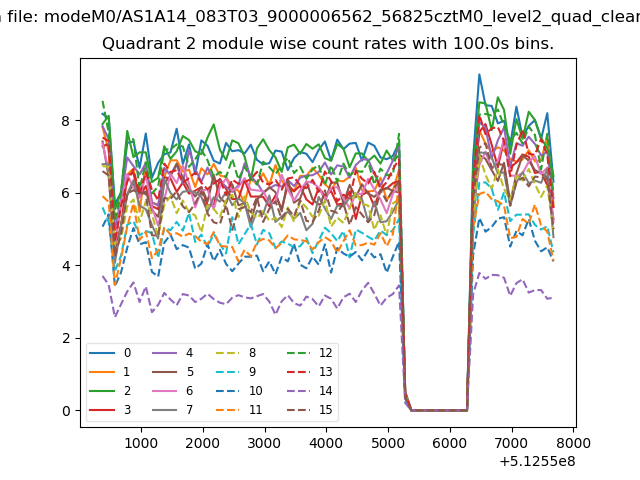
| Module-wise count rates for Quadrant B Data is divided into 100 sec bins |
 |
 |
| Module-wise count rates for Quadrant C Data is divided into 100 sec bins |
 |
 |
| Module-wise count rates for Quadrant D Data is divided into 100 sec bins |
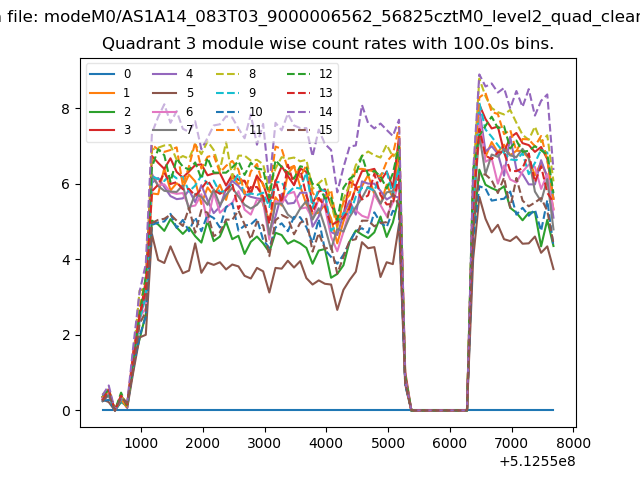 |
 |
| Parameter | Plot |
|---|---|
| CZT HV Monitor | 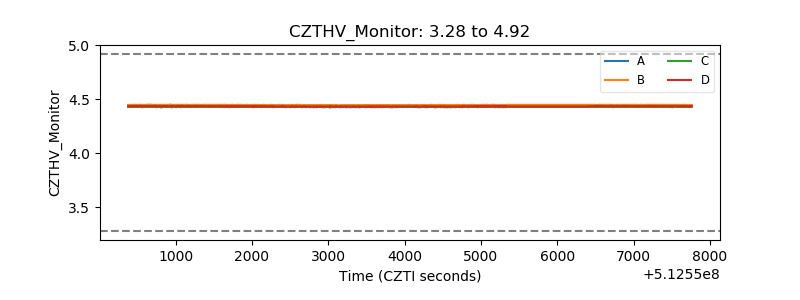 |
| D_VDD | 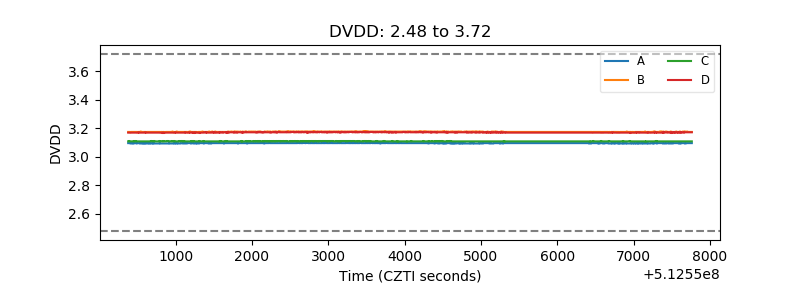 |
| Temperature 1 | 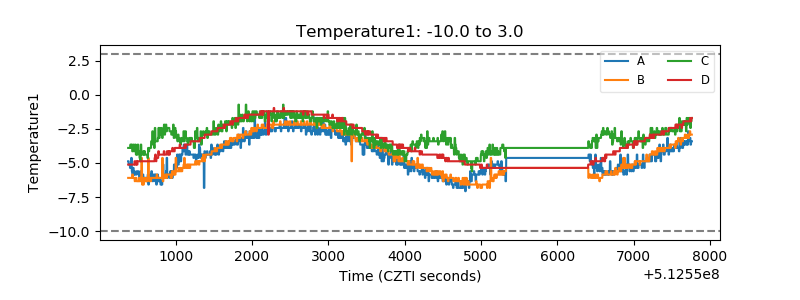 |
| Veto HV Monitor | 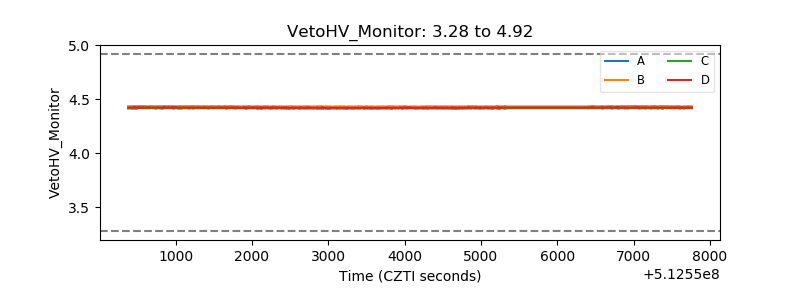 |
| Veto LLD | 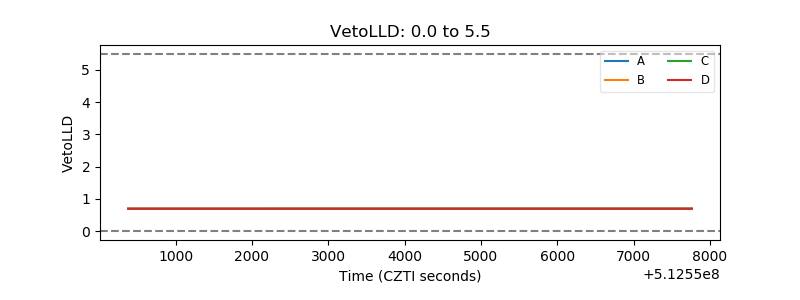 |
| Alpha Counter |  |
| _CPM_Rate | 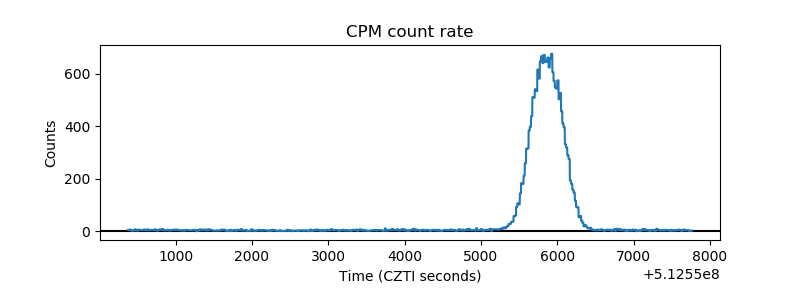 |
| CZT Counter | 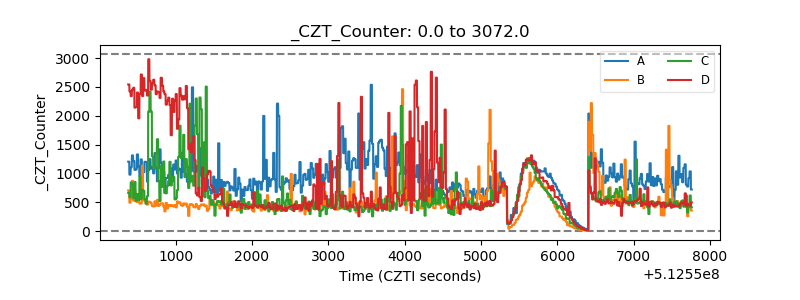 |
| +2.5 Volts monitor |  |
| +5 Volts monitor |  |
| _ROLL_ROT | 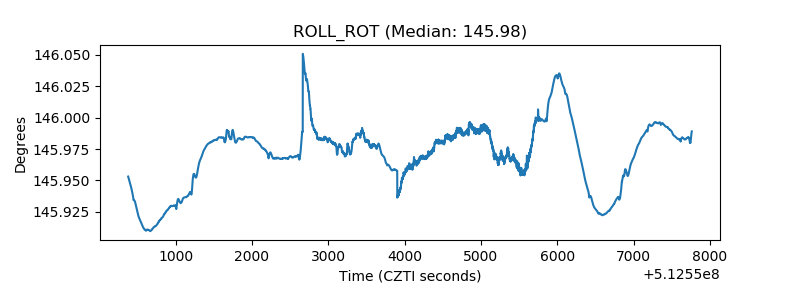 |
| _Roll_DEC | 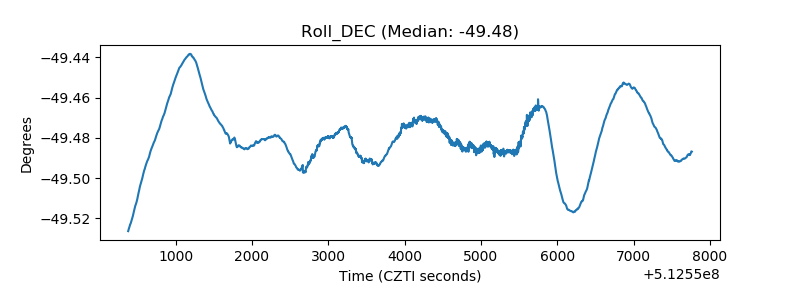 |
| _Roll_RA | 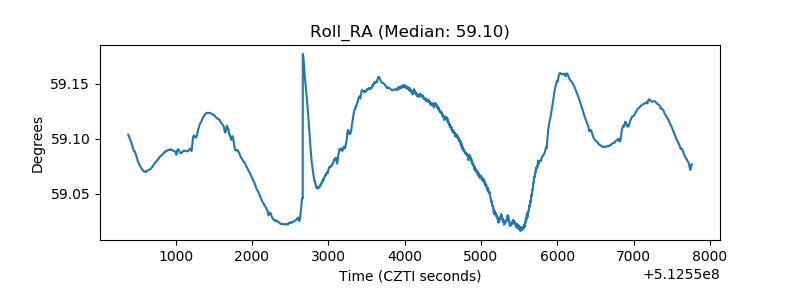 |
| Veto Counter | 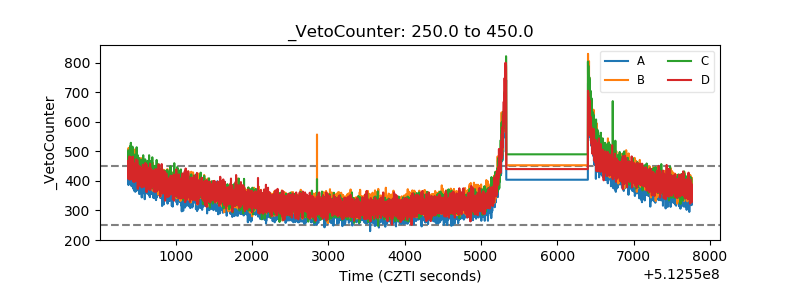 |