| Param | Original file | Final file |
|---|---|---|
| Filename | modeM0/AS1A14_083T03_9000006562_56826cztM0_level2.fits | modeM0/AS1A14_083T03_9000006562_56826cztM0_level2_quad_clean.evt |
| Size (bytes) | 476,334,720 | 103,187,520 |
| Size | 454.3 MB | 98.4 MB |
| Events in quadrant A | 6,113,292 | 675,849 |
| Events in quadrant B | 3,552,570 | 725,035 |
| Events in quadrant C | 3,523,264 | 647,012 |
| Events in quadrant D | 3,922,459 | 609,074 |
| Mode M9 | |||
|---|---|---|---|
| Quadrant | BADHDUFLAG | Total packets | Discarded packets |
| A | 0 | 12 | 0 |
| B | 0 | 13 | 0 |
| C | 0 | 13 | 0 |
| D | 0 | 13 | 0 |
| Mode SS | |||
|---|---|---|---|
| Quadrant | BADHDUFLAG | Total packets | Discarded packets |
| A | 0 | 136 | 0 |
| B | 0 | 136 | 0 |
| C | 0 | 136 | 0 |
| D | 0 | 136 | 0 |
| Mode M0 | |||
|---|---|---|---|
| Quadrant | BADHDUFLAG | Total packets | Discarded packets |
| A | 0 | 22982 | 2 |
| B | 0 | 15205 | 2 |
| C | 0 | 15177 | 2 |
| D | 0 | 16203 | 2 |
| Quadrant | Total seconds | Saturated seconds | Saturation percentage |
|---|---|---|---|
| A | 6709 | 156 | 2.325235% |
| B | 6709 | 163 | 2.429572% |
| C | 6709 | 105 | 1.565062% |
| D | 6709 | 180 | 2.682963% |
Noise dominated data is calculated using 1-second bins in cleaned event files. If a bin has >2000 counts, and if more than 50% of those come from <1% of pixels, then it is considered to be noise-dominated and hence unusable.
| Quadrant | # 1 sec bins | Bins with >0 counts | Bins with >2000 counts | High rate bins dominated by noise | Noise dominated (total time) | Noise dominated (detector-on time) | Marked lightcurve |
|---|---|---|---|---|---|---|---|
| A | 7839 | 6710 | 32 | 32 | 0.41% | 0.48% | 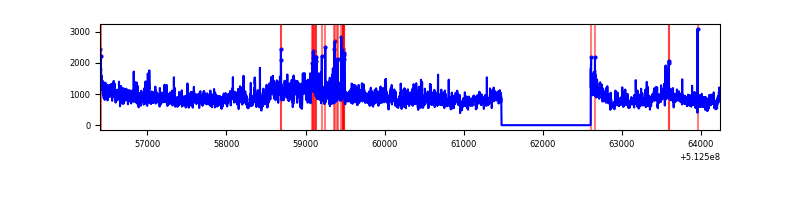 |
| B | 7839 | 6710 | 62 | 62 | 0.79% | 0.92% | 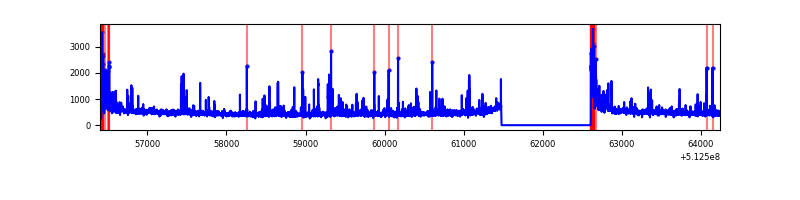 |
| C | 7839 | 6710 | 45 | 45 | 0.57% | 0.67% | 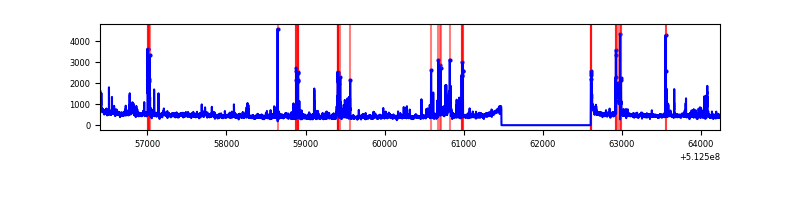 |
| D | 7839 | 6710 | 139 | 139 | 1.77% | 2.07% | 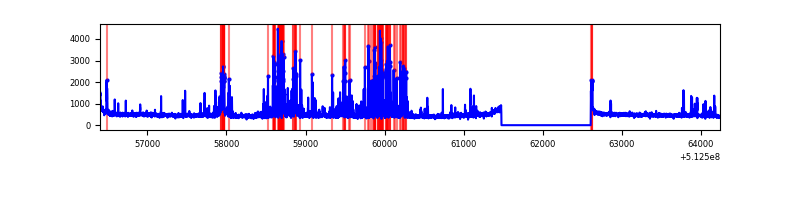 |
Top three noisy pixels from each quadrant. If the there are fewer than three noisy pixels in the level2.evt file, extra rows are filled as -1
| Pixel properties | Quadrant properties | ||||||
|---|---|---|---|---|---|---|---|
| Quadrant | DetID | PixID | Counts | Sigma | Mean | Median | Sigma |
| A | 3 | 14 | 3029743 | 16333.73 | 753 | 734 | 185.4 |
| A | 10 | 251 | 69539 | 371.03 | 753 | 734 | 185.4 |
| A | 7 | 64 | 59767 | 318.33 | 753 | 734 | 185.4 |
| B | 10 | 16 | 218150 | 1380.35 | 733 | 709 | 157.5 |
| B | 5 | 185 | 92424 | 582.22 | 733 | 709 | 157.5 |
| B | 4 | 206 | 74206 | 466.57 | 733 | 709 | 157.5 |
| C | 8 | 208 | 159618 | 792.76 | 729 | 720 | 200.4 |
| C | 9 | 38 | 128537 | 637.69 | 729 | 720 | 200.4 |
| C | 15 | 230 | 80865 | 399.85 | 729 | 720 | 200.4 |
| D | 2 | 249 | 613426 | 2994.34 | 731 | 699 | 204.6 |
| D | 2 | 120 | 104219 | 505.89 | 731 | 699 | 204.6 |
| D | 8 | 160 | 93362 | 452.83 | 731 | 699 | 204.6 |
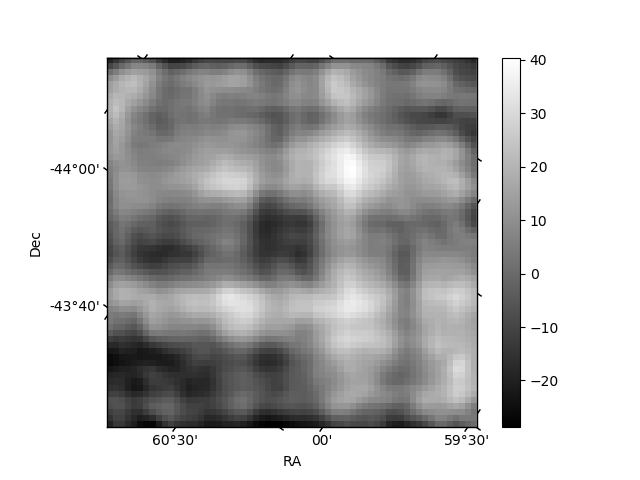
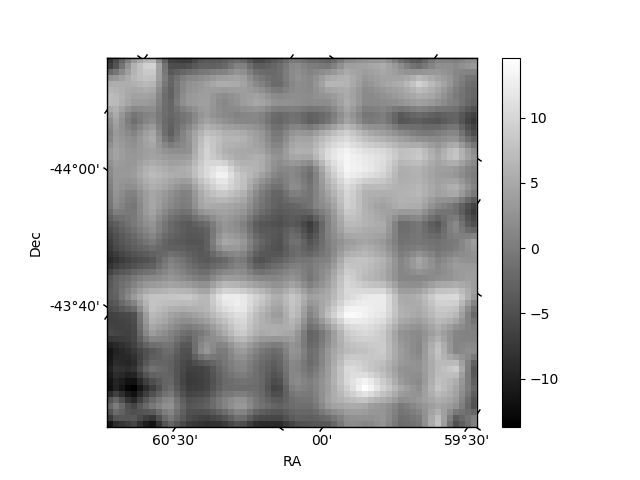
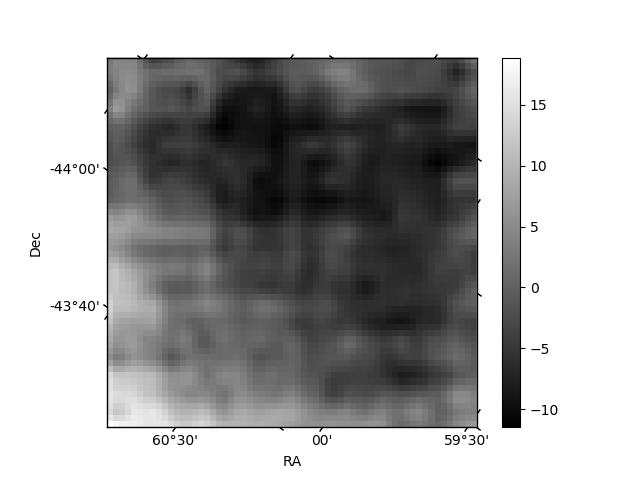
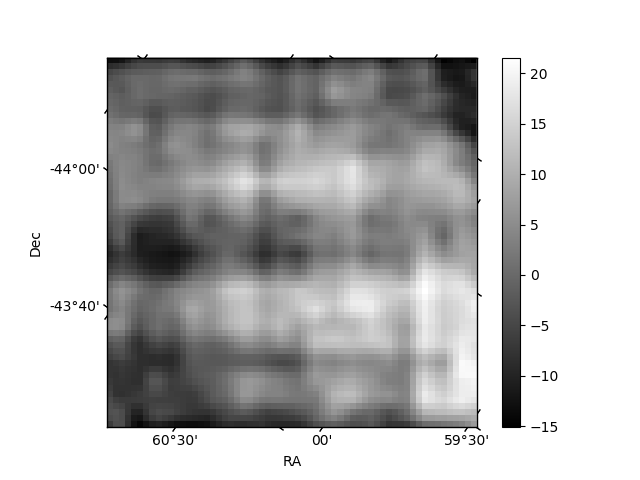
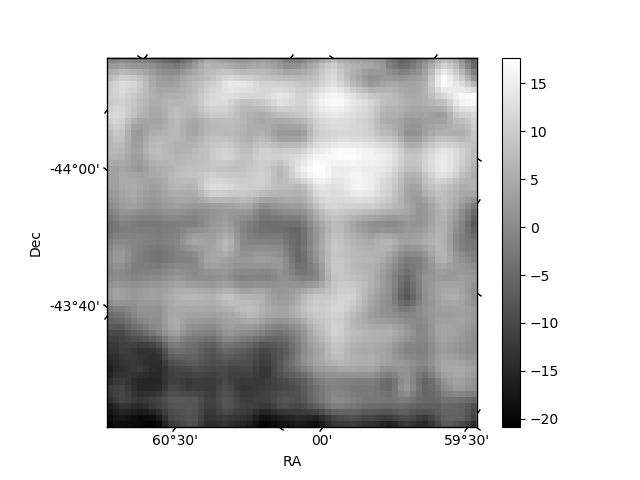
Histogram calculated using DETX and DETY for each event in the final _common_clean file
| Quadrant A | 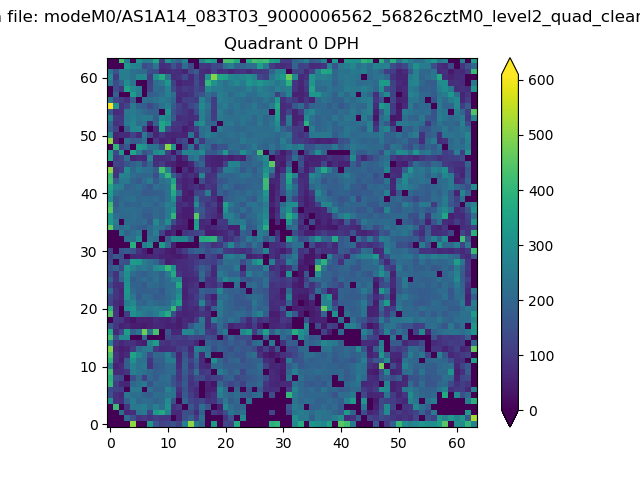 |
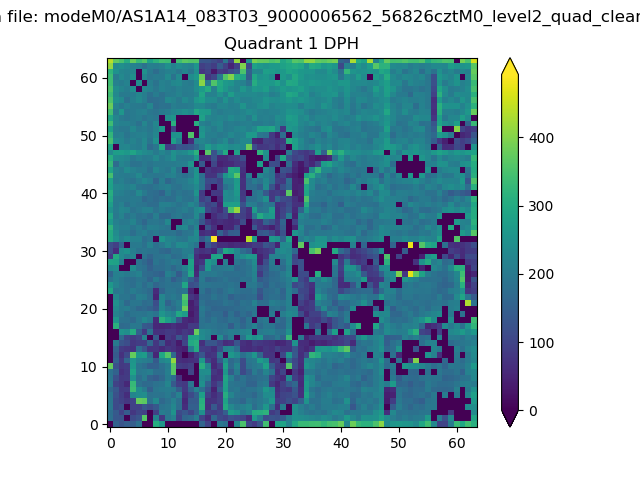 |
Quadrant B |
|---|---|---|---|
| Quadrant D | 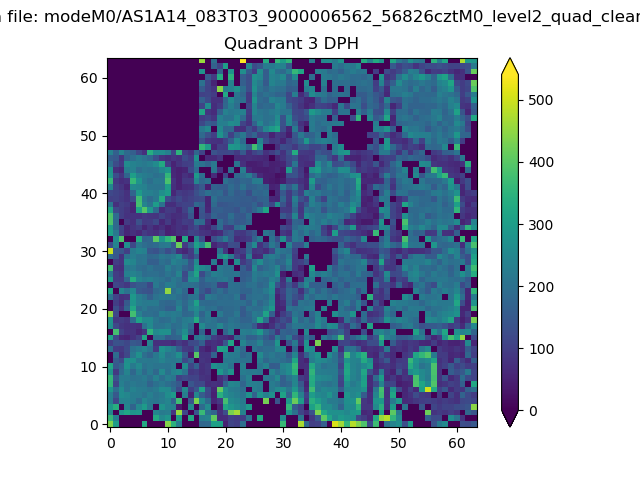 |
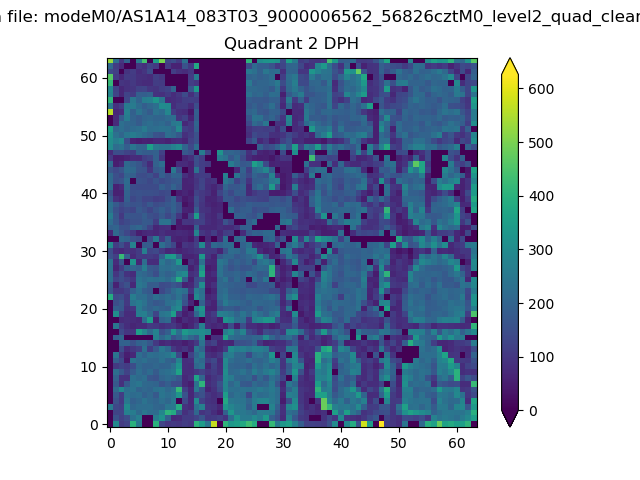 |
Quadrant C |
| Plot type | Count rate plots | Images |
|---|---|---|
| Comparison with Poisson distribution Blue bars denote a histogram of data divided into 1 sec bins. Red curve is a Poisson curve with rate = median count rate of data. |
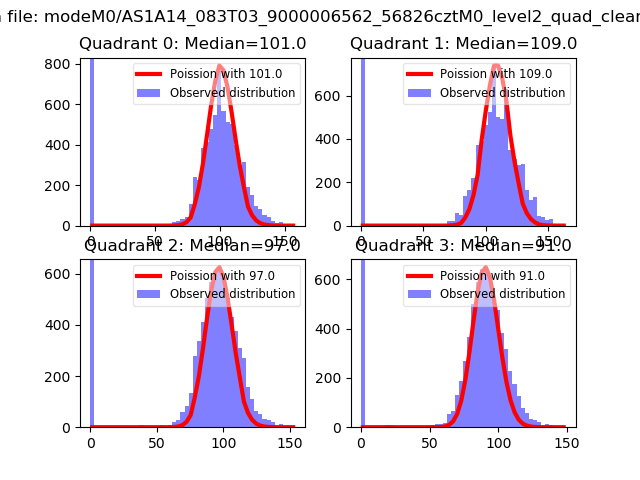 |
 |
| Quadrant-wise count rates Data is divided into 100 sec bins |
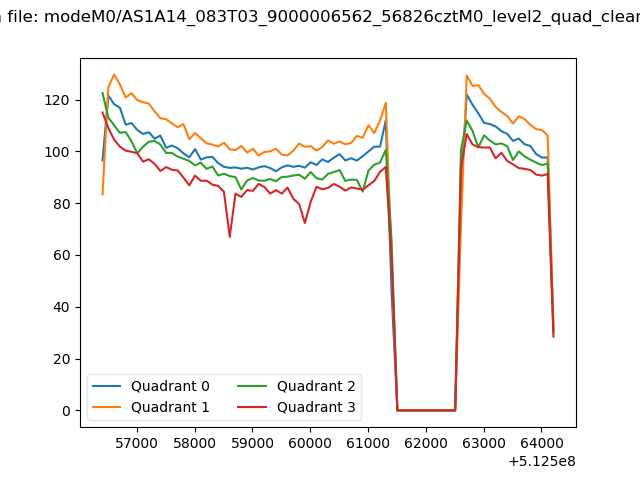 |
|
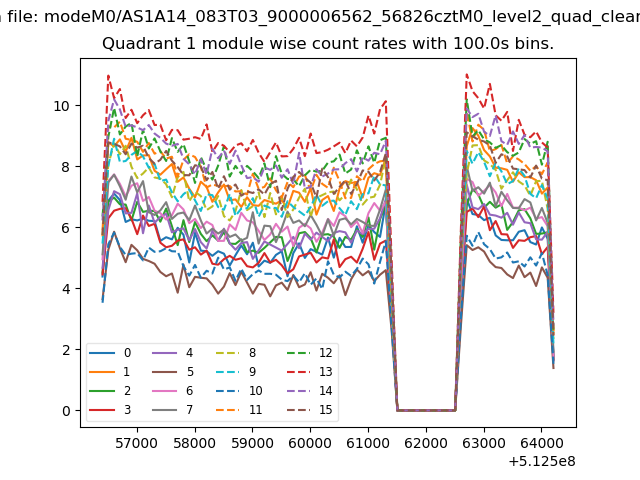
| Module-wise count rates for Quadrant A Data is divided into 100 sec bins |
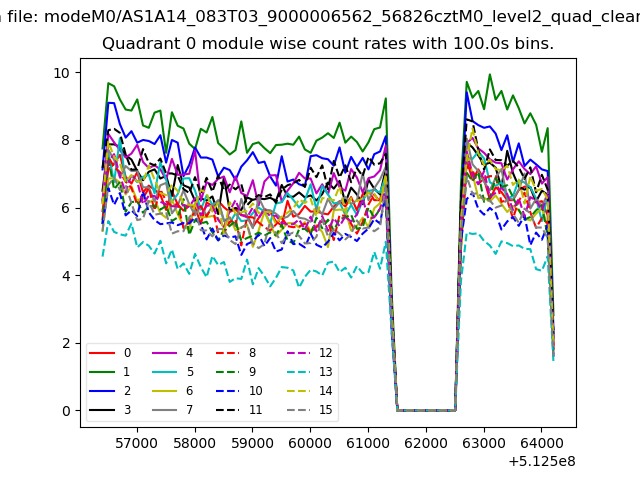 |
 |
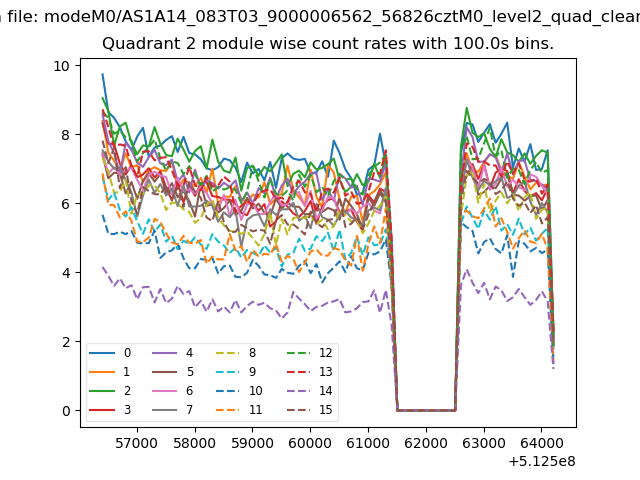
| Module-wise count rates for Quadrant B Data is divided into 100 sec bins |
 |
 |
| Module-wise count rates for Quadrant C Data is divided into 100 sec bins |
 |
 |
| Module-wise count rates for Quadrant D Data is divided into 100 sec bins |
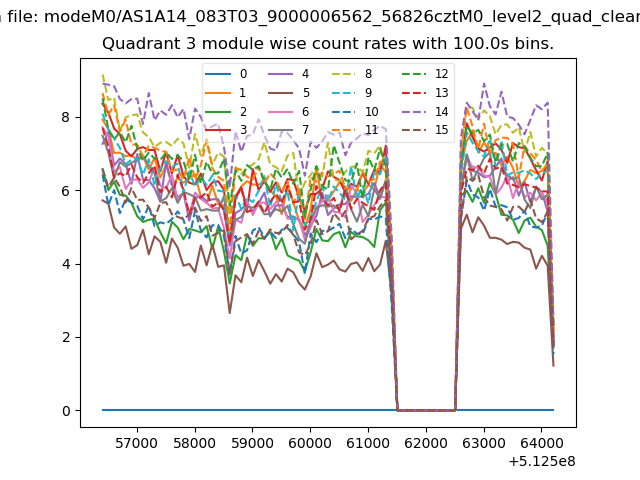 |
 |
| Parameter | Plot |
|---|---|
| CZT HV Monitor | 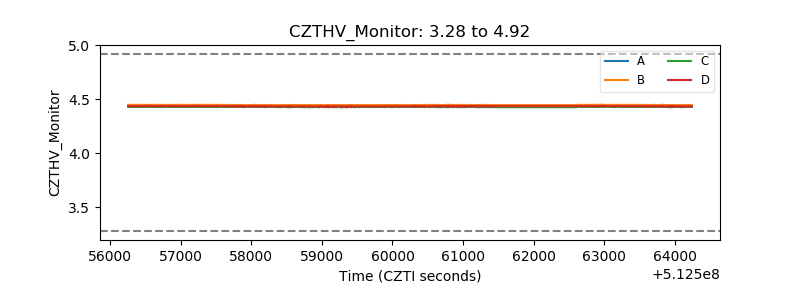 |
| D_VDD | 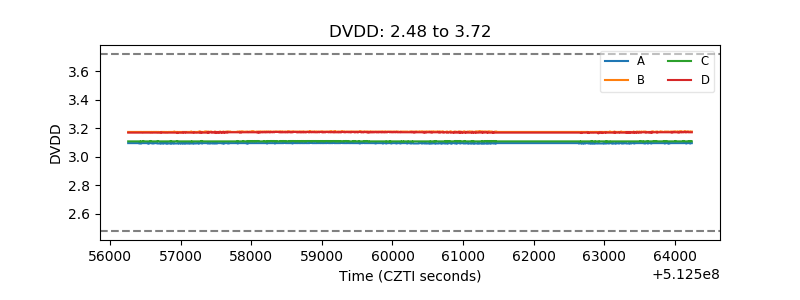 |
| Temperature 1 | 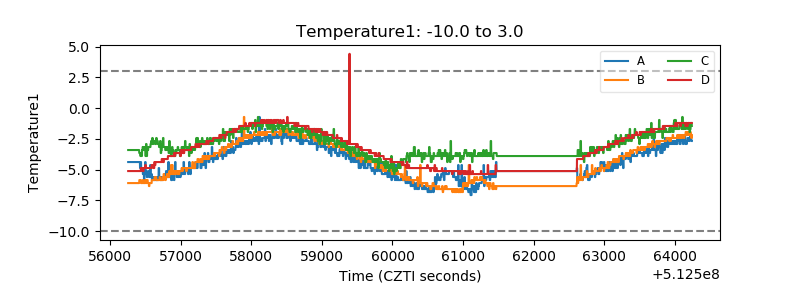 |
| Veto HV Monitor | 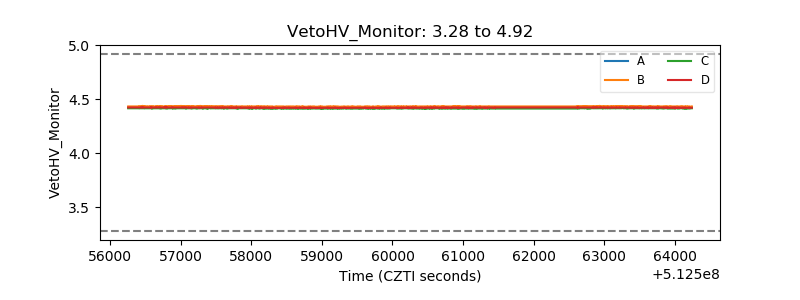 |
| Veto LLD | 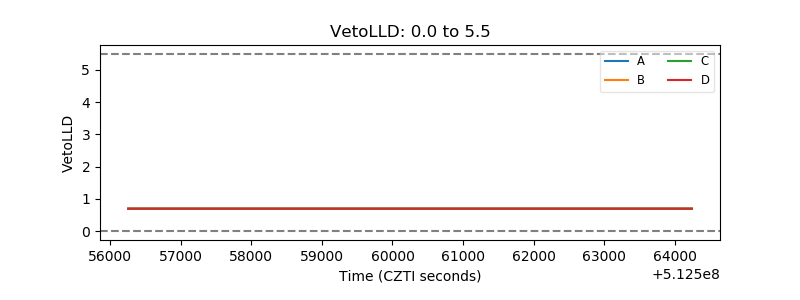 |
| Alpha Counter | 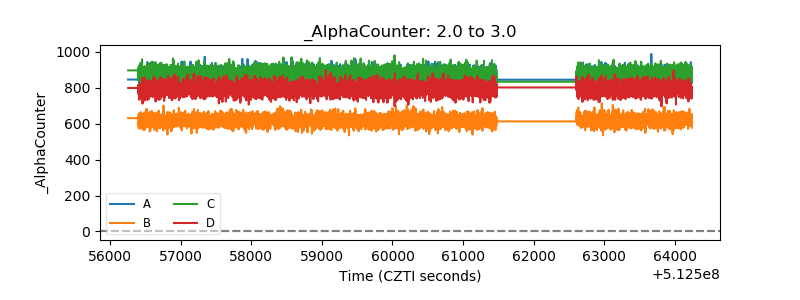 |
| _CPM_Rate | 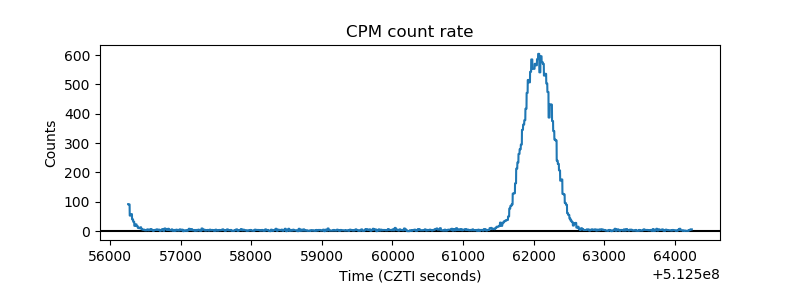 |
| CZT Counter | 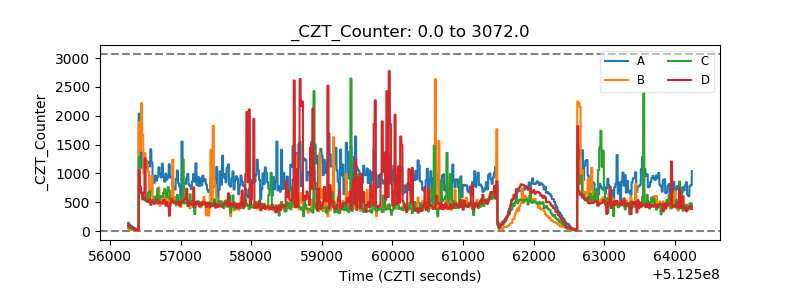 |
| +2.5 Volts monitor |  |
| +5 Volts monitor | 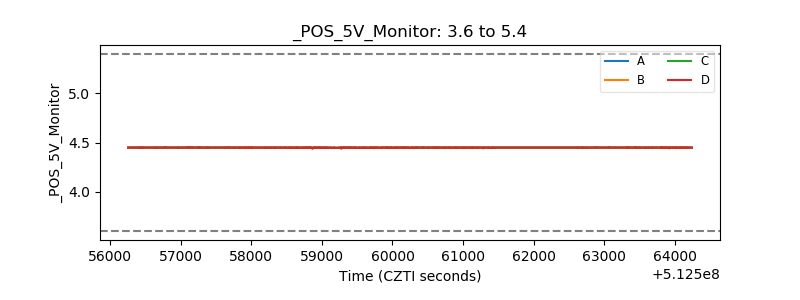 |
| _ROLL_ROT | 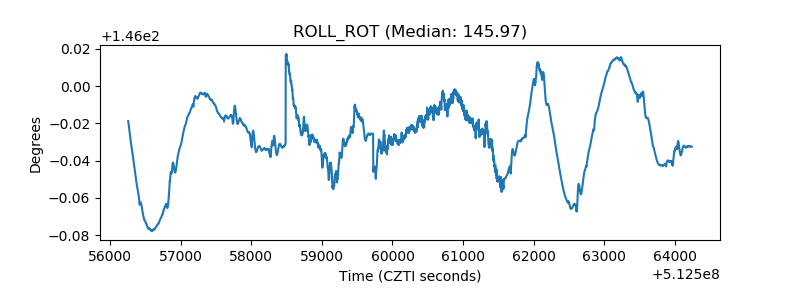 |
| _Roll_DEC | 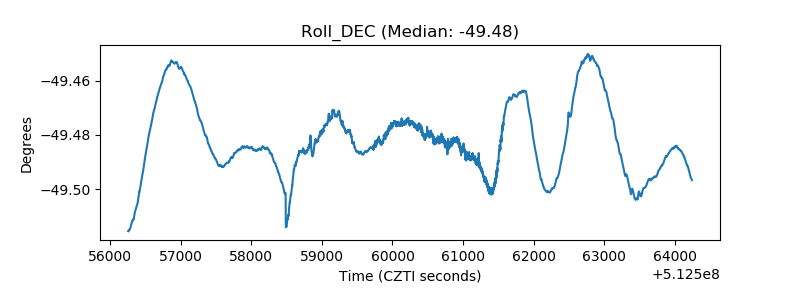 |
| _Roll_RA | 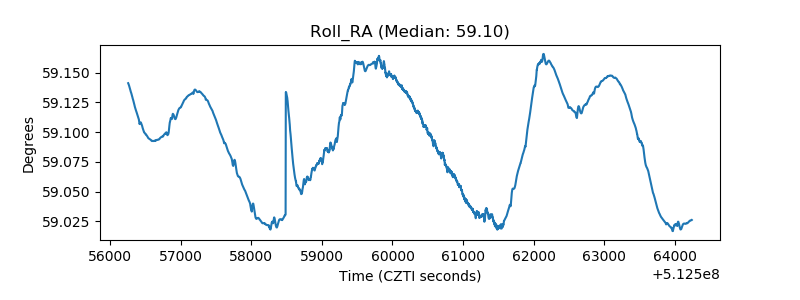 |
| Veto Counter | 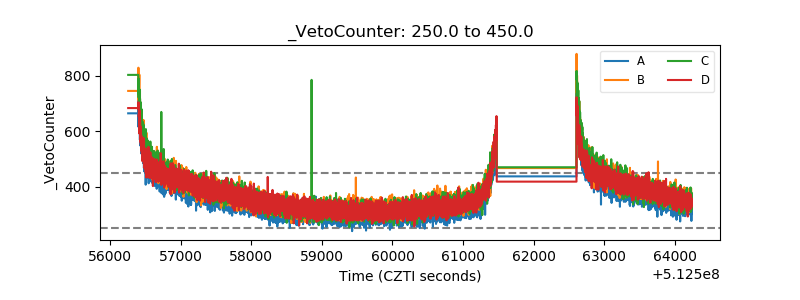 |