| Param | Original file | Final file |
|---|---|---|
| Filename | modeM0/AS1A14_083T03_9000006562_56829cztM0_level2.fits | modeM0/AS1A14_083T03_9000006562_56829cztM0_level2_quad_clean.evt |
| Size (bytes) | 489,467,520 | 95,742,720 |
| Size | 466.8 MB | 91.3 MB |
| Events in quadrant A | 5,504,729 | 625,497 |
| Events in quadrant B | 3,929,391 | 665,054 |
| Events in quadrant C | 4,665,471 | 581,963 |
| Events in quadrant D | 3,505,674 | 565,163 |
| Mode M9 | |||
|---|---|---|---|
| Quadrant | BADHDUFLAG | Total packets | Discarded packets |
| A | 0 | 8 | 0 |
| B | 0 | 8 | 0 |
| C | 0 | 8 | 0 |
| D | 0 | 8 | 0 |
| Mode SS | |||
|---|---|---|---|
| Quadrant | BADHDUFLAG | Total packets | Discarded packets |
| A | 0 | 134 | 0 |
| B | 0 | 134 | 0 |
| C | 0 | 134 | 0 |
| D | 0 | 134 | 0 |
| Mode M0 | |||
|---|---|---|---|
| Quadrant | BADHDUFLAG | Total packets | Discarded packets |
| A | 0 | 21110 | 1 |
| B | 0 | 16381 | 1 |
| C | 0 | 18676 | 1 |
| D | 0 | 15251 | 1 |
| Quadrant | Total seconds | Saturated seconds | Saturation percentage |
|---|---|---|---|
| A | 6617 | 113 | 1.707723% |
| B | 6617 | 163 | 2.463352% |
| C | 6617 | 300 | 4.533777% |
| D | 6617 | 99 | 1.496146% |
Noise dominated data is calculated using 1-second bins in cleaned event files. If a bin has >2000 counts, and if more than 50% of those come from <1% of pixels, then it is considered to be noise-dominated and hence unusable.
| Quadrant | # 1 sec bins | Bins with >0 counts | Bins with >2000 counts | High rate bins dominated by noise | Noise dominated (total time) | Noise dominated (detector-on time) | Marked lightcurve |
|---|---|---|---|---|---|---|---|
| A | 7392 | 6618 | 46 | 46 | 0.62% | 0.70% | 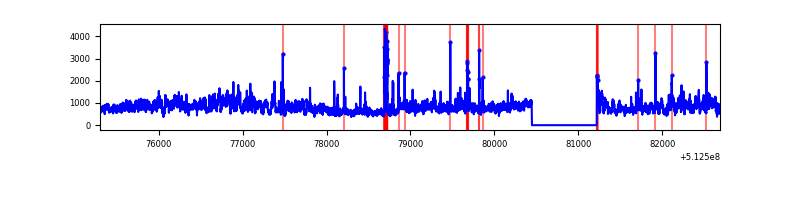 |
| B | 7392 | 6618 | 76 | 76 | 1.03% | 1.15% | 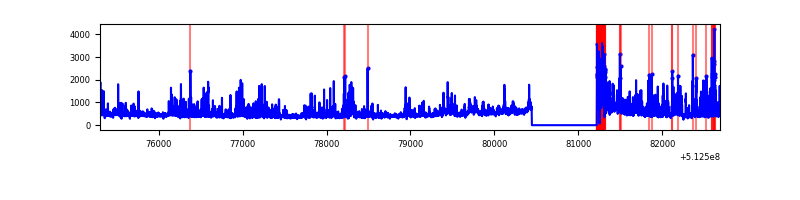 |
| C | 7392 | 6618 | 223 | 223 | 3.02% | 3.37% | 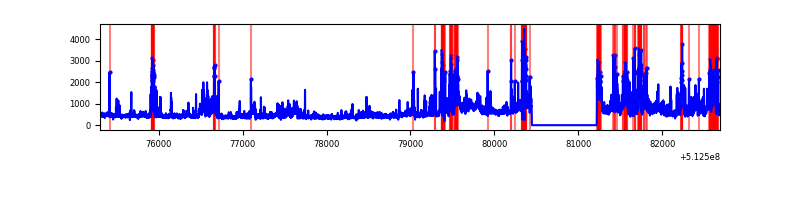 |
| D | 7392 | 6618 | 82 | 82 | 1.11% | 1.24% | 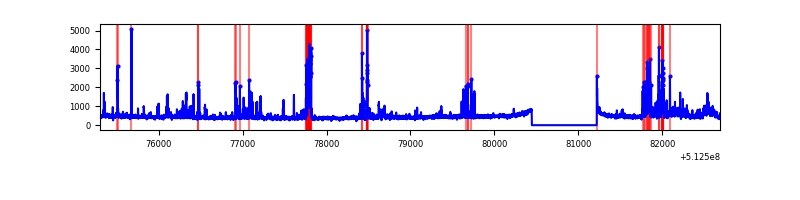 |
Top three noisy pixels from each quadrant. If the there are fewer than three noisy pixels in the level2.evt file, extra rows are filled as -1
| Pixel properties | Quadrant properties | ||||||
|---|---|---|---|---|---|---|---|
| Quadrant | DetID | PixID | Counts | Sigma | Mean | Median | Sigma |
| A | 3 | 14 | 2427960 | 14039.61 | 699 | 681 | 172.9 |
| A | 10 | 251 | 205956 | 1187.33 | 699 | 681 | 172.9 |
| A | 4 | 13 | 58330 | 333.45 | 699 | 681 | 172.9 |
| B | 5 | 185 | 779911 | 5299.09 | 687 | 662 | 147.1 |
| B | 10 | 16 | 189133 | 1281.65 | 687 | 662 | 147.1 |
| B | 0 | 245 | 31510 | 209.77 | 687 | 662 | 147.1 |
| C | 9 | 38 | 953223 | 5234.14 | 665 | 657 | 182.0 |
| C | 13 | 3 | 352714 | 1934.47 | 665 | 657 | 182.0 |
| C | 15 | 230 | 171302 | 937.65 | 665 | 657 | 182.0 |
| D | 2 | 249 | 364183 | 1908.66 | 674 | 642 | 190.5 |
| D | 2 | 31 | 212175 | 1110.59 | 674 | 642 | 190.5 |
| D | 6 | 239 | 113485 | 592.45 | 674 | 642 | 190.5 |
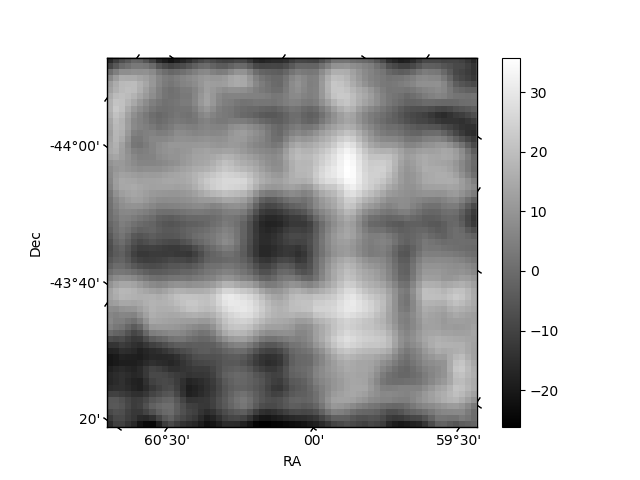
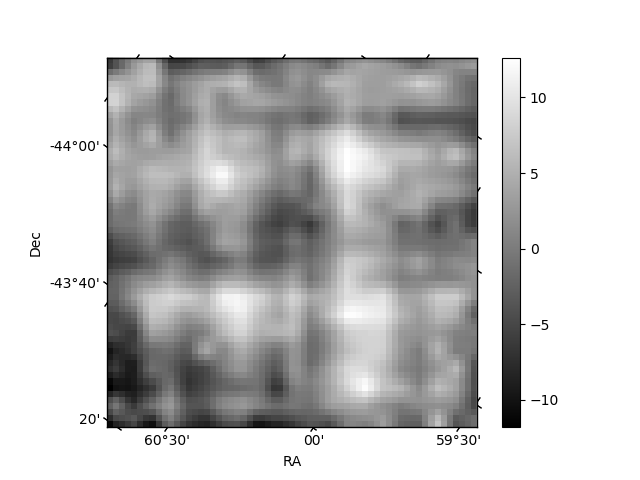
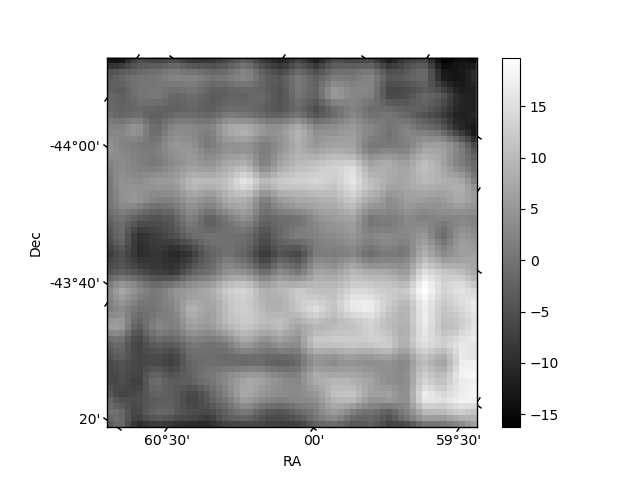
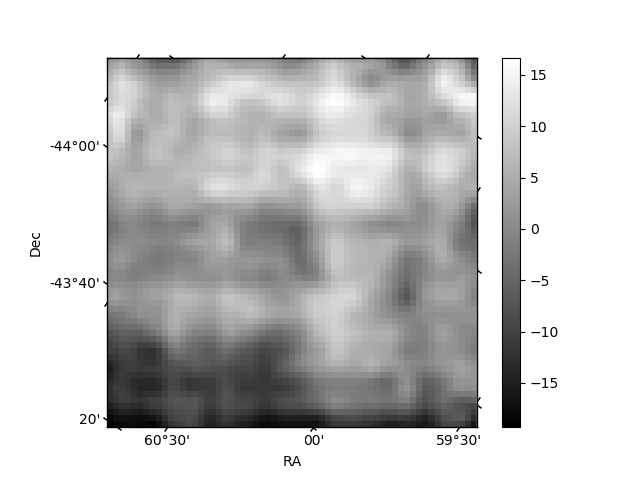
Histogram calculated using DETX and DETY for each event in the final _common_clean file
| Quadrant A | 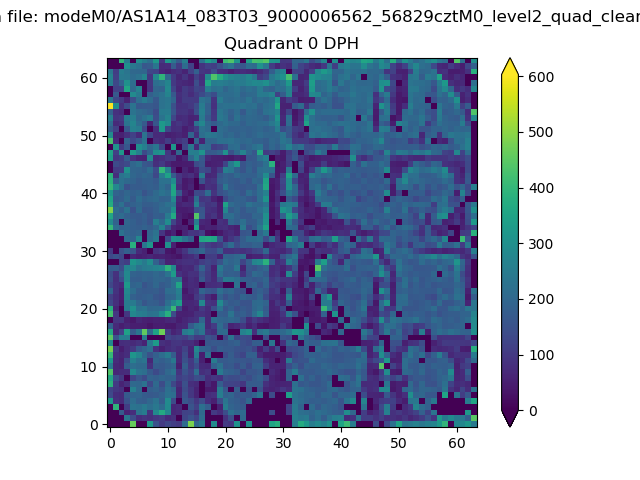 |
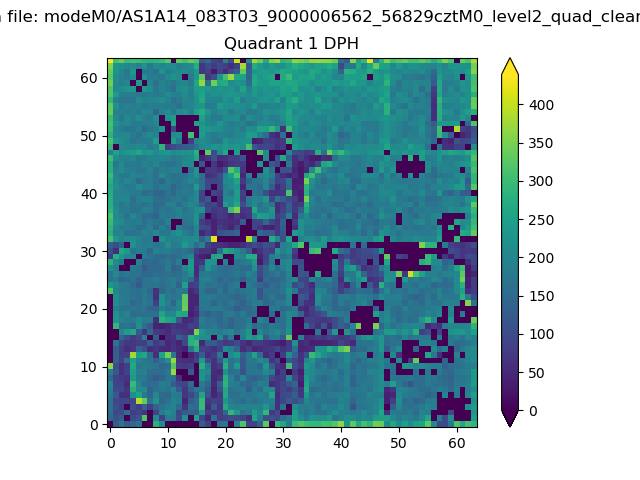 |
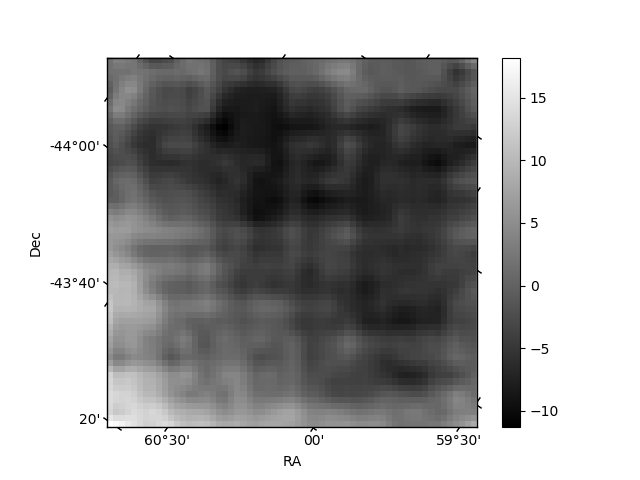
Quadrant B |
|---|---|---|---|
| Quadrant D | 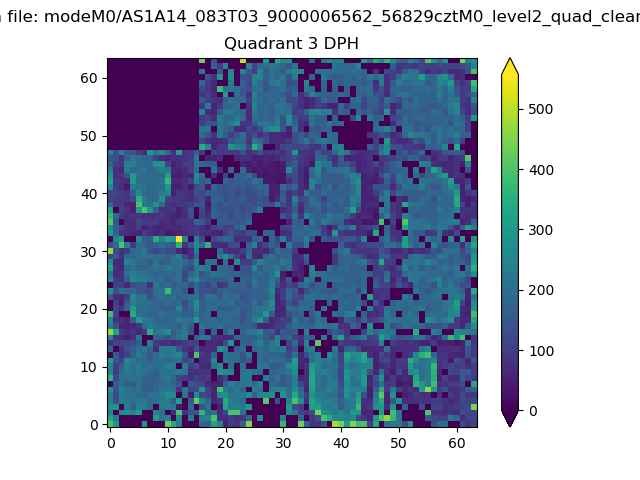 |
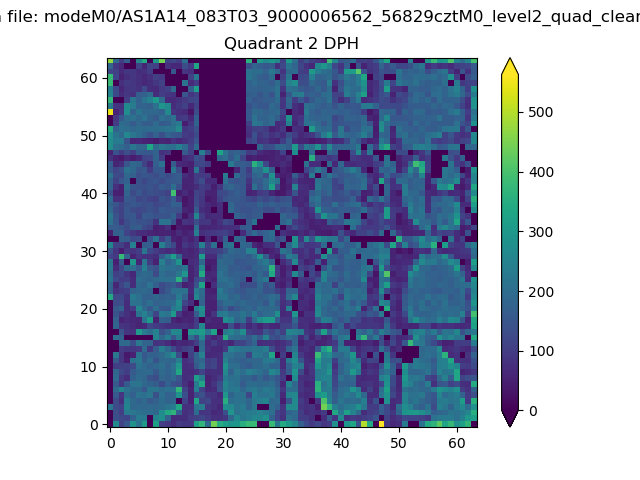 |
Quadrant C |
| Plot type | Count rate plots | Images |
|---|---|---|
| Comparison with Poisson distribution Blue bars denote a histogram of data divided into 1 sec bins. Red curve is a Poisson curve with rate = median count rate of data. |
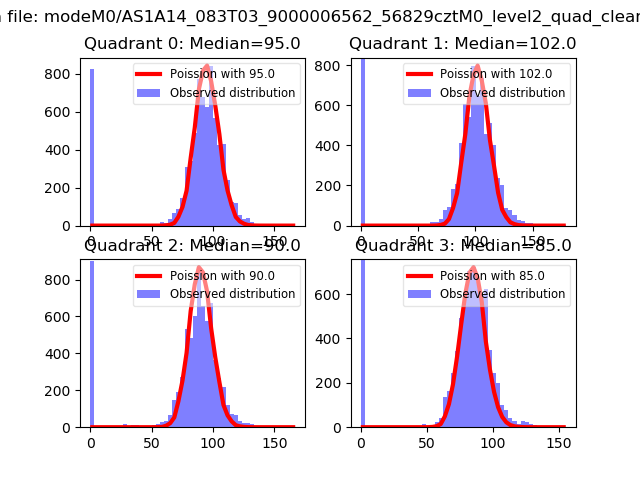 |
 |
| Quadrant-wise count rates Data is divided into 100 sec bins |
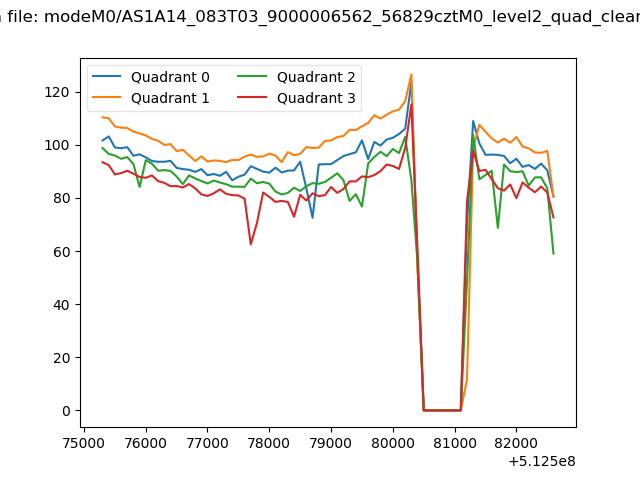 |
|
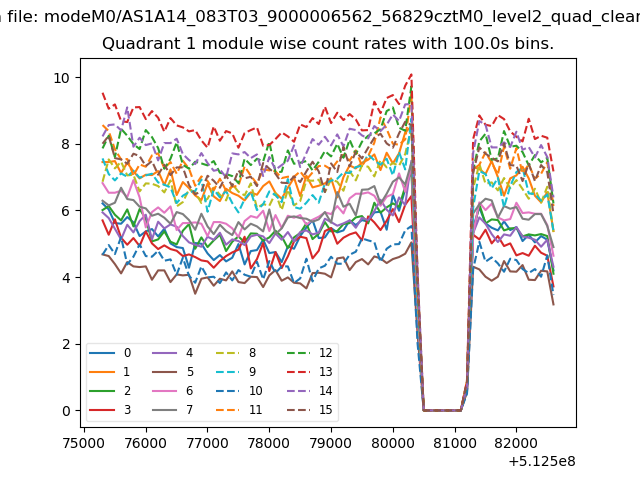
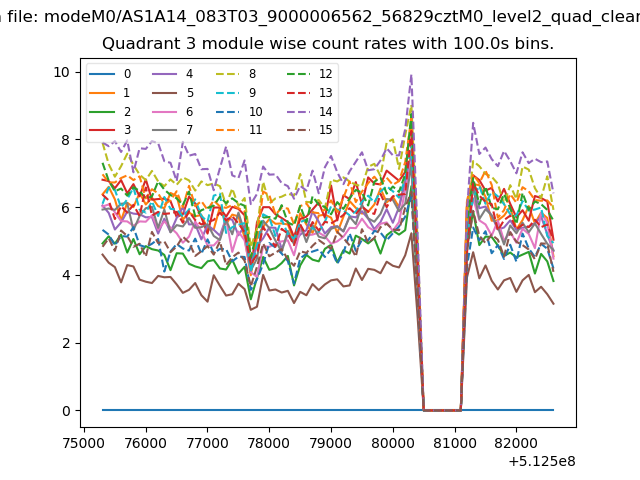
| Module-wise count rates for Quadrant A Data is divided into 100 sec bins |
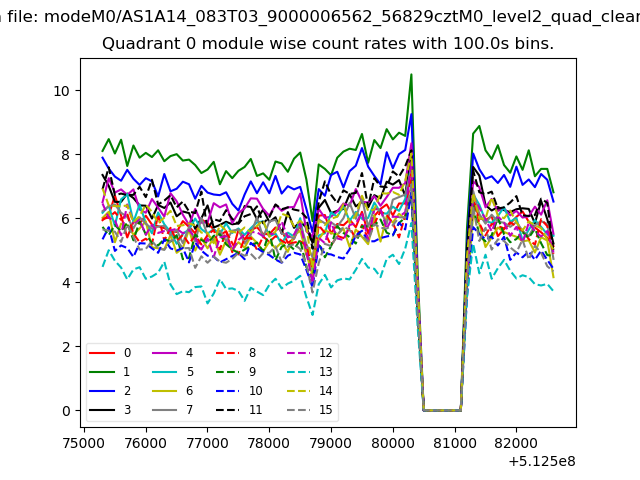 |
 |
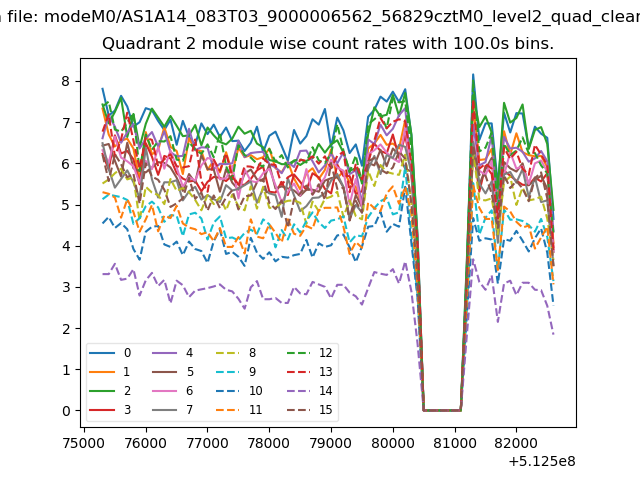
| Module-wise count rates for Quadrant B Data is divided into 100 sec bins |
 |
 |
| Module-wise count rates for Quadrant C Data is divided into 100 sec bins |
 |
 |
| Module-wise count rates for Quadrant D Data is divided into 100 sec bins |
 |
 |
| Parameter | Plot |
|---|---|
| CZT HV Monitor | 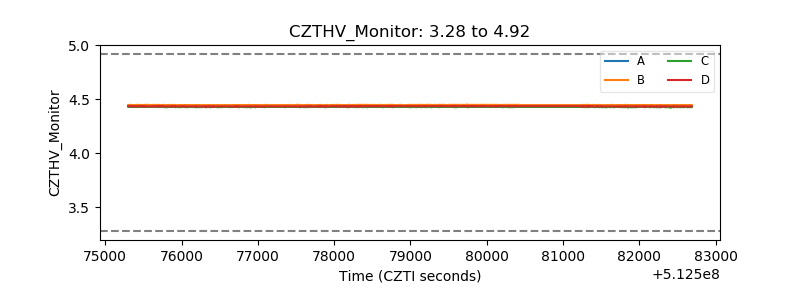 |
| D_VDD | 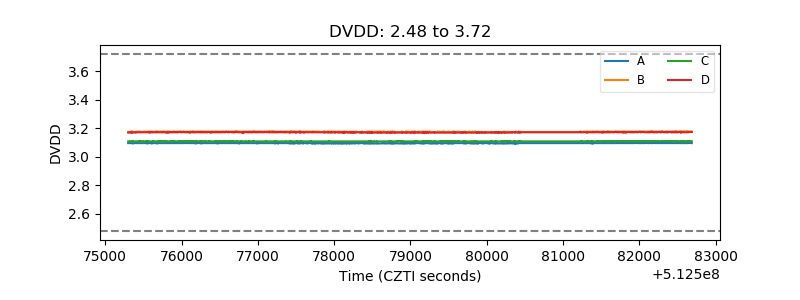 |
| Temperature 1 | 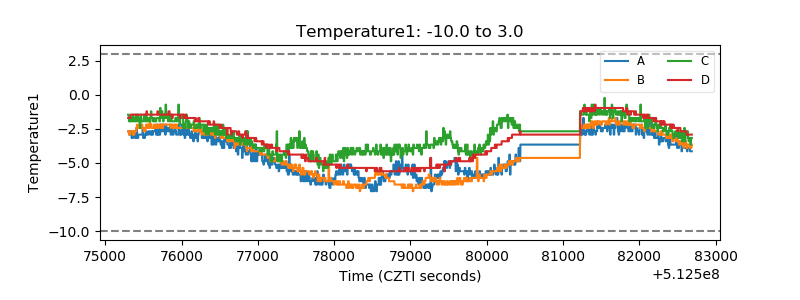 |
| Veto HV Monitor | 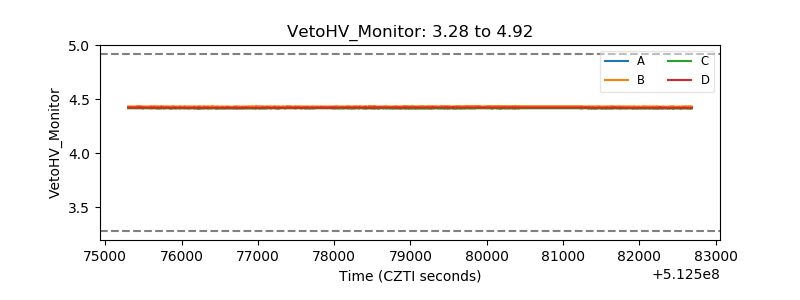 |
| Veto LLD | 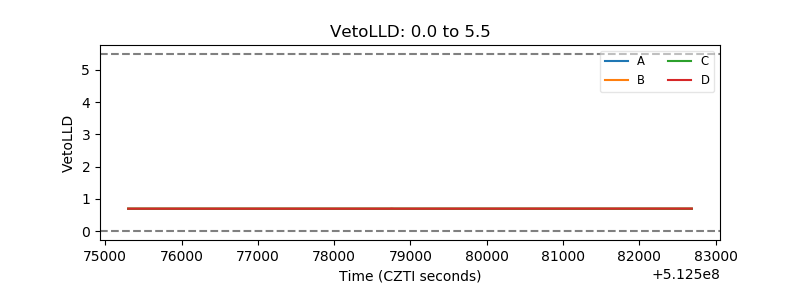 |
| Alpha Counter | 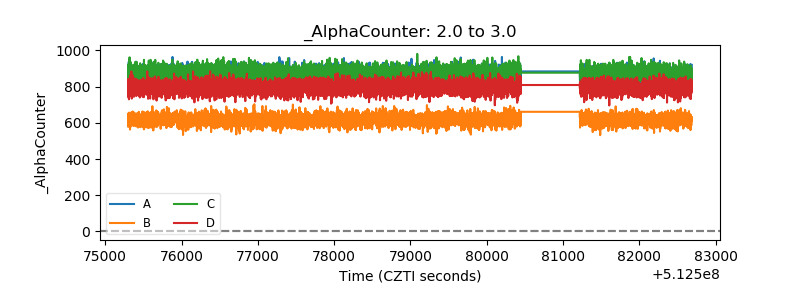 |
| _CPM_Rate | 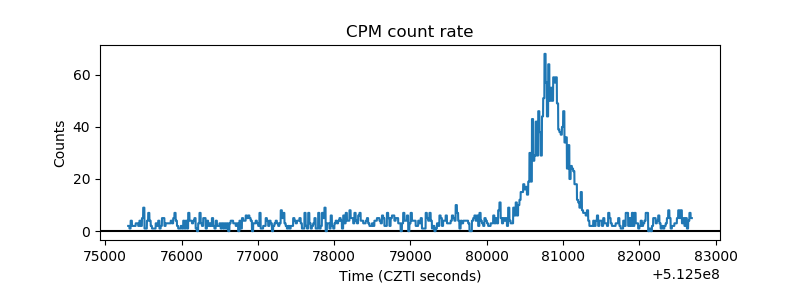 |
| CZT Counter | 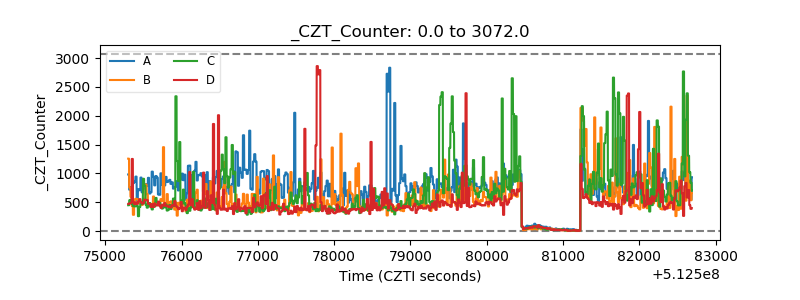 |
| +2.5 Volts monitor | 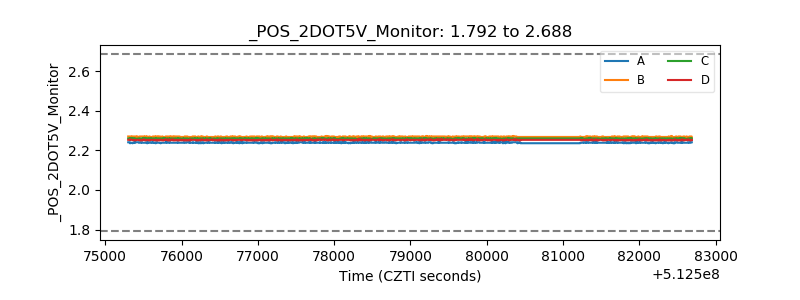 |
| +5 Volts monitor | 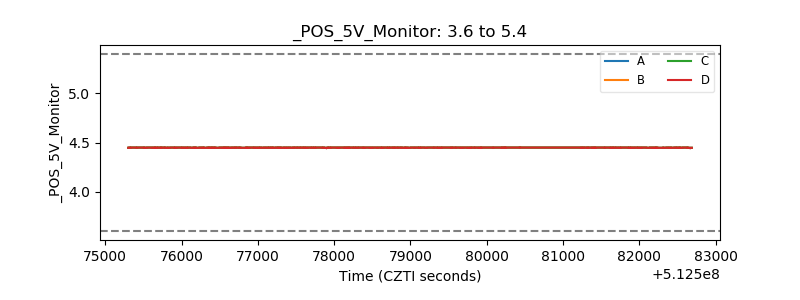 |
| _ROLL_ROT | 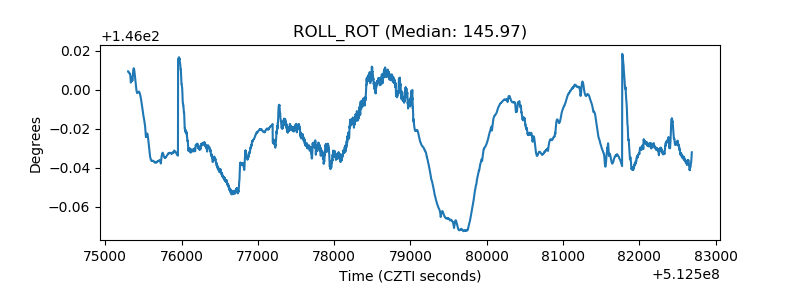 |
| _Roll_DEC | 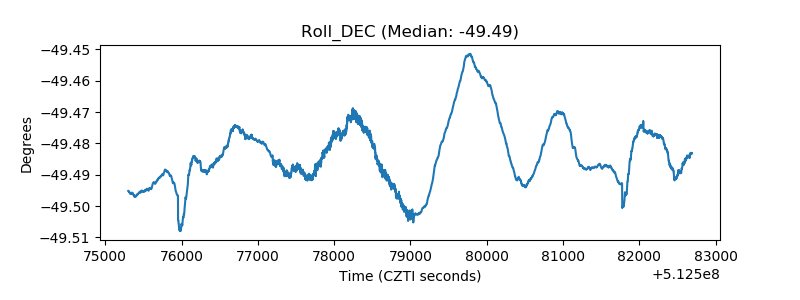 |
| _Roll_RA | 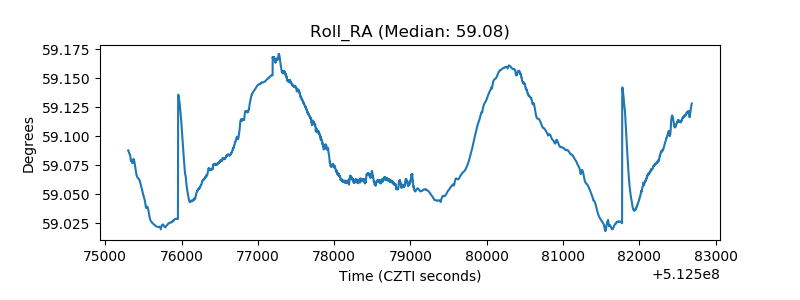 |
| Veto Counter | 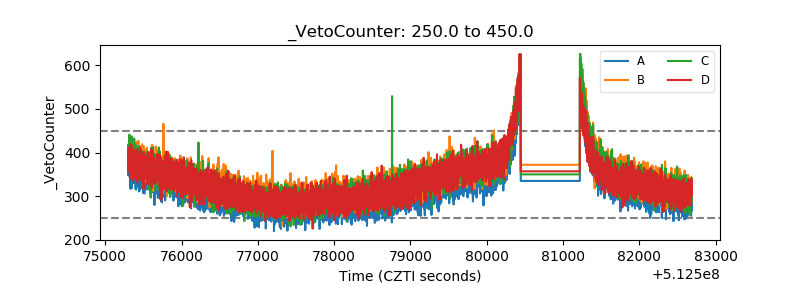 |