| Param | Original file | Final file |
|---|---|---|
| Filename | modeM0/AS1A14_083T03_9000006562_56831cztM0_level2.fits | modeM0/AS1A14_083T03_9000006562_56831cztM0_level2_quad_clean.evt |
| Size (bytes) | 753,048,000 | 95,984,640 |
| Size | 718.2 MB | 91.5 MB |
| Events in quadrant A | 7,210,654 | 676,600 |
| Events in quadrant B | 5,622,586 | 647,197 |
| Events in quadrant C | 10,164,927 | 470,047 |
| Events in quadrant D | 4,314,407 | 605,462 |
| Mode SS | |||
|---|---|---|---|
| Quadrant | BADHDUFLAG | Total packets | Discarded packets |
| A | 0 | 146 | 0 |
| B | 0 | 146 | 0 |
| C | 0 | 146 | 0 |
| D | 0 | 146 | 0 |
| Mode M0 | |||
|---|---|---|---|
| Quadrant | BADHDUFLAG | Total packets | Discarded packets |
| A | 0 | 26675 | 0 |
| B | 0 | 21906 | 0 |
| C | 0 | 35260 | 0 |
| D | 0 | 18192 | 0 |
| Quadrant | Total seconds | Saturated seconds | Saturation percentage |
|---|---|---|---|
| A | 7278 | 114 | 1.566364% |
| B | 7279 | 828 | 11.375189% |
| C | 7279 | 2222 | 30.526171% |
| D | 7279 | 133 | 1.827174% |
Noise dominated data is calculated using 1-second bins in cleaned event files. If a bin has >2000 counts, and if more than 50% of those come from <1% of pixels, then it is considered to be noise-dominated and hence unusable.
| Quadrant | # 1 sec bins | Bins with >0 counts | Bins with >2000 counts | High rate bins dominated by noise | Noise dominated (total time) | Noise dominated (detector-on time) | Marked lightcurve |
|---|---|---|---|---|---|---|---|
| A | 7278 | 7278 | 52 | 52 | 0.71% | 0.71% | 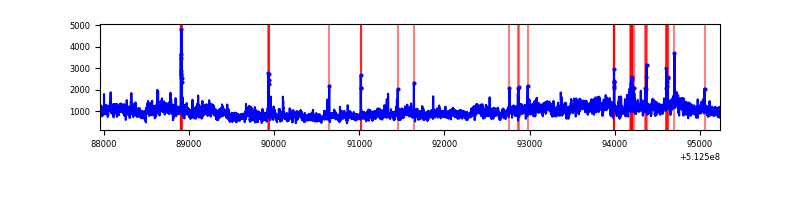 |
| B | 7279 | 7279 | 636 | 636 | 8.74% | 8.74% | 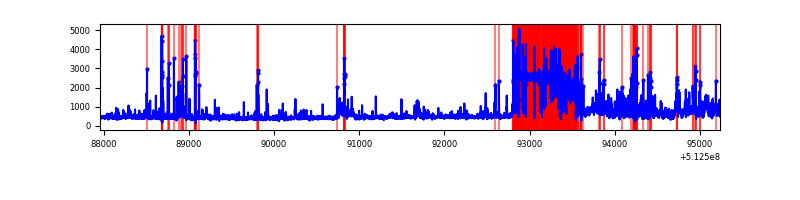 |
| C | 7278 | 7278 | 2152 | 2152 | 29.57% | 29.57% | 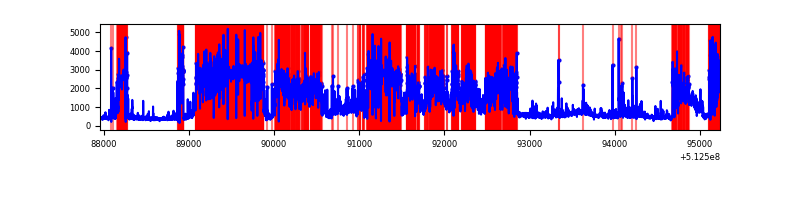 |
| D | 7279 | 7279 | 157 | 157 | 2.16% | 2.16% | 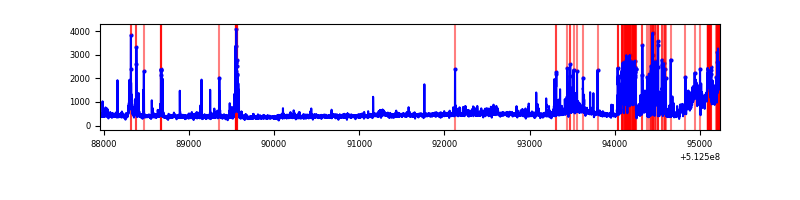 |
Top three noisy pixels from each quadrant. If the there are fewer than three noisy pixels in the level2.evt file, extra rows are filled as -1
| Pixel properties | Quadrant properties | ||||||
|---|---|---|---|---|---|---|---|
| Quadrant | DetID | PixID | Counts | Sigma | Mean | Median | Sigma |
| A | 3 | 14 | 3932477 | 20886.17 | 757 | 737 | 188.2 |
| A | 10 | 251 | 139135 | 735.2 | 757 | 737 | 188.2 |
| A | 7 | 64 | 60494 | 317.44 | 757 | 737 | 188.2 |
| B | 5 | 172 | 1931313 | 12758.42 | 703 | 678 | 151.3 |
| B | 2 | 249 | 442105 | 2917.13 | 703 | 678 | 151.3 |
| B | 5 | 185 | 136691 | 898.83 | 703 | 678 | 151.3 |
| C | 12 | 249 | 6673142 | 38243.88 | 637 | 631 | 174.5 |
| C | 12 | 252 | 378886 | 2167.99 | 637 | 631 | 174.5 |
| C | 15 | 208 | 123503 | 704.25 | 637 | 631 | 174.5 |
| D | 2 | 62 | 975727 | 4709.23 | 733 | 700 | 207.0 |
| D | 2 | 249 | 180152 | 866.73 | 733 | 700 | 207.0 |
| D | 2 | 120 | 116775 | 560.62 | 733 | 700 | 207.0 |
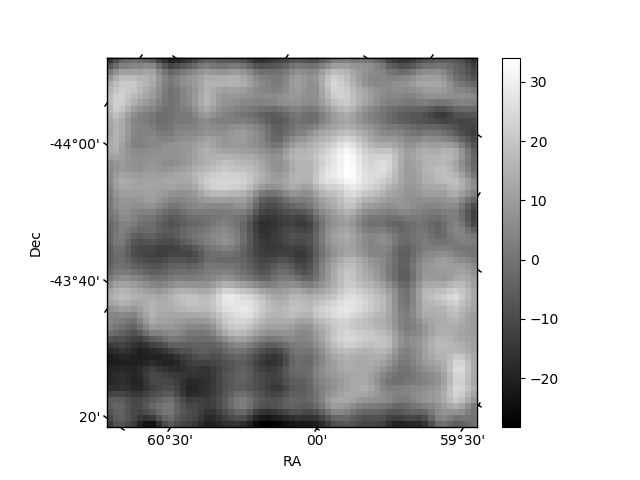
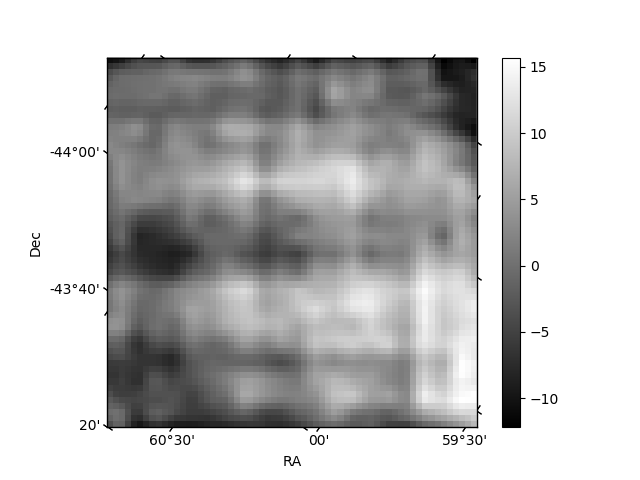
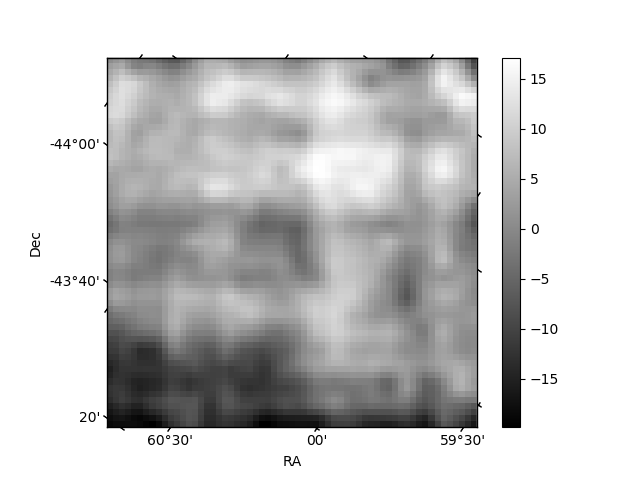
Histogram calculated using DETX and DETY for each event in the final _common_clean file
| Quadrant A | 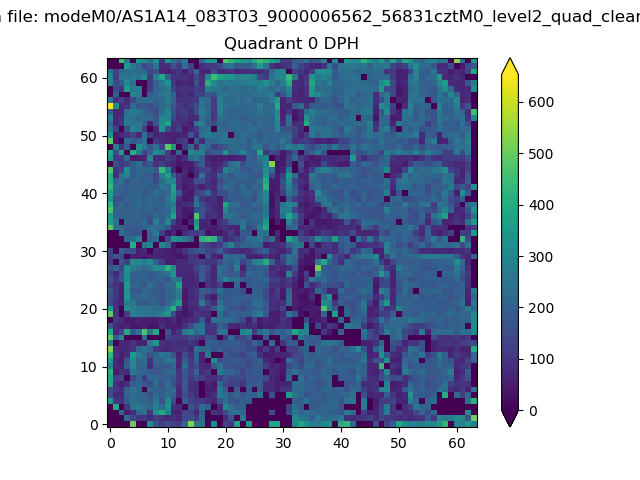 |
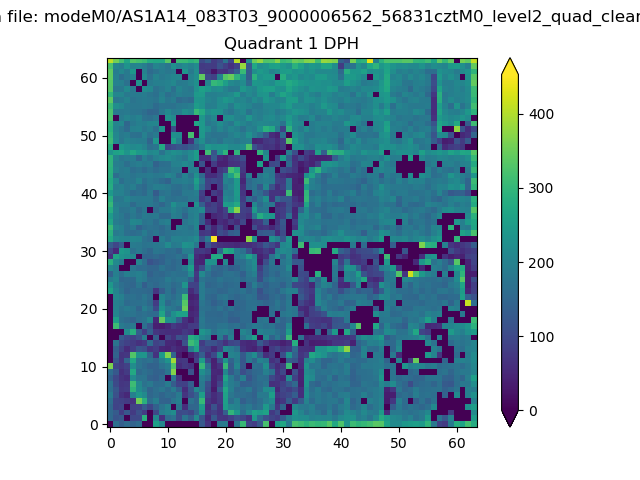 |
Quadrant B |
|---|---|---|---|
| Quadrant D | 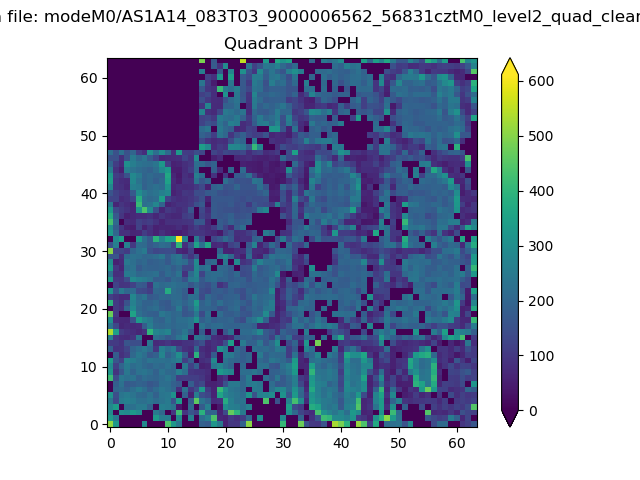 |
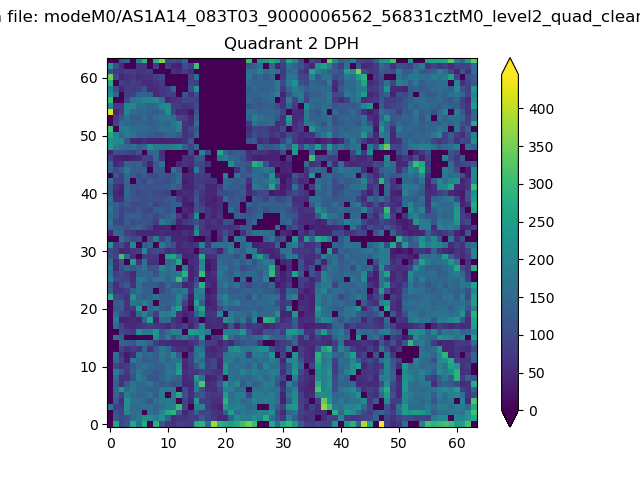 |
Quadrant C |
| Plot type | Count rate plots | Images |
|---|---|---|
| Comparison with Poisson distribution Blue bars denote a histogram of data divided into 1 sec bins. Red curve is a Poisson curve with rate = median count rate of data. |
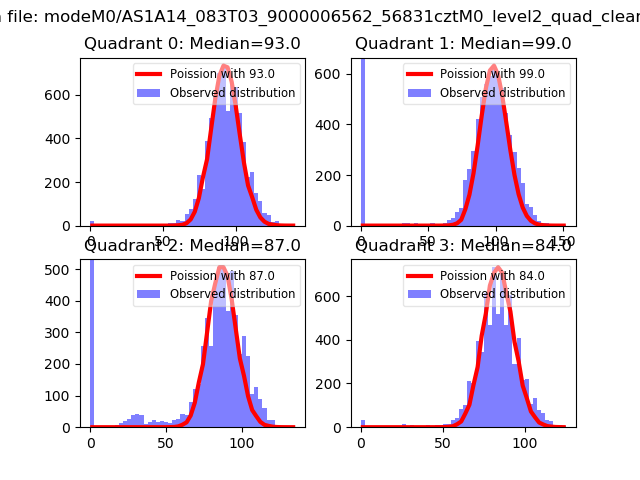 |
 |
| Quadrant-wise count rates Data is divided into 100 sec bins |
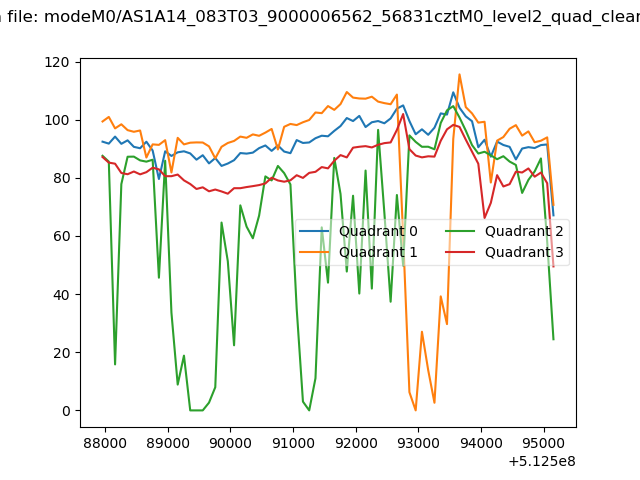 |
|
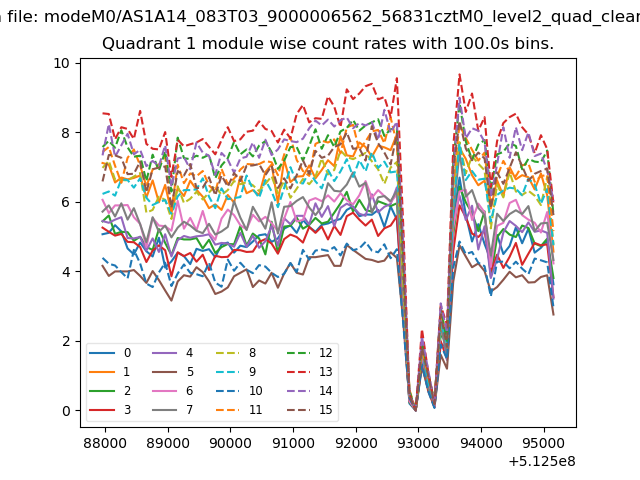
| Module-wise count rates for Quadrant A Data is divided into 100 sec bins |
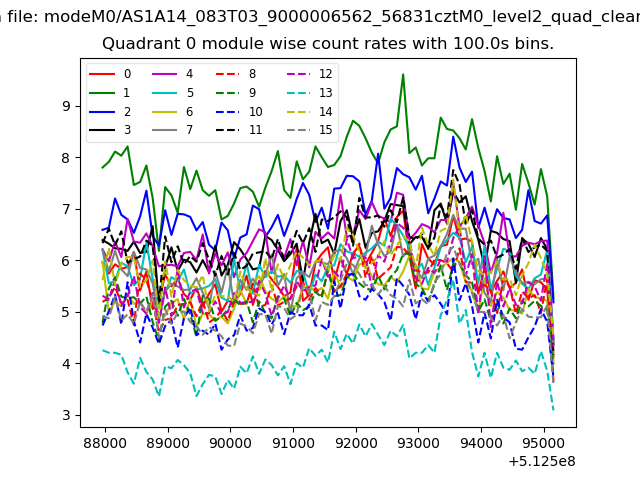 |
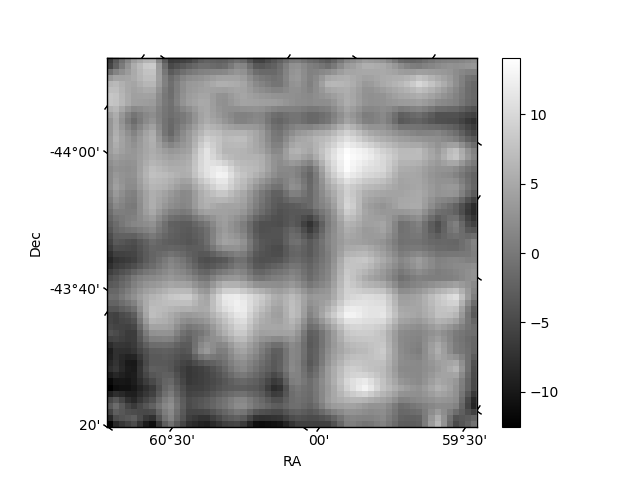 |
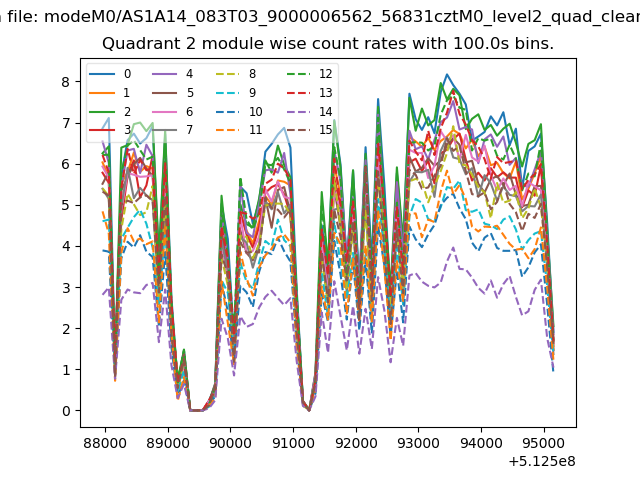
| Module-wise count rates for Quadrant B Data is divided into 100 sec bins |
 |
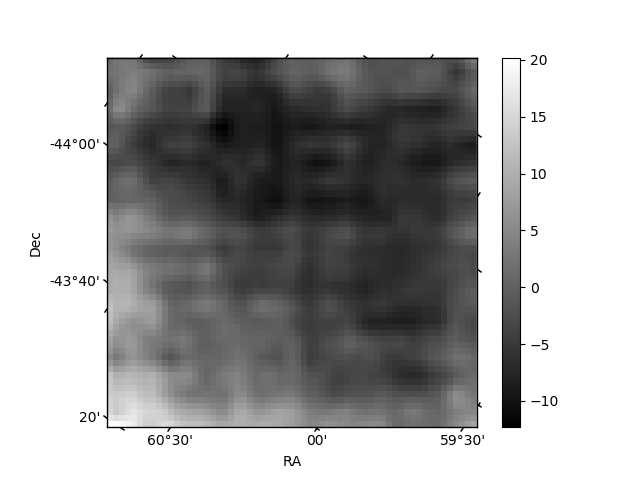 |
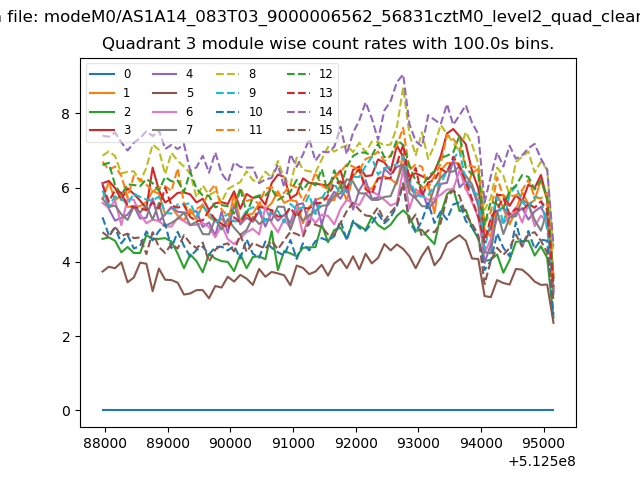
| Module-wise count rates for Quadrant C Data is divided into 100 sec bins |
 |
 |
| Module-wise count rates for Quadrant D Data is divided into 100 sec bins |
 |
 |
| Parameter | Plot |
|---|---|
| CZT HV Monitor | 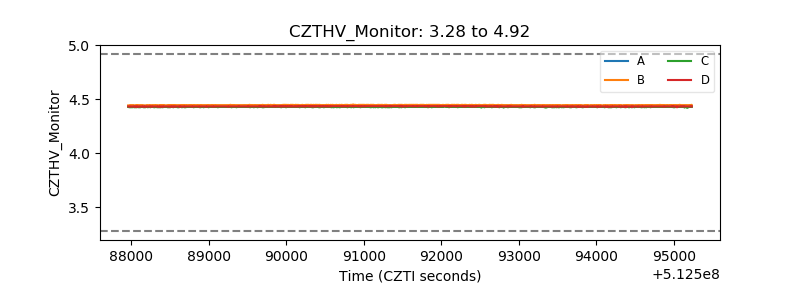 |
| D_VDD | 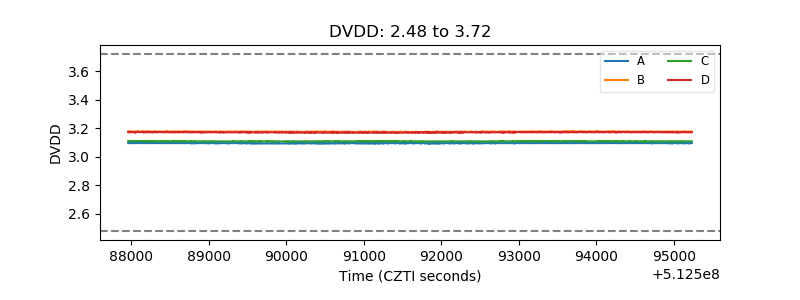 |
| Temperature 1 | 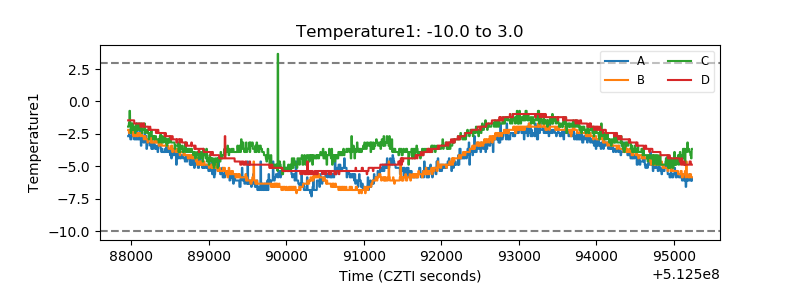 |
| Veto HV Monitor | 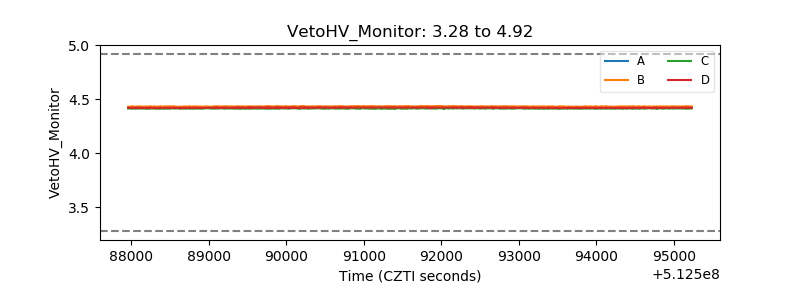 |
| Veto LLD | 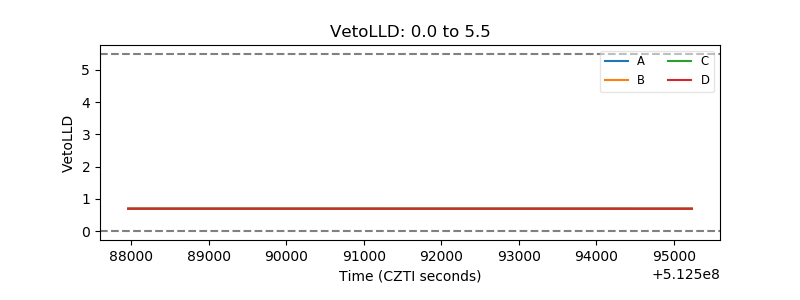 |
| Alpha Counter | 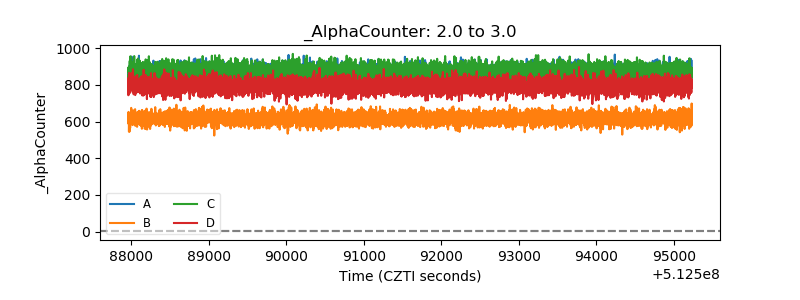 |
| _CPM_Rate | 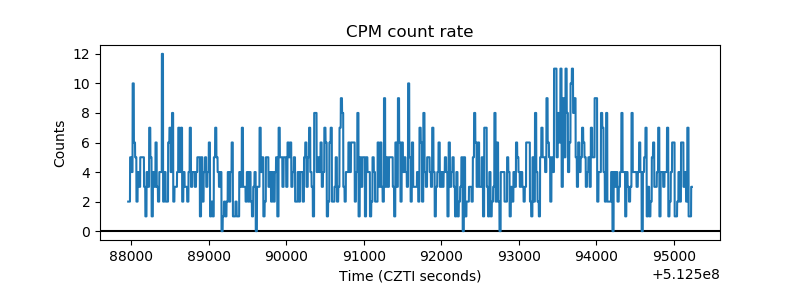 |
| CZT Counter | 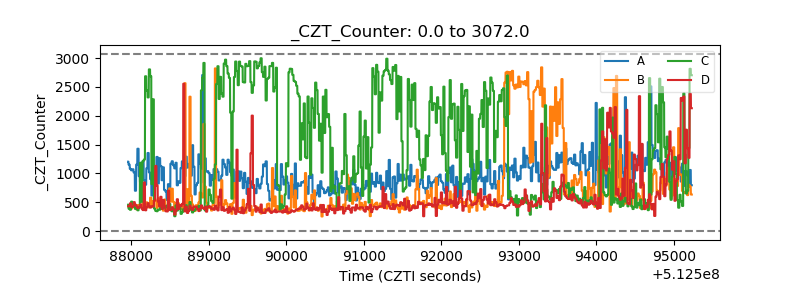 |
| +2.5 Volts monitor |  |
| +5 Volts monitor | 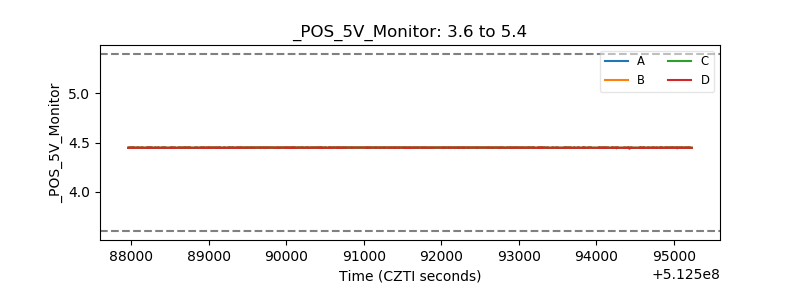 |
| _ROLL_ROT | 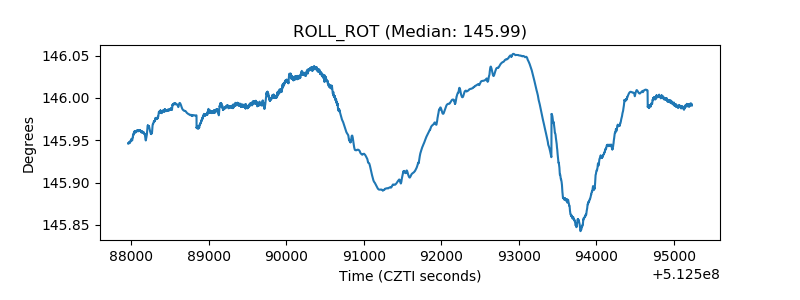 |
| _Roll_DEC | 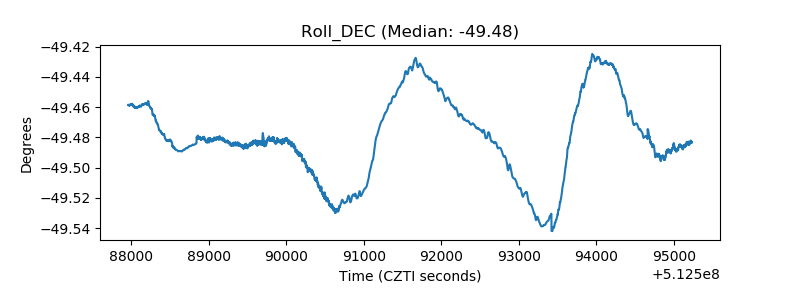 |
| _Roll_RA | 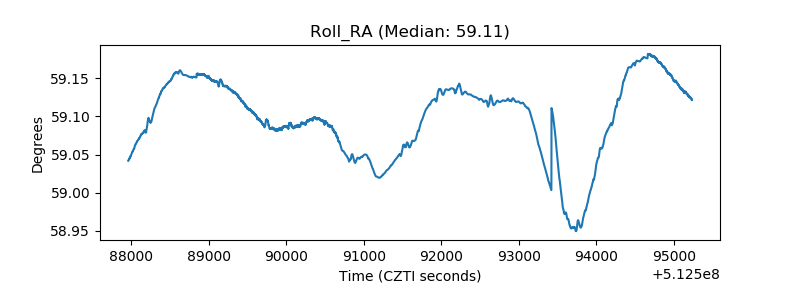 |
| Veto Counter | 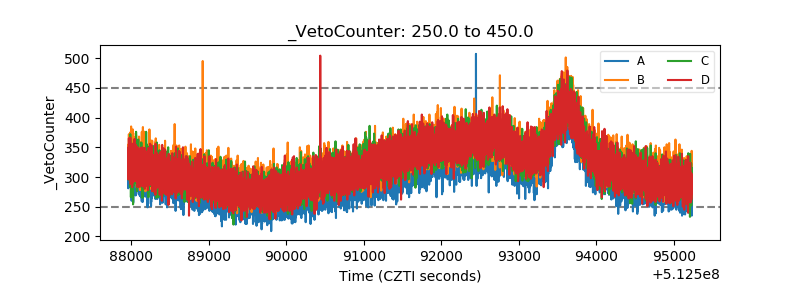 |