| Param | Original file | Final file |
|---|---|---|
| Filename | modeM0/AS1A14_083T03_9000006562_56832cztM0_level2.fits | modeM0/AS1A14_083T03_9000006562_56832cztM0_level2_quad_clean.evt |
| Size (bytes) | 861,390,720 | 93,867,840 |
| Size | 821.5 MB | 89.5 MB |
| Events in quadrant A | 6,361,774 | 686,909 |
| Events in quadrant B | 6,740,813 | 665,361 |
| Events in quadrant C | 12,537,101 | 370,531 |
| Events in quadrant D | 5,672,986 | 602,657 |
| Mode SS | |||
|---|---|---|---|
| Quadrant | BADHDUFLAG | Total packets | Discarded packets |
| A | 0 | 148 | 0 |
| B | 0 | 148 | 0 |
| C | 0 | 148 | 0 |
| D | 0 | 148 | 0 |
| Mode M0 | |||
|---|---|---|---|
| Quadrant | BADHDUFLAG | Total packets | Discarded packets |
| A | 0 | 24317 | 0 |
| B | 0 | 25131 | 0 |
| C | 0 | 42350 | 0 |
| D | 0 | 22086 | 1 |
| Quadrant | Total seconds | Saturated seconds | Saturation percentage |
|---|---|---|---|
| A | 7420 | 105 | 1.415094% |
| B | 7421 | 912 | 12.289449% |
| C | 7421 | 3358 | 45.249966% |
| D | 7420 | 316 | 4.258760% |
Noise dominated data is calculated using 1-second bins in cleaned event files. If a bin has >2000 counts, and if more than 50% of those come from <1% of pixels, then it is considered to be noise-dominated and hence unusable.
| Quadrant | # 1 sec bins | Bins with >0 counts | Bins with >2000 counts | High rate bins dominated by noise | Noise dominated (total time) | Noise dominated (detector-on time) | Marked lightcurve |
|---|---|---|---|---|---|---|---|
| A | 7420 | 7420 | 47 | 47 | 0.63% | 0.63% | 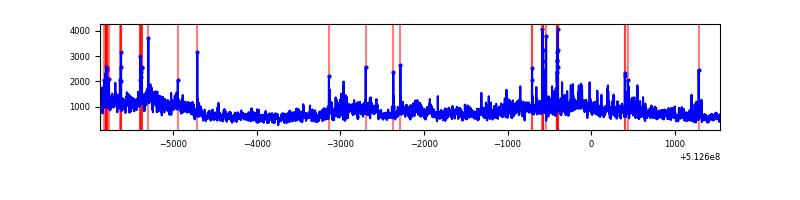 |
| B | 7421 | 7421 | 605 | 605 | 8.15% | 8.15% | 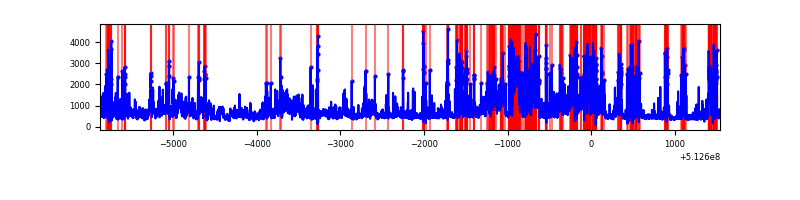 |
| C | 7421 | 7421 | 3159 | 3159 | 42.57% | 42.57% | 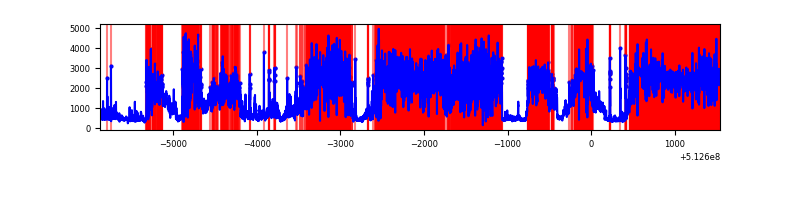 |
| D | 7420 | 7420 | 333 | 333 | 4.49% | 4.49% | 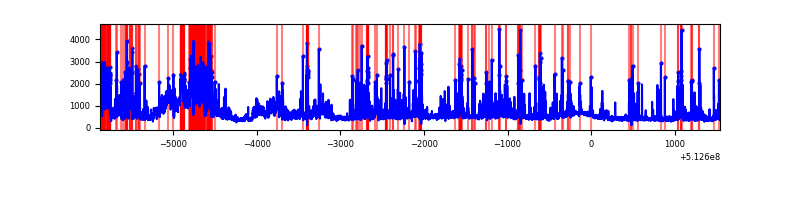 |
Top three noisy pixels from each quadrant. If the there are fewer than three noisy pixels in the level2.evt file, extra rows are filled as -1
| Pixel properties | Quadrant properties | ||||||
|---|---|---|---|---|---|---|---|
| Quadrant | DetID | PixID | Counts | Sigma | Mean | Median | Sigma |
| A | 3 | 14 | 2952460 | 15340.71 | 775 | 754 | 192.4 |
| A | 10 | 251 | 129599 | 669.64 | 775 | 754 | 192.4 |
| A | 7 | 64 | 124043 | 640.76 | 775 | 754 | 192.4 |
| B | 5 | 185 | 1245637 | 7945.69 | 726 | 699 | 156.7 |
| B | 5 | 172 | 1220471 | 7785.07 | 726 | 699 | 156.7 |
| B | 2 | 249 | 975475 | 6221.41 | 726 | 699 | 156.7 |
| C | 12 | 249 | 8769569 | 53855.35 | 593 | 587 | 162.8 |
| C | 12 | 252 | 889791 | 5461.11 | 593 | 587 | 162.8 |
| C | 9 | 38 | 99447 | 607.16 | 593 | 587 | 162.8 |
| D | 2 | 62 | 1348778 | 6448.52 | 739 | 707 | 209.1 |
| D | 8 | 240 | 686962 | 3282.71 | 739 | 707 | 209.1 |
| D | 2 | 31 | 259861 | 1239.67 | 739 | 707 | 209.1 |
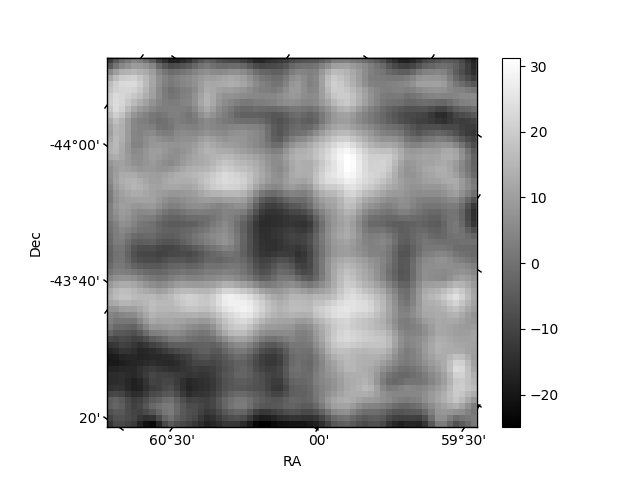
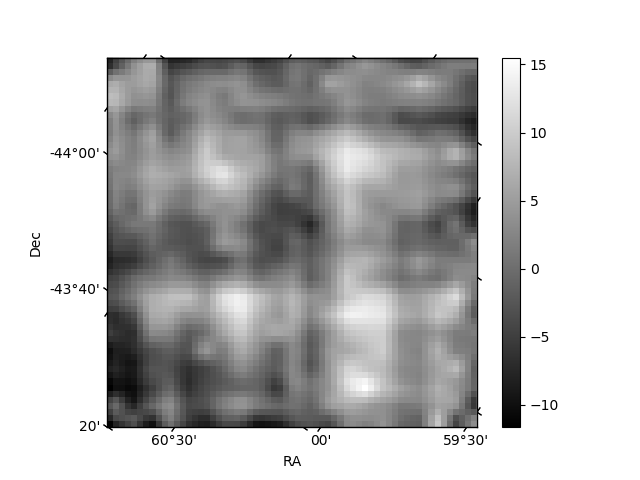
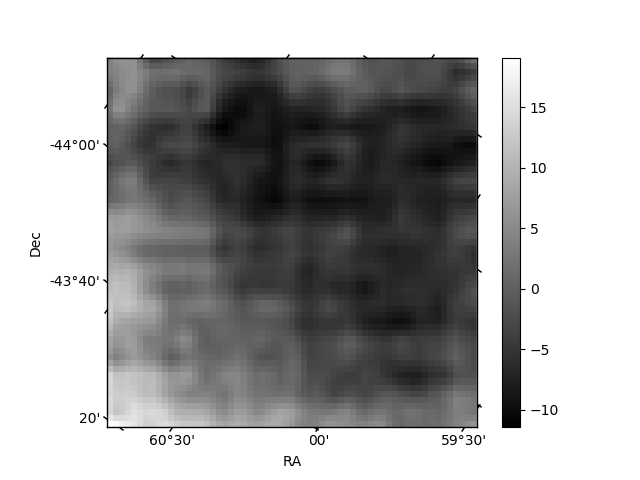
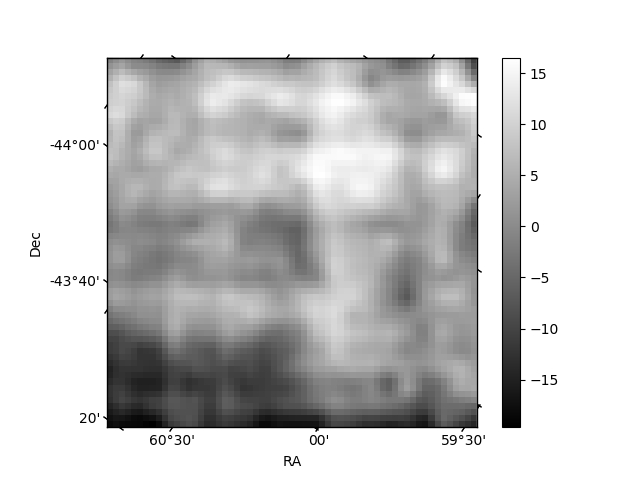
Histogram calculated using DETX and DETY for each event in the final _common_clean file
| Quadrant A | 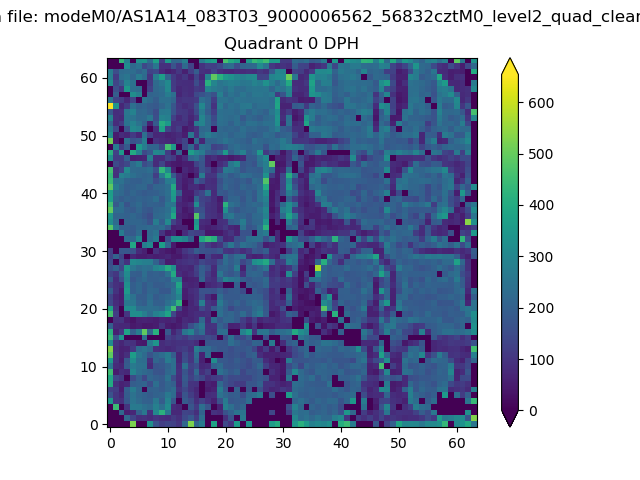 |
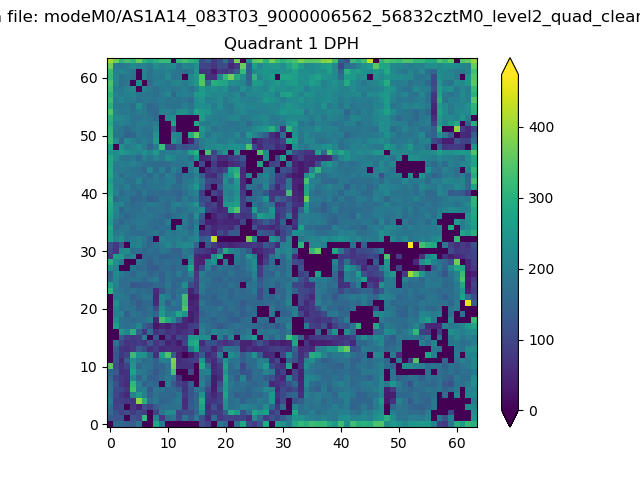 |
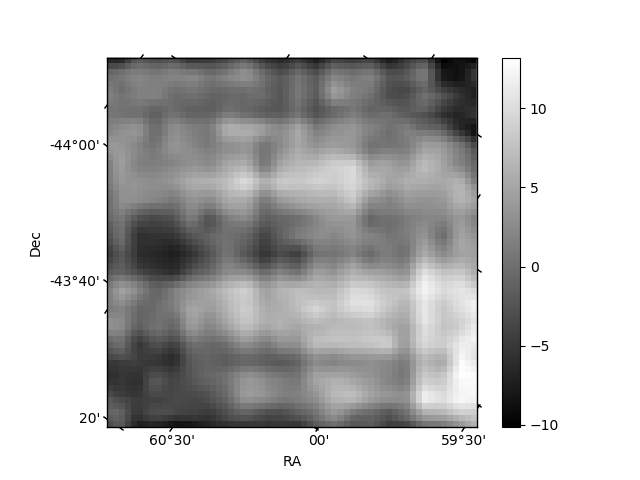
Quadrant B |
|---|---|---|---|
| Quadrant D |  |
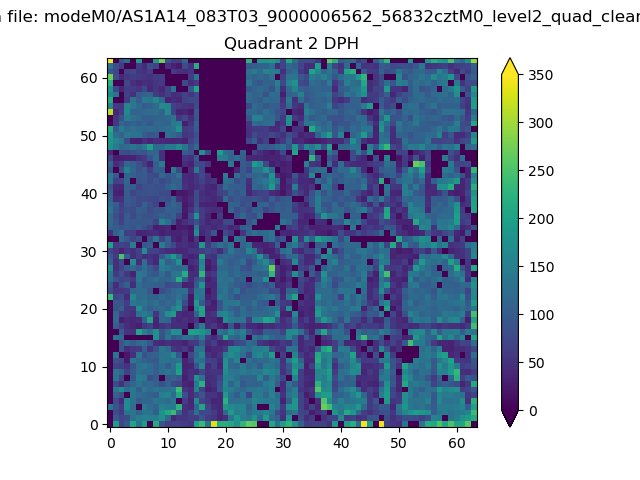 |
Quadrant C |
| Plot type | Count rate plots | Images |
|---|---|---|
| Comparison with Poisson distribution Blue bars denote a histogram of data divided into 1 sec bins. Red curve is a Poisson curve with rate = median count rate of data. |
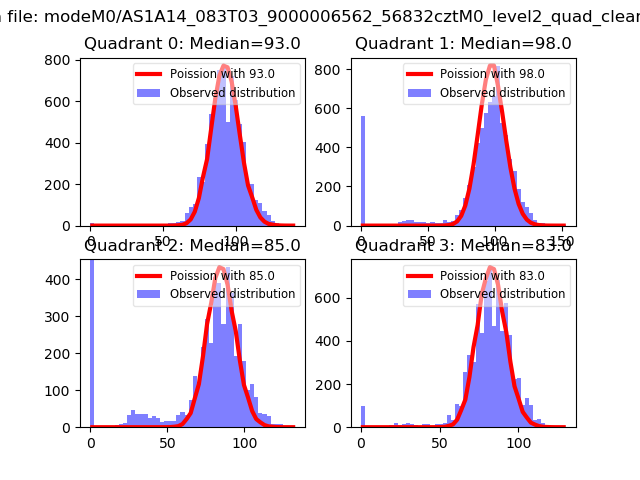 |
 |
| Quadrant-wise count rates Data is divided into 100 sec bins |
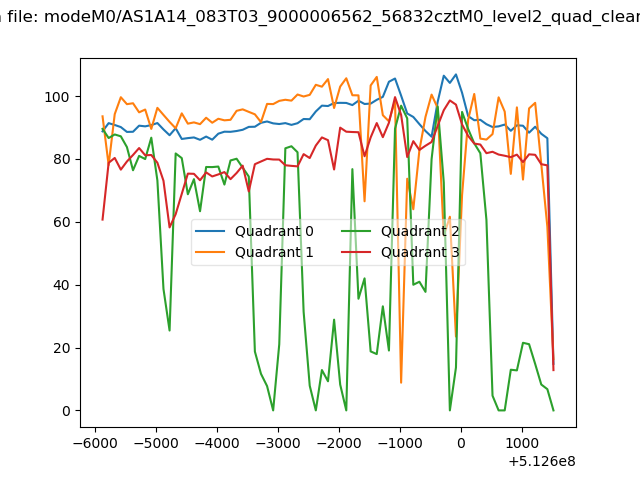 |
|
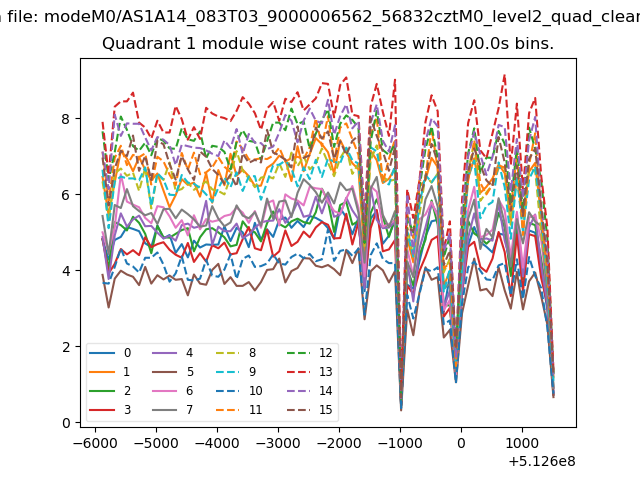
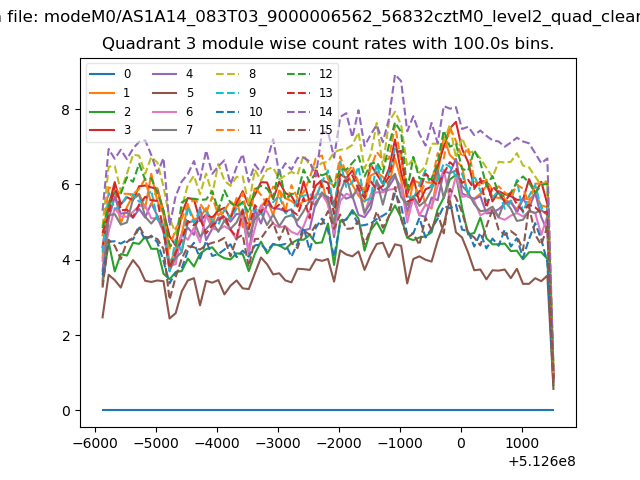
| Module-wise count rates for Quadrant A Data is divided into 100 sec bins |
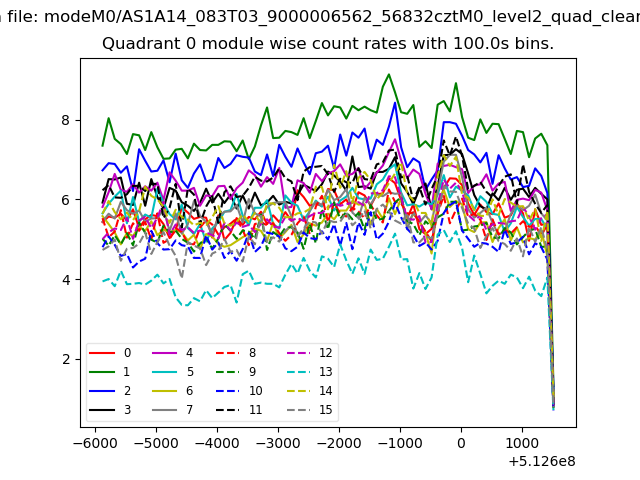 |
 |
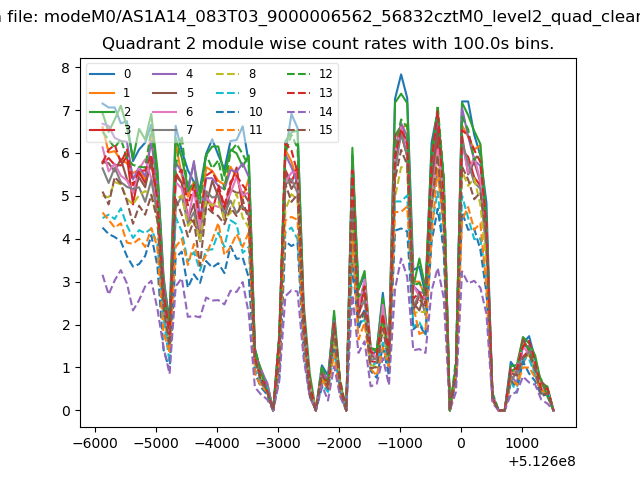
| Module-wise count rates for Quadrant B Data is divided into 100 sec bins |
 |
 |
| Module-wise count rates for Quadrant C Data is divided into 100 sec bins |
 |
 |
| Module-wise count rates for Quadrant D Data is divided into 100 sec bins |
 |
 |
| Parameter | Plot |
|---|---|
| CZT HV Monitor | 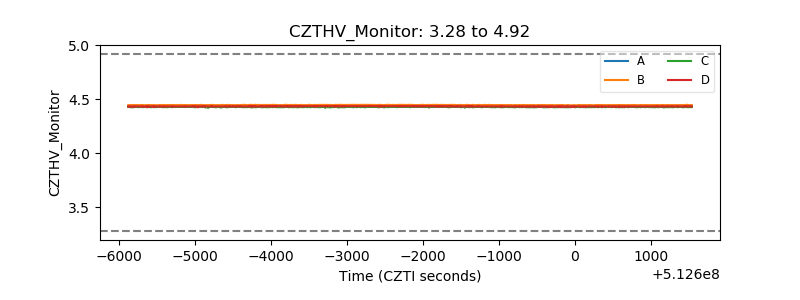 |
| D_VDD | 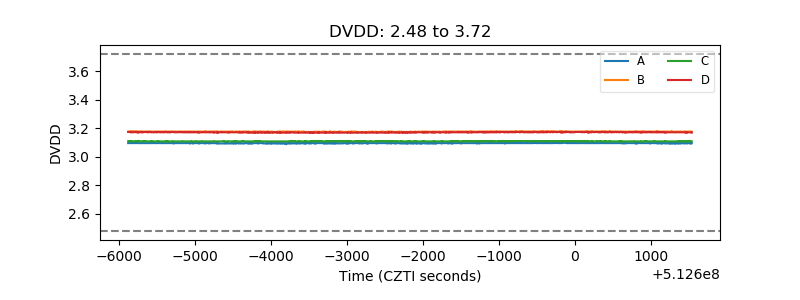 |
| Temperature 1 | 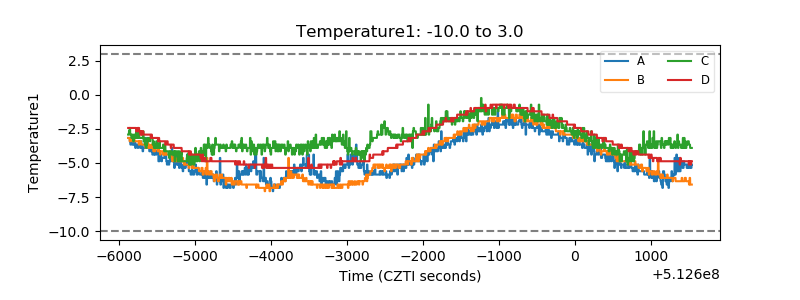 |
| Veto HV Monitor | 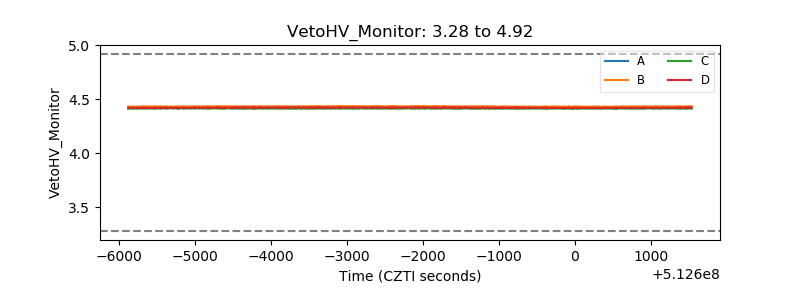 |
| Veto LLD | 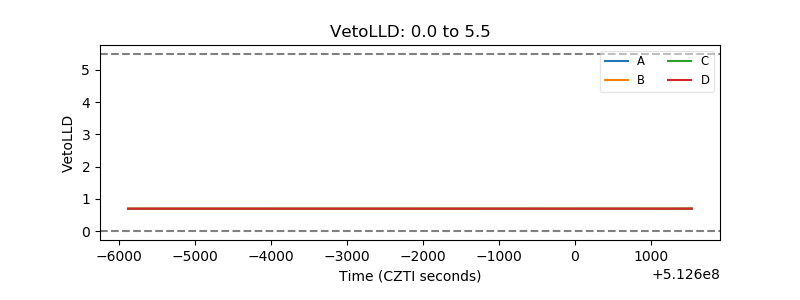 |
| Alpha Counter | 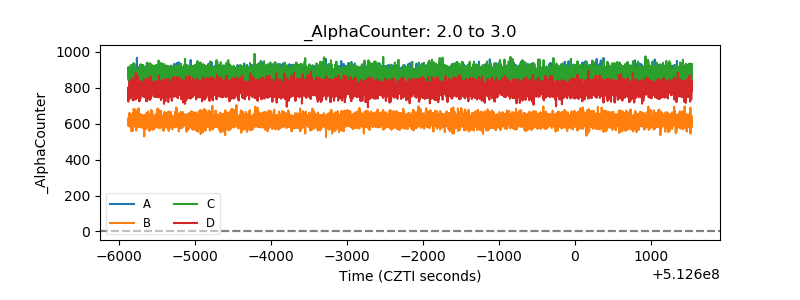 |
| _CPM_Rate | 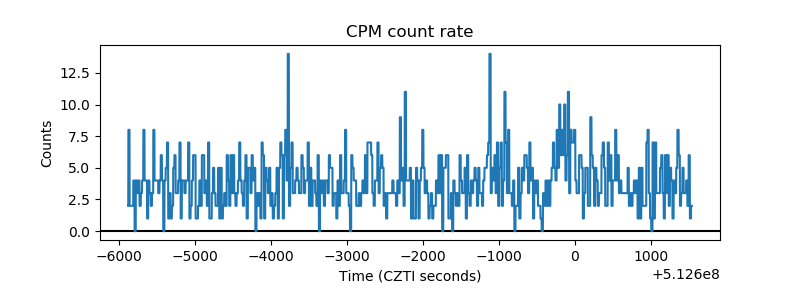 |
| CZT Counter | 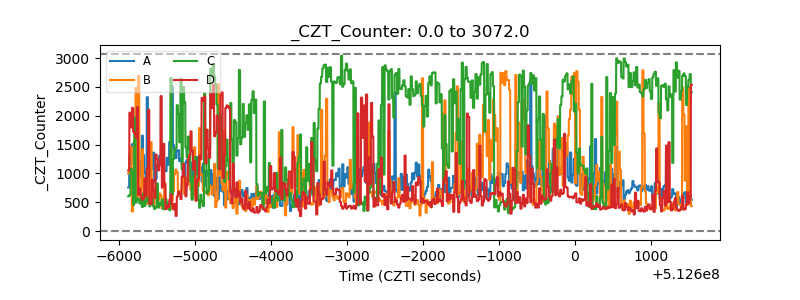 |
| +2.5 Volts monitor | 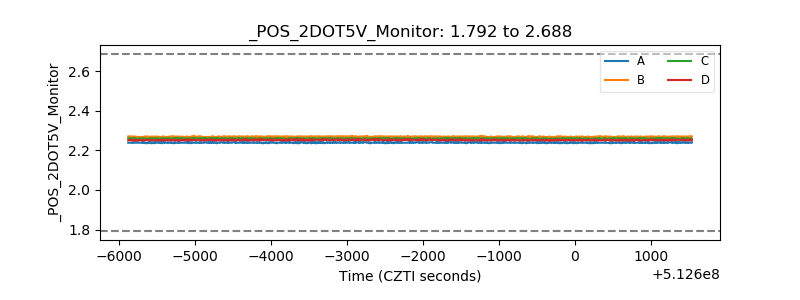 |
| +5 Volts monitor | 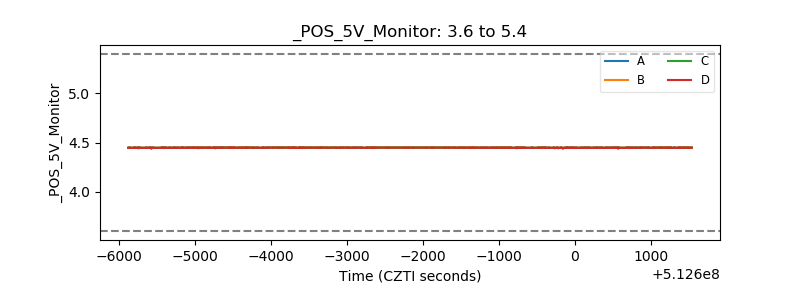 |
| _ROLL_ROT | 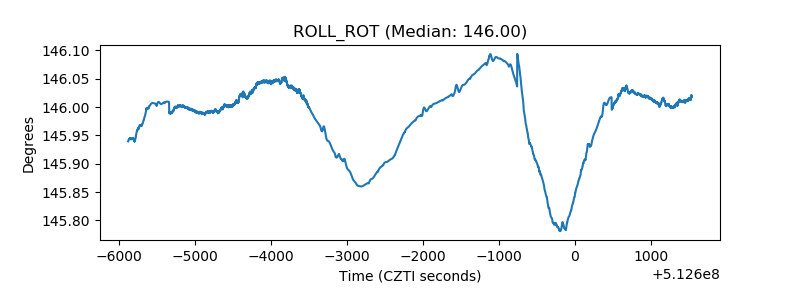 |
| _Roll_DEC | 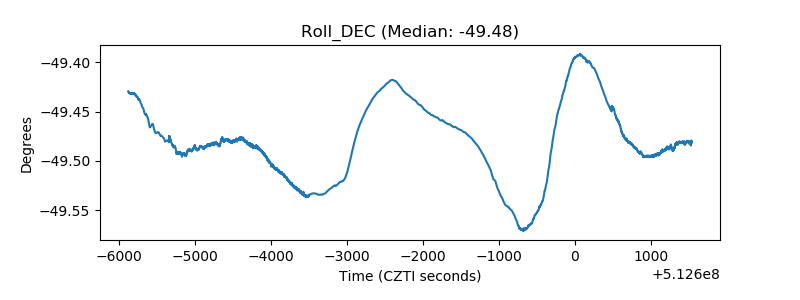 |
| _Roll_RA | 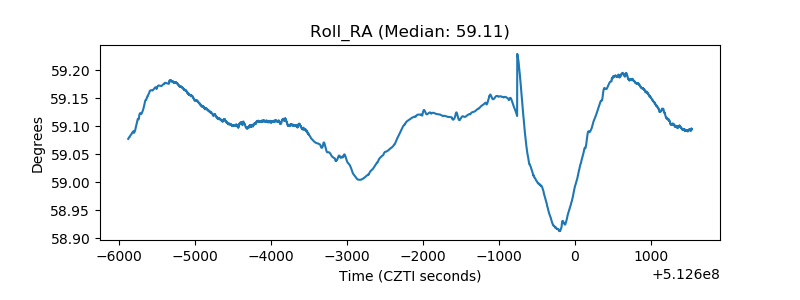 |
| Veto Counter | 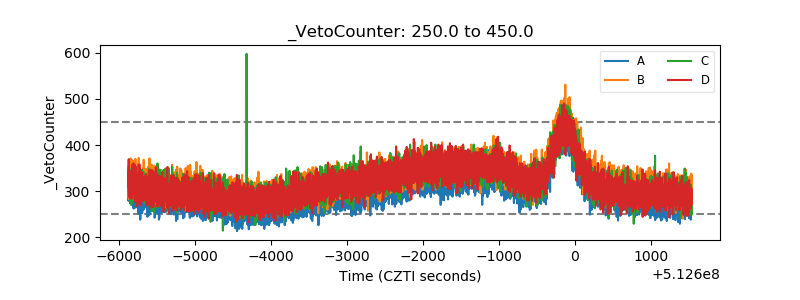 |