| Param | Original file | Final file |
|---|---|---|
| Filename | modeM0/AS1A14_083T03_9000006562_56836cztM0_level2.fits | modeM0/AS1A14_083T03_9000006562_56836cztM0_level2_quad_clean.evt |
| Size (bytes) | 521,222,400 | 100,278,720 |
| Size | 497.1 MB | 95.6 MB |
| Events in quadrant A | 4,467,798 | 660,906 |
| Events in quadrant B | 5,314,199 | 680,191 |
| Events in quadrant C | 3,868,333 | 618,174 |
| Events in quadrant D | 5,084,665 | 575,329 |
| Mode M9 | |||
|---|---|---|---|
| Quadrant | BADHDUFLAG | Total packets | Discarded packets |
| A | 0 | 14 | 0 |
| B | 0 | 14 | 0 |
| C | 0 | 14 | 0 |
| D | 0 | 14 | 0 |
| Mode SS | |||
|---|---|---|---|
| Quadrant | BADHDUFLAG | Total packets | Discarded packets |
| A | 0 | 150 | 0 |
| B | 0 | 150 | 0 |
| C | 0 | 150 | 0 |
| D | 0 | 150 | 0 |
| Mode M0 | |||
|---|---|---|---|
| Quadrant | BADHDUFLAG | Total packets | Discarded packets |
| A | 0 | 17952 | 2 |
| B | 0 | 20683 | 2 |
| C | 0 | 16739 | 2 |
| D | 0 | 20225 | 2 |
| Quadrant | Total seconds | Saturated seconds | Saturation percentage |
|---|---|---|---|
| A | 7197 | 174 | 2.417674% |
| B | 7197 | 629 | 8.739753% |
| C | 7198 | 294 | 4.084468% |
| D | 7198 | 460 | 6.390664% |
Noise dominated data is calculated using 1-second bins in cleaned event files. If a bin has >2000 counts, and if more than 50% of those come from <1% of pixels, then it is considered to be noise-dominated and hence unusable.
| Quadrant | # 1 sec bins | Bins with >0 counts | Bins with >2000 counts | High rate bins dominated by noise | Noise dominated (total time) | Noise dominated (detector-on time) | Marked lightcurve |
|---|---|---|---|---|---|---|---|
| A | 8662 | 7199 | 36 | 36 | 0.42% | 0.50% | 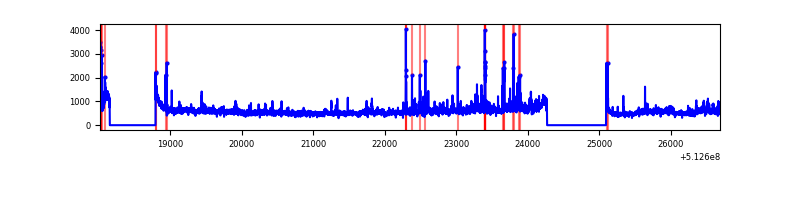 |
| B | 8662 | 7199 | 299 | 299 | 3.45% | 4.15% | 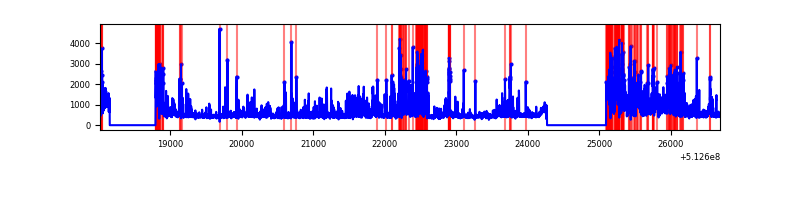 |
| C | 8663 | 7199 | 186 | 186 | 2.15% | 2.58% | 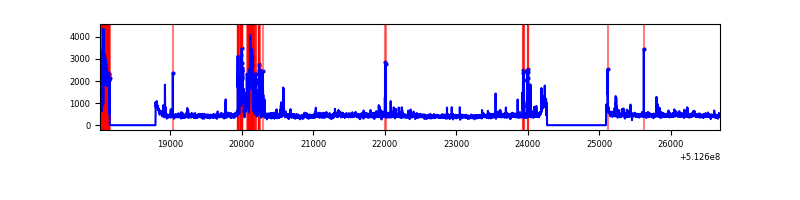 |
| D | 8663 | 7200 | 314 | 314 | 3.62% | 4.36% | 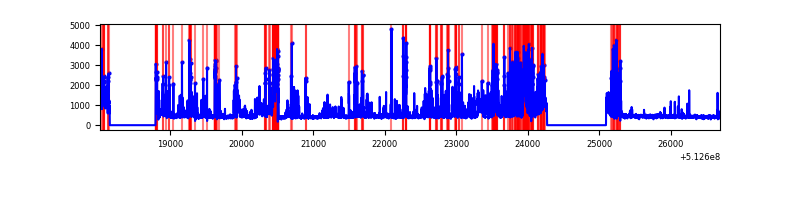 |
Top three noisy pixels from each quadrant. If the there are fewer than three noisy pixels in the level2.evt file, extra rows are filled as -1
| Pixel properties | Quadrant properties | ||||||
|---|---|---|---|---|---|---|---|
| Quadrant | DetID | PixID | Counts | Sigma | Mean | Median | Sigma |
| A | 3 | 14 | 1177963 | 6125.62 | 777 | 757 | 192.2 |
| A | 10 | 251 | 218176 | 1131.34 | 777 | 757 | 192.2 |
| A | 7 | 64 | 43441 | 222.11 | 777 | 757 | 192.2 |
| B | 5 | 185 | 1789070 | 11108.55 | 747 | 718 | 161.0 |
| B | 10 | 16 | 254124 | 1574.06 | 747 | 718 | 161.0 |
| B | 8 | 128 | 55880 | 342.64 | 747 | 718 | 161.0 |
| C | 6 | 13 | 259191 | 1268.43 | 752 | 743 | 203.8 |
| C | 12 | 249 | 237262 | 1160.8 | 752 | 743 | 203.8 |
| C | 15 | 230 | 146271 | 714.23 | 752 | 743 | 203.8 |
| D | 2 | 249 | 1011052 | 4886.42 | 741 | 707 | 206.8 |
| D | 8 | 240 | 760469 | 3674.5 | 741 | 707 | 206.8 |
| D | 2 | 31 | 124690 | 599.63 | 741 | 707 | 206.8 |
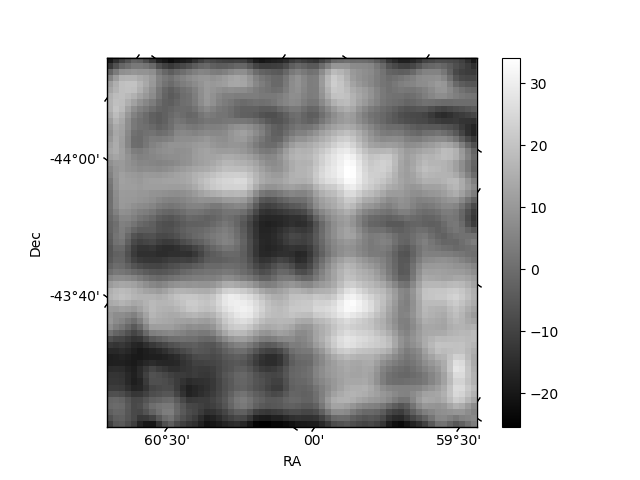
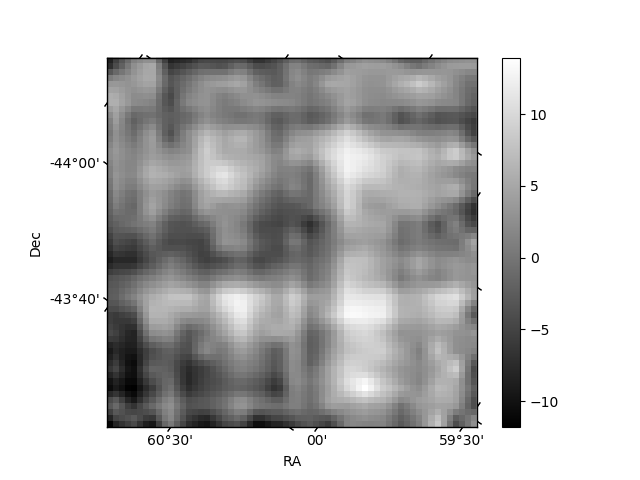
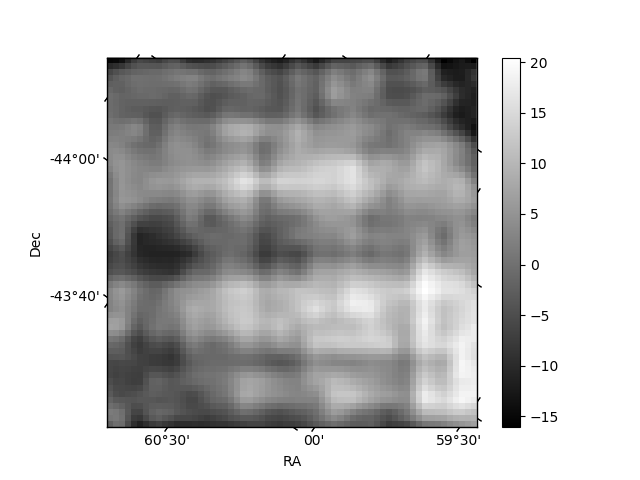
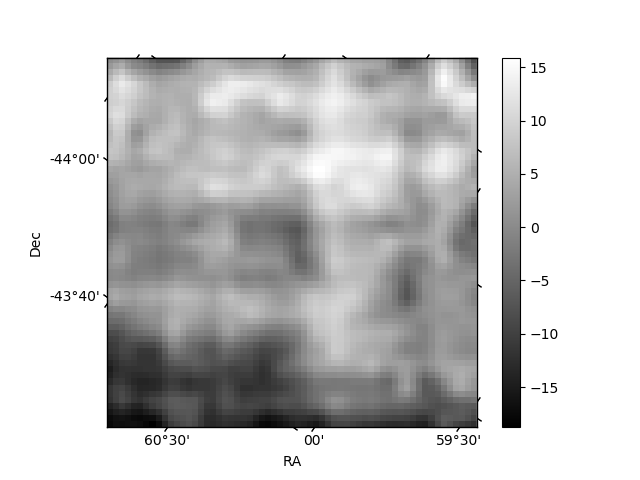
Histogram calculated using DETX and DETY for each event in the final _common_clean file
| Quadrant A | 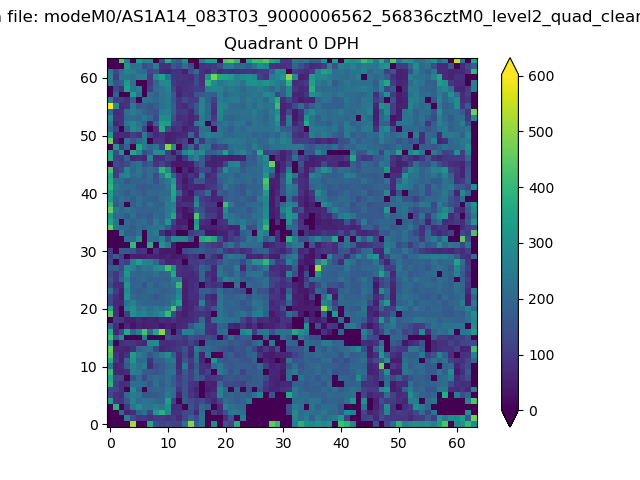 |
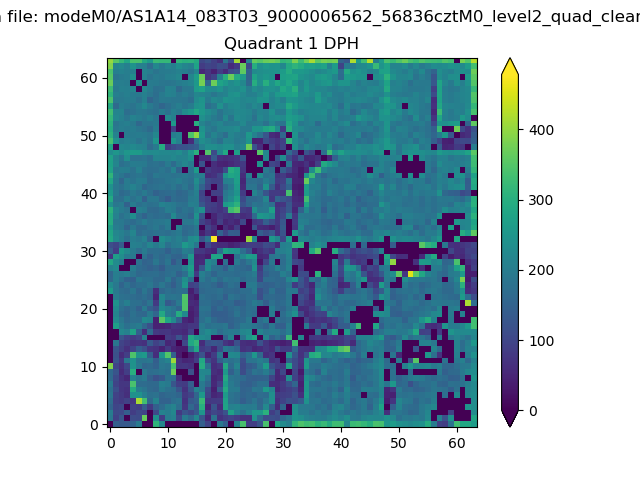 |
Quadrant B |
|---|---|---|---|
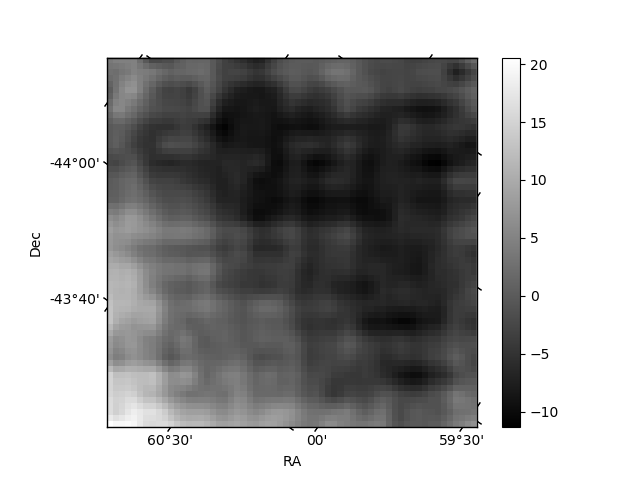
| Quadrant D | 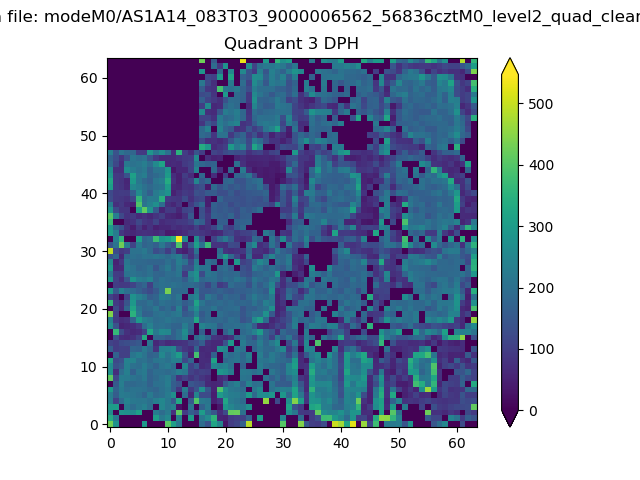 |
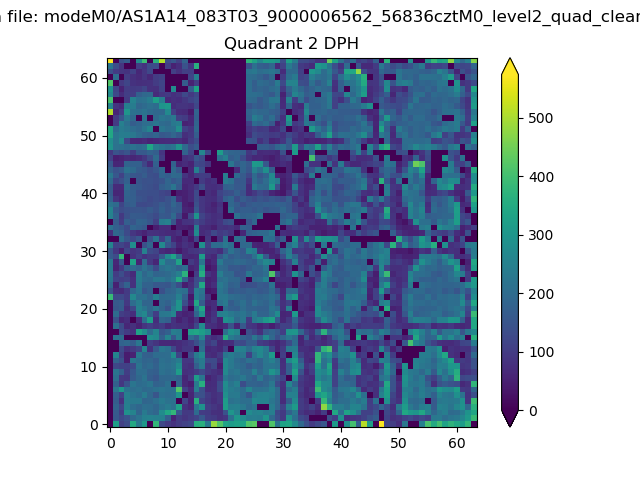 |
Quadrant C |
| Plot type | Count rate plots | Images |
|---|---|---|
| Comparison with Poisson distribution Blue bars denote a histogram of data divided into 1 sec bins. Red curve is a Poisson curve with rate = median count rate of data. |
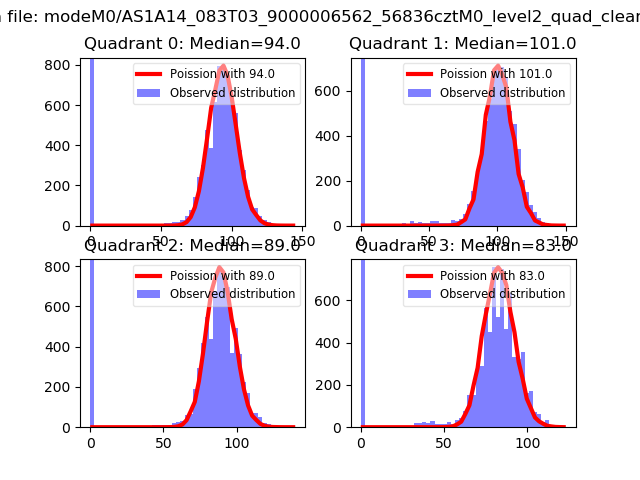 |
 |
| Quadrant-wise count rates Data is divided into 100 sec bins |
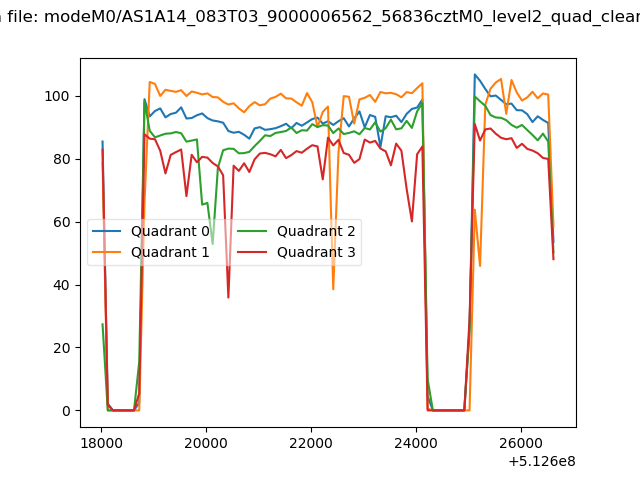 |
|
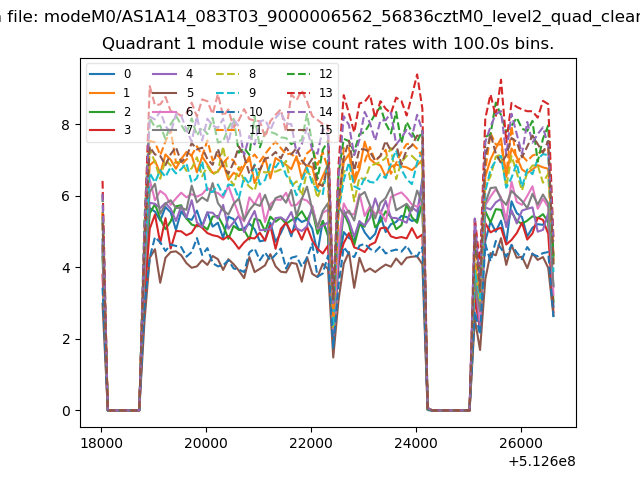
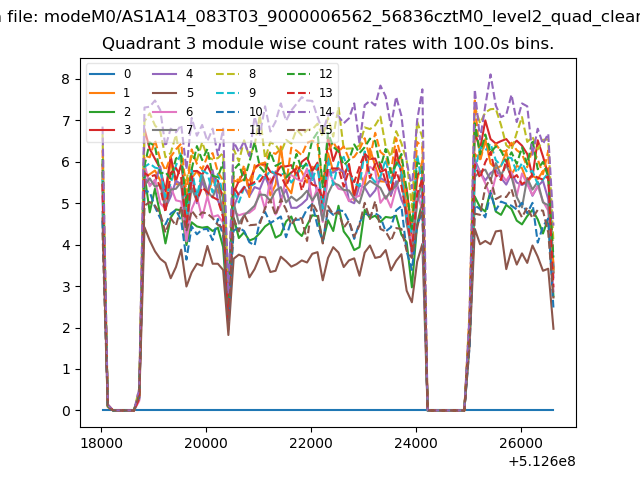
| Module-wise count rates for Quadrant A Data is divided into 100 sec bins |
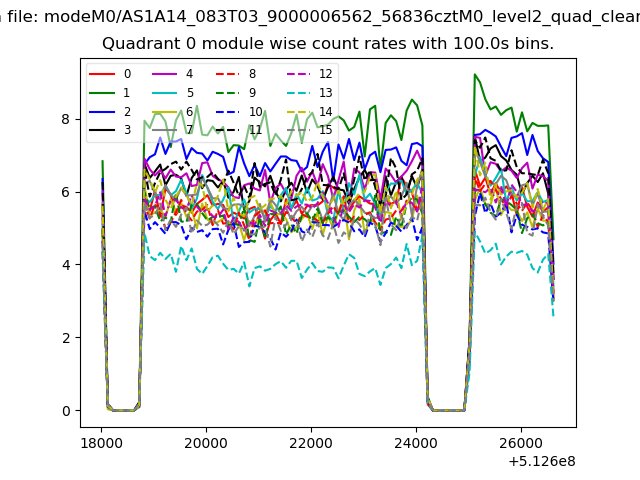 |
 |
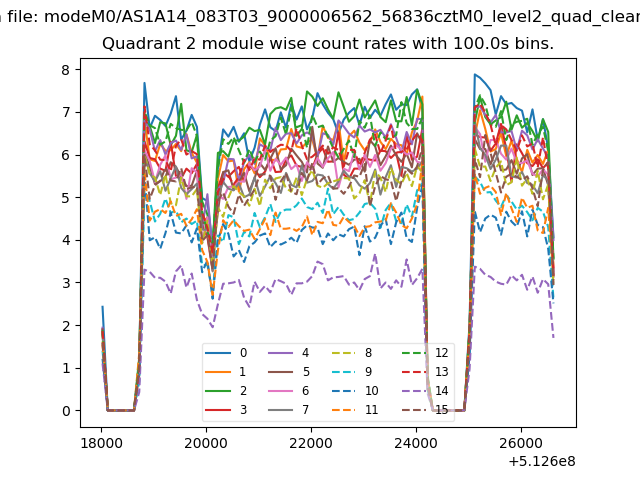
| Module-wise count rates for Quadrant B Data is divided into 100 sec bins |
 |
 |
| Module-wise count rates for Quadrant C Data is divided into 100 sec bins |
 |
 |
| Module-wise count rates for Quadrant D Data is divided into 100 sec bins |
 |
 |
| Parameter | Plot |
|---|---|
| CZT HV Monitor | 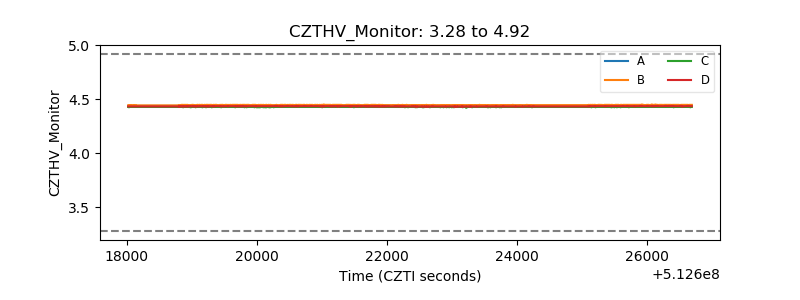 |
| D_VDD | 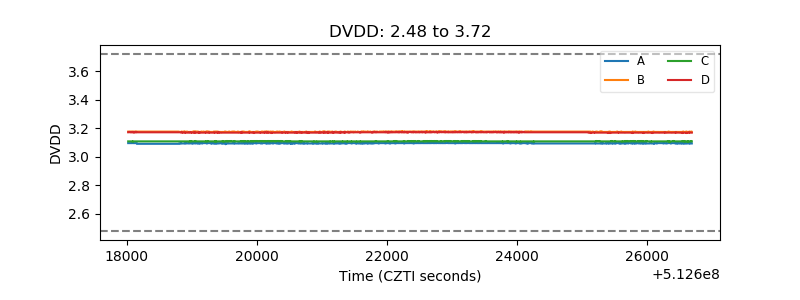 |
| Temperature 1 | 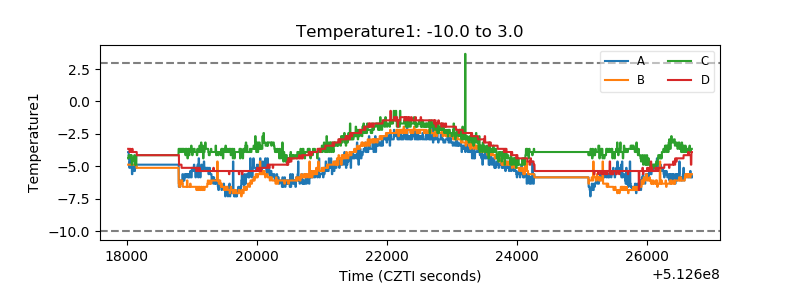 |
| Veto HV Monitor | 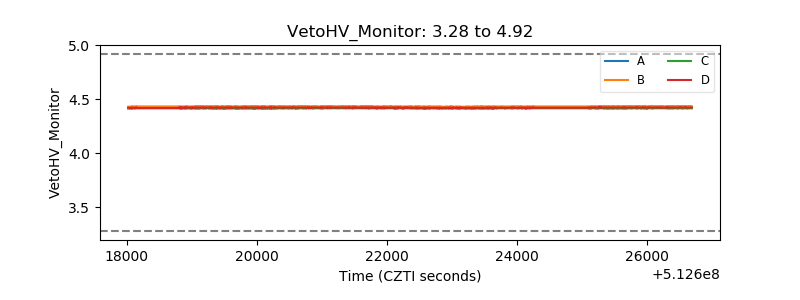 |
| Veto LLD | 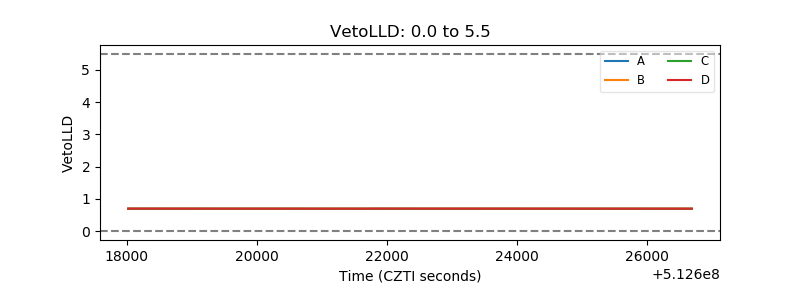 |
| Alpha Counter | 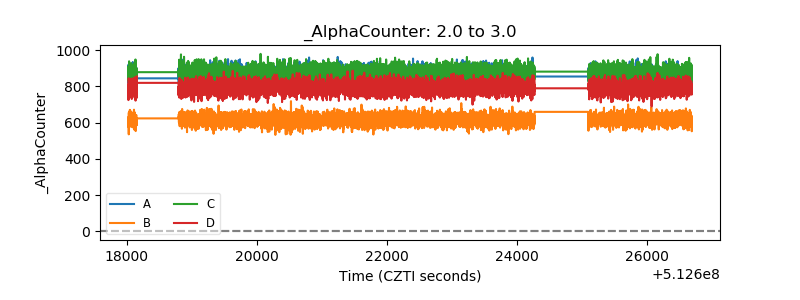 |
| _CPM_Rate | 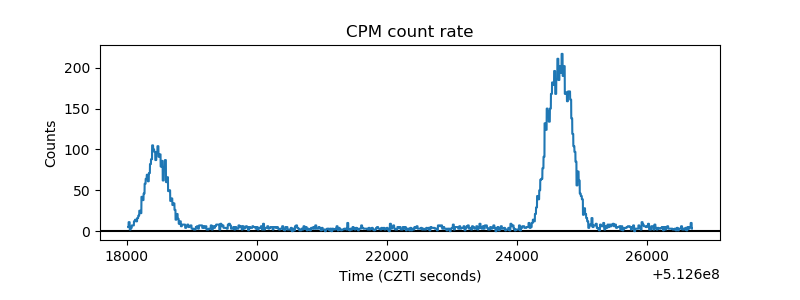 |
| CZT Counter | 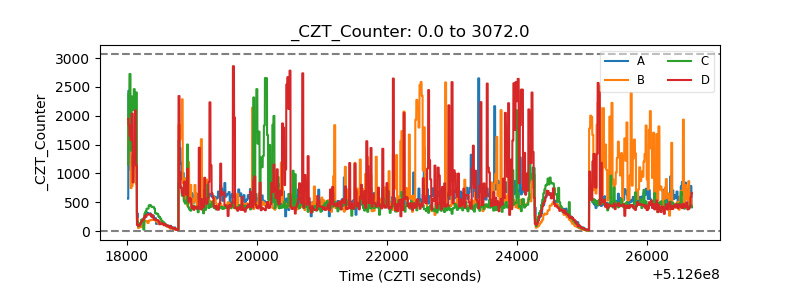 |
| +2.5 Volts monitor | 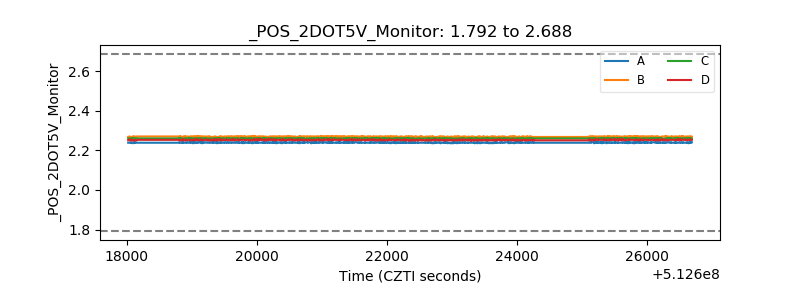 |
| +5 Volts monitor | 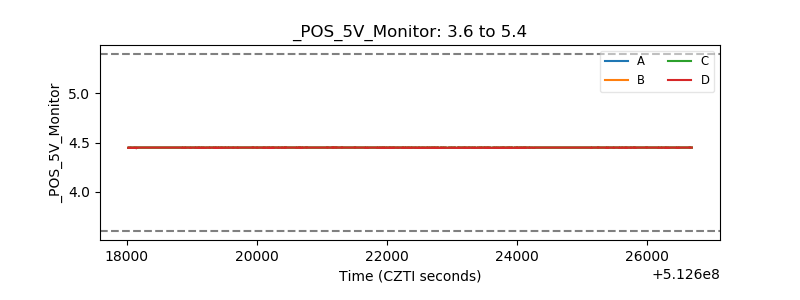 |
| _ROLL_ROT | 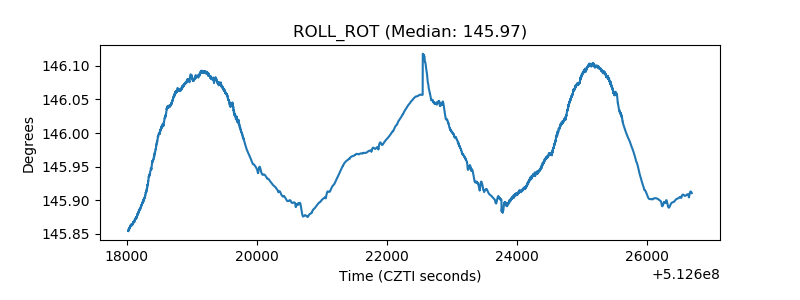 |
| _Roll_DEC | 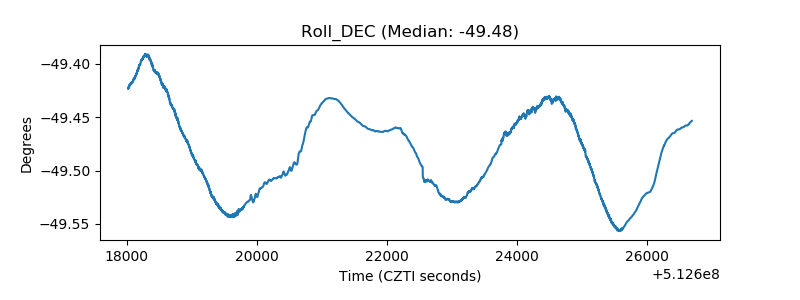 |
| _Roll_RA | 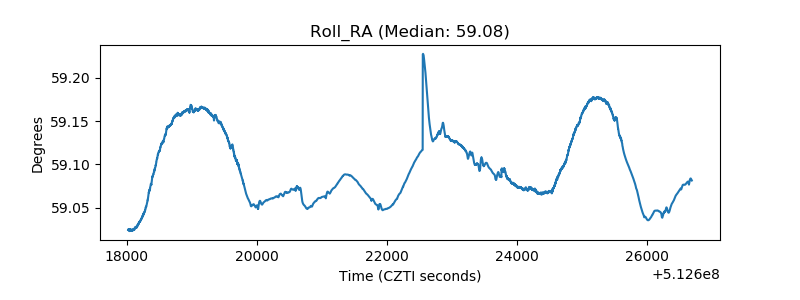 |
| Veto Counter | 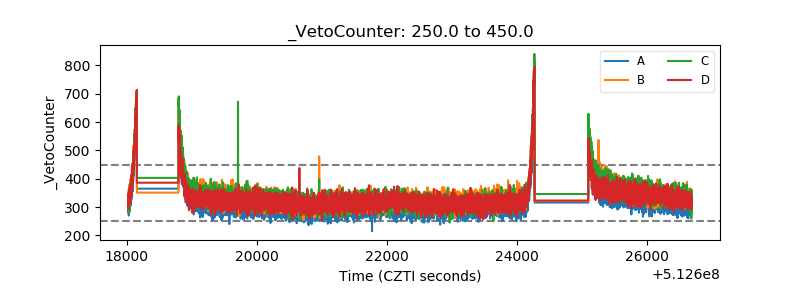 |