| Param | Original file | Final file |
|---|---|---|
| Filename | modeM0/AS1A14_083T03_9000006562_56838cztM0_level2.fits | modeM0/AS1A14_083T03_9000006562_56838cztM0_level2_quad_clean.evt |
| Size (bytes) | 455,382,720 | 87,963,840 |
| Size | 434.3 MB | 83.9 MB |
| Events in quadrant A | 4,790,551 | 578,930 |
| Events in quadrant B | 5,295,585 | 561,916 |
| Events in quadrant C | 2,860,375 | 564,422 |
| Events in quadrant D | 3,429,930 | 526,630 |
| Mode M9 | |||
|---|---|---|---|
| Quadrant | BADHDUFLAG | Total packets | Discarded packets |
| A | 0 | 9 | 0 |
| B | 0 | 9 | 0 |
| C | 0 | 9 | 0 |
| D | 0 | 9 | 0 |
| Mode SS | |||
|---|---|---|---|
| Quadrant | BADHDUFLAG | Total packets | Discarded packets |
| A | 0 | 126 | 0 |
| B | 0 | 126 | 0 |
| C | 0 | 126 | 0 |
| D | 0 | 126 | 0 |
| Mode M0 | |||
|---|---|---|---|
| Quadrant | BADHDUFLAG | Total packets | Discarded packets |
| A | 0 | 18569 | 1 |
| B | 0 | 19879 | 1 |
| C | 0 | 12944 | 1 |
| D | 0 | 14546 | 1 |
| Quadrant | Total seconds | Saturated seconds | Saturation percentage |
|---|---|---|---|
| A | 6180 | 156 | 2.524272% |
| B | 6180 | 838 | 13.559871% |
| C | 6181 | 52 | 0.841288% |
| D | 6181 | 126 | 2.038505% |
Noise dominated data is calculated using 1-second bins in cleaned event files. If a bin has >2000 counts, and if more than 50% of those come from <1% of pixels, then it is considered to be noise-dominated and hence unusable.
| Quadrant | # 1 sec bins | Bins with >0 counts | Bins with >2000 counts | High rate bins dominated by noise | Noise dominated (total time) | Noise dominated (detector-on time) | Marked lightcurve |
|---|---|---|---|---|---|---|---|
| A | 7144 | 6180 | 73 | 73 | 1.02% | 1.18% | 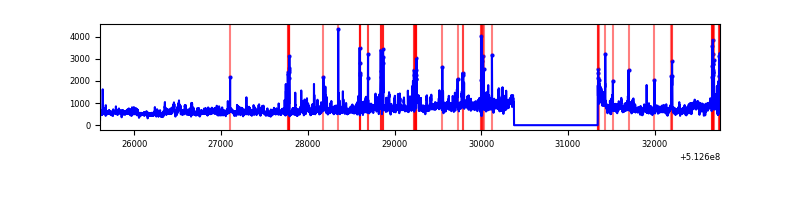 |
| B | 7145 | 6181 | 557 | 557 | 7.80% | 9.01% | 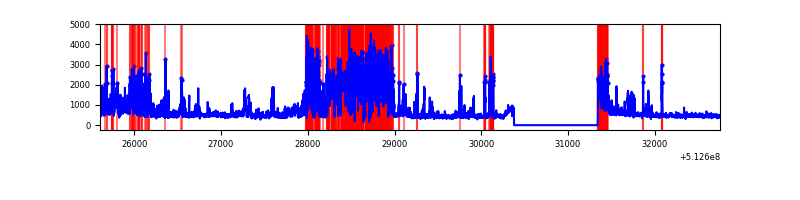 |
| C | 7146 | 6182 | 7 | 7 | 0.10% | 0.11% | 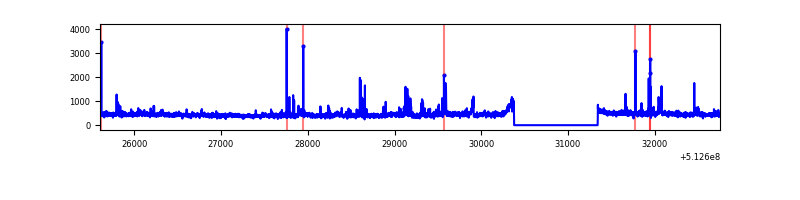 |
| D | 7146 | 6182 | 82 | 82 | 1.15% | 1.33% | 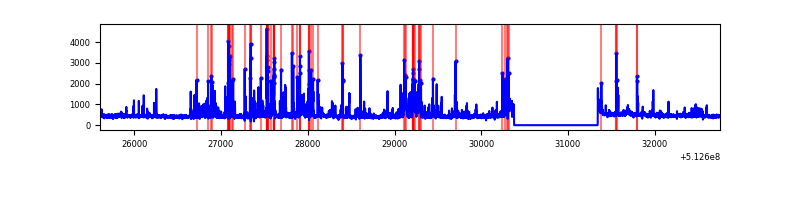 |
Top three noisy pixels from each quadrant. If the there are fewer than three noisy pixels in the level2.evt file, extra rows are filled as -1
| Pixel properties | Quadrant properties | ||||||
|---|---|---|---|---|---|---|---|
| Quadrant | DetID | PixID | Counts | Sigma | Mean | Median | Sigma |
| A | 3 | 14 | 1860737 | 11440.92 | 658 | 641 | 162.6 |
| A | 10 | 251 | 197787 | 1212.59 | 658 | 641 | 162.6 |
| A | 3 | 62 | 104342 | 637.84 | 658 | 641 | 162.6 |
| B | 5 | 185 | 2411311 | 17695.16 | 626 | 602 | 136.2 |
| B | 10 | 16 | 163939 | 1198.93 | 626 | 602 | 136.2 |
| B | 0 | 229 | 59900 | 435.26 | 626 | 602 | 136.2 |
| C | 15 | 230 | 63072 | 352.66 | 653 | 646 | 177.0 |
| C | 13 | 3 | 57424 | 320.75 | 653 | 646 | 177.0 |
| C | 14 | 254 | 47494 | 264.65 | 653 | 646 | 177.0 |
| D | 8 | 240 | 473799 | 2620.38 | 643 | 615 | 180.6 |
| D | 2 | 249 | 268322 | 1482.5 | 643 | 615 | 180.6 |
| D | 5 | 173 | 48446 | 264.88 | 643 | 615 | 180.6 |
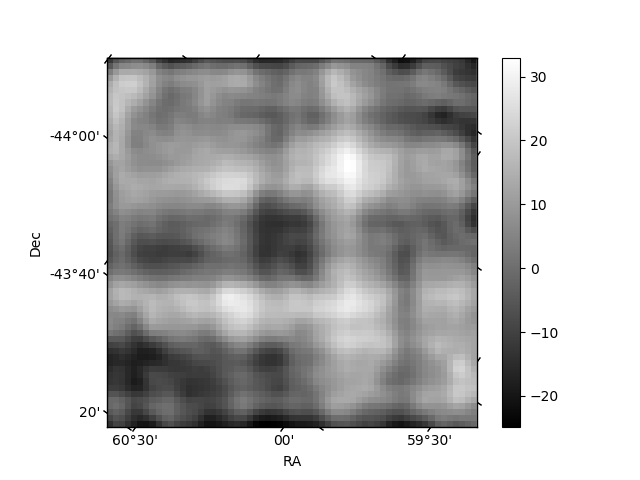
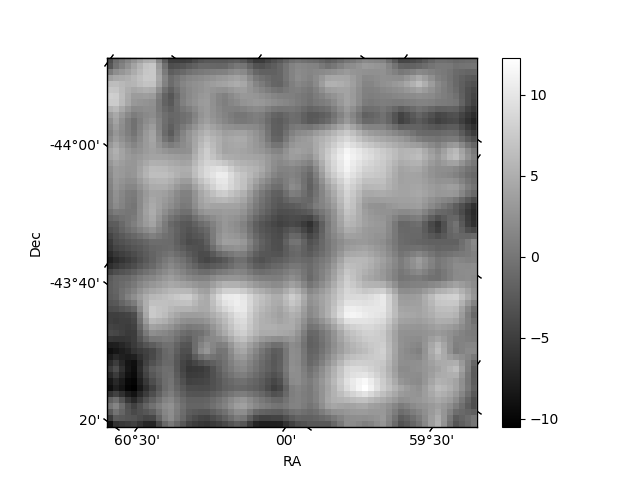
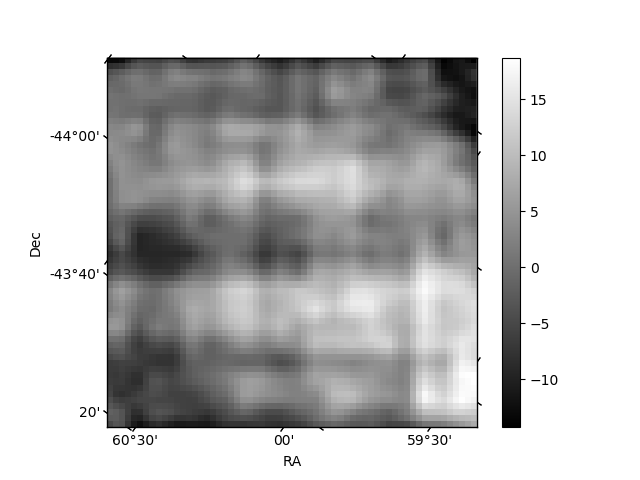
Histogram calculated using DETX and DETY for each event in the final _common_clean file
| Quadrant A | 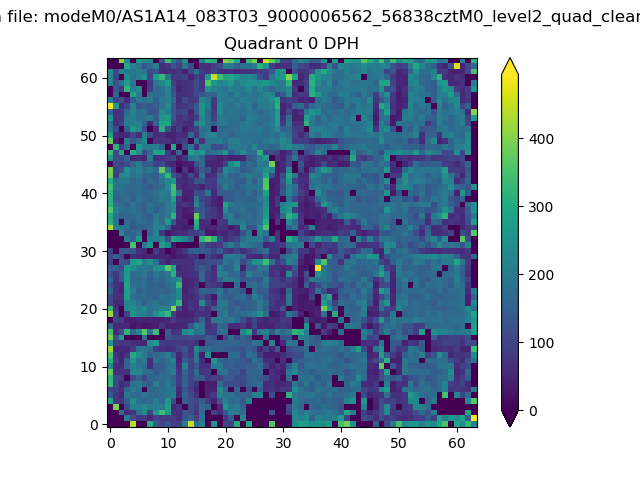 |
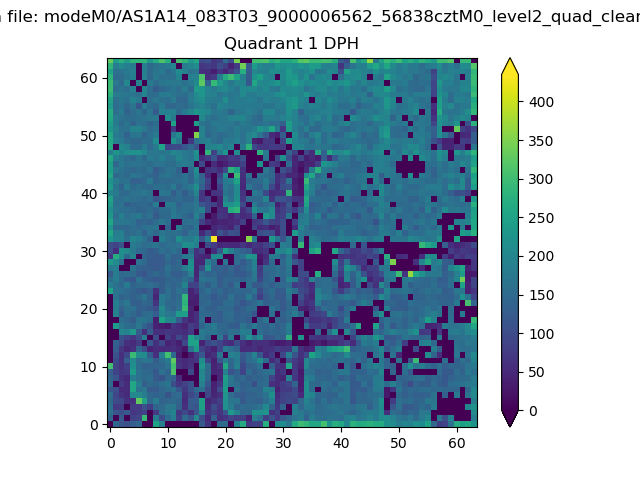 |
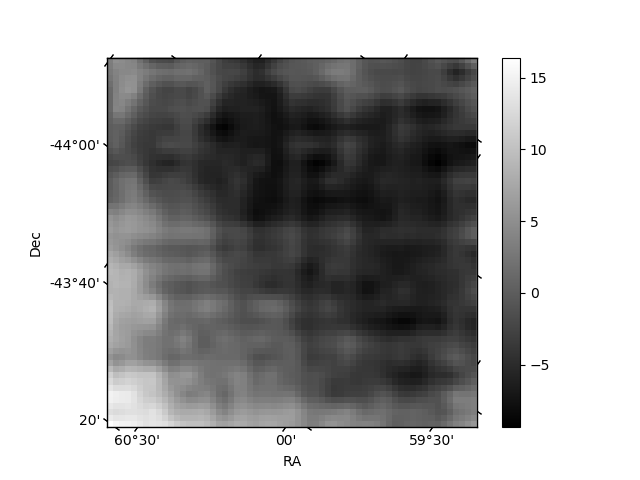
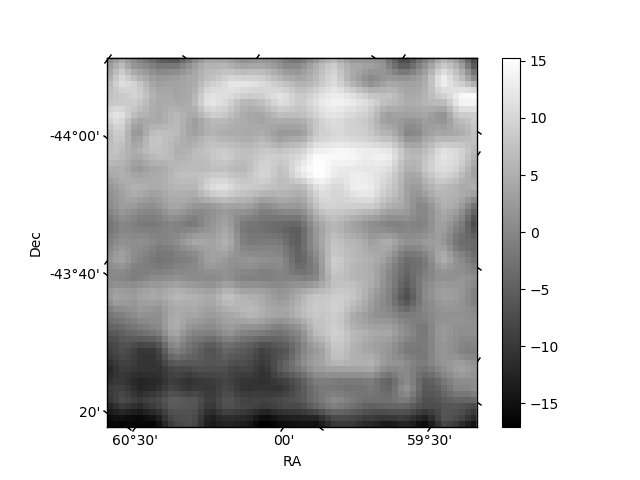
Quadrant B |
|---|---|---|---|
| Quadrant D | 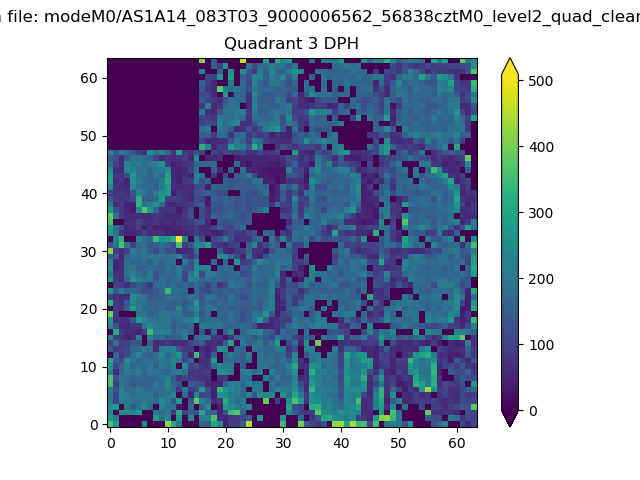 |
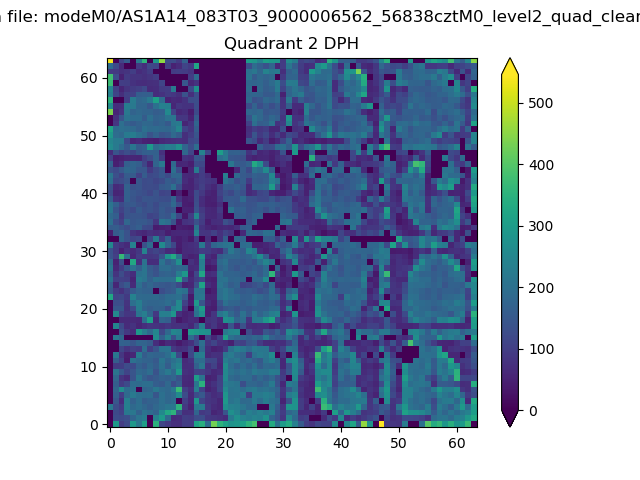 |
Quadrant C |
| Plot type | Count rate plots | Images |
|---|---|---|
| Comparison with Poisson distribution Blue bars denote a histogram of data divided into 1 sec bins. Red curve is a Poisson curve with rate = median count rate of data. |
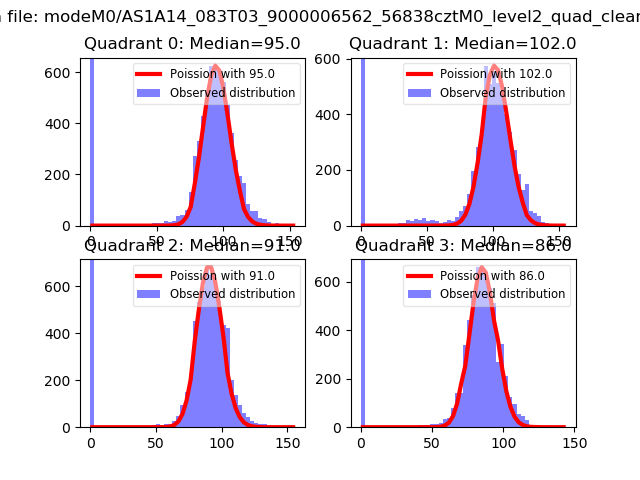 |
 |
| Quadrant-wise count rates Data is divided into 100 sec bins |
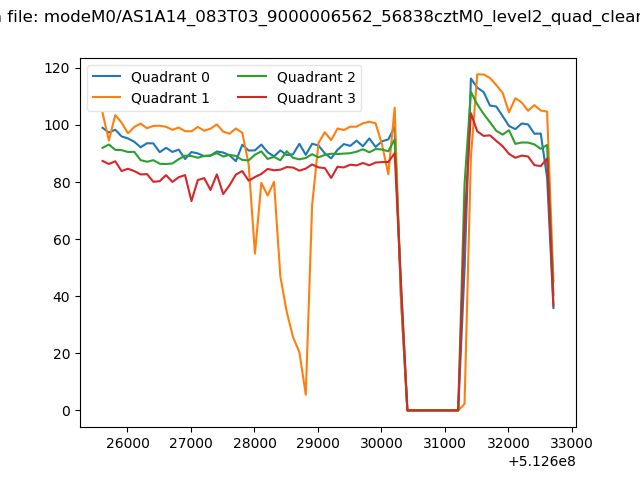 |
|
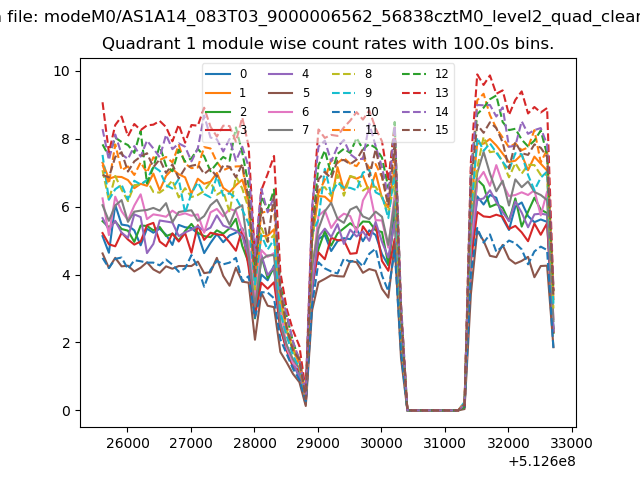
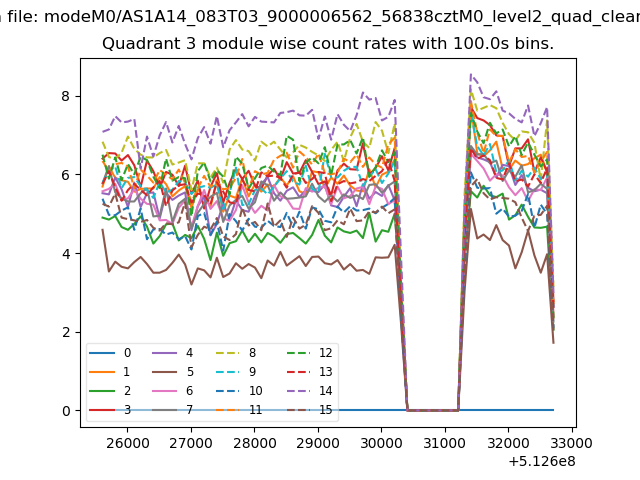
| Module-wise count rates for Quadrant A Data is divided into 100 sec bins |
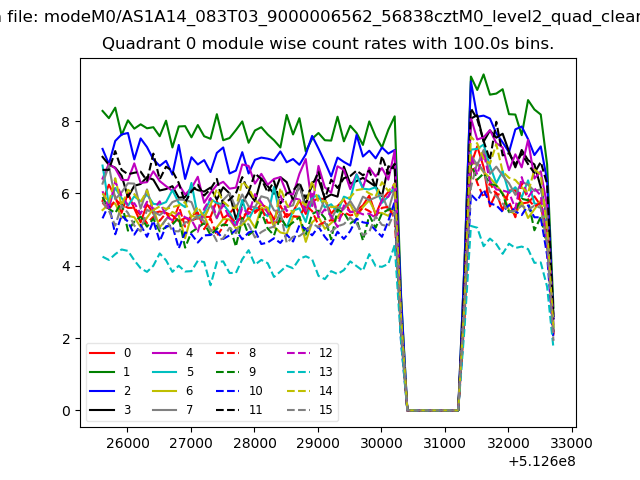 |
 |
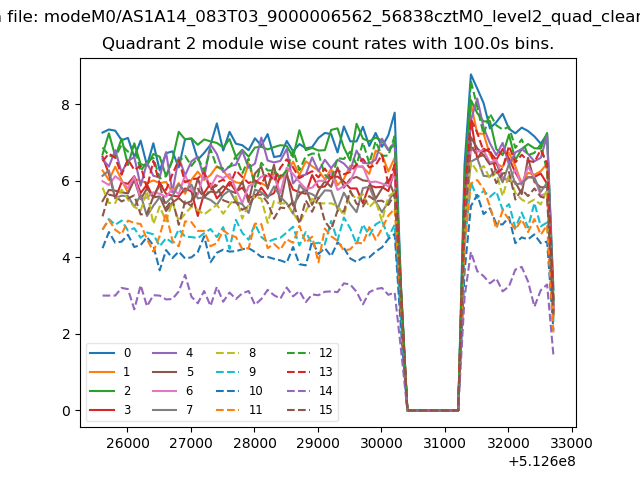
| Module-wise count rates for Quadrant B Data is divided into 100 sec bins |
 |
 |
| Module-wise count rates for Quadrant C Data is divided into 100 sec bins |
 |
 |
| Module-wise count rates for Quadrant D Data is divided into 100 sec bins |
 |
 |
| Parameter | Plot |
|---|---|
| CZT HV Monitor | 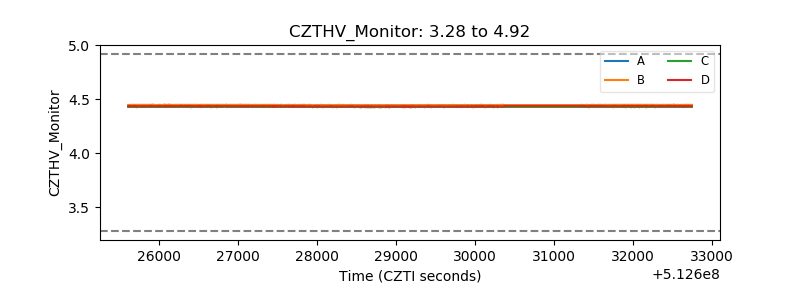 |
| D_VDD | 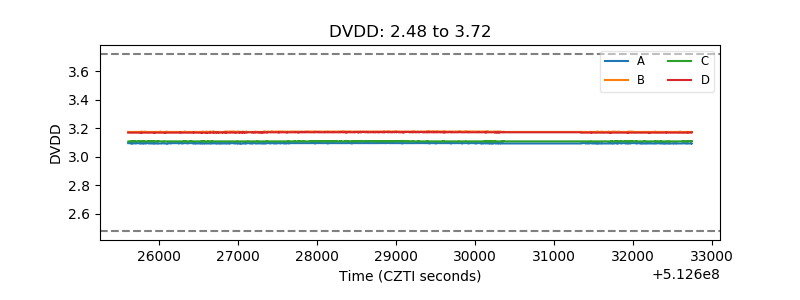 |
| Temperature 1 | 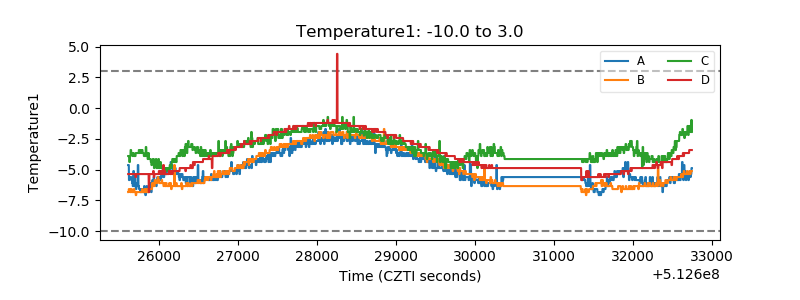 |
| Veto HV Monitor | 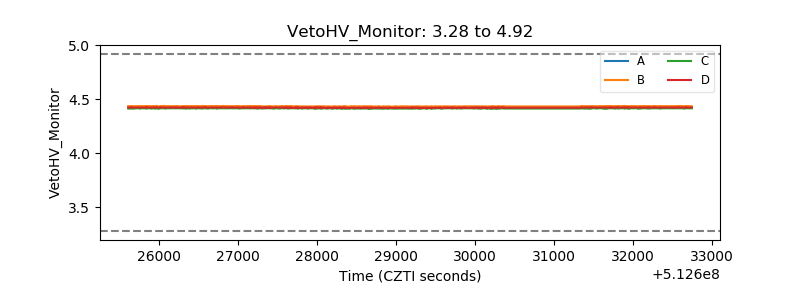 |
| Veto LLD | 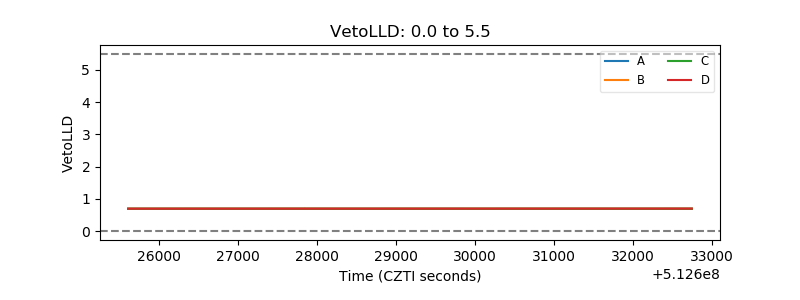 |
| Alpha Counter | 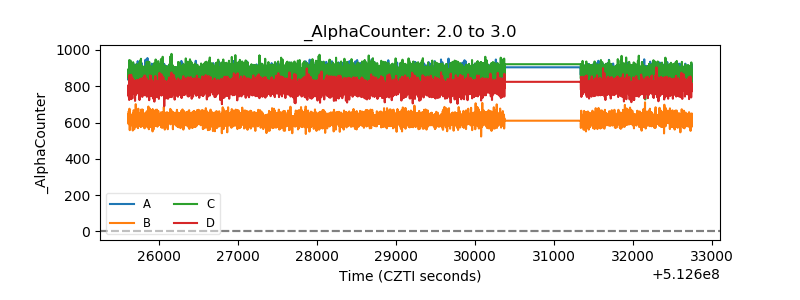 |
| _CPM_Rate | 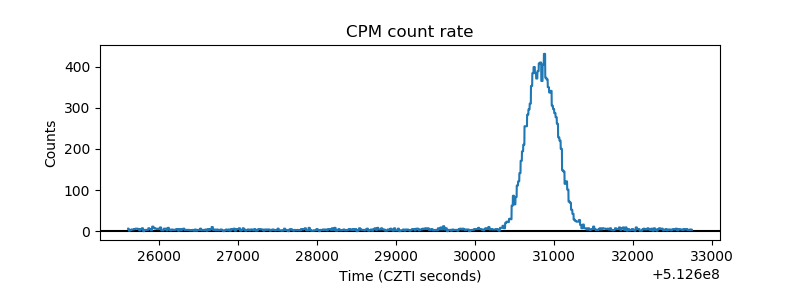 |
| CZT Counter | 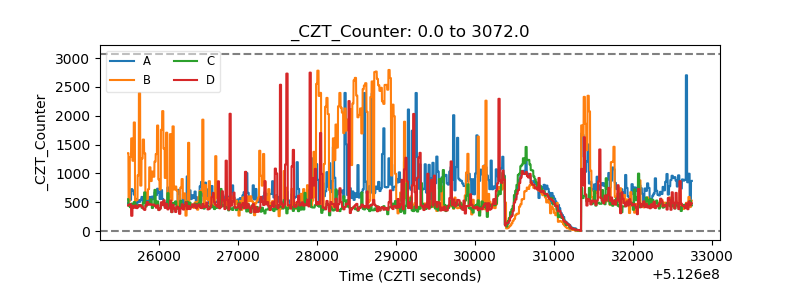 |
| +2.5 Volts monitor |  |
| +5 Volts monitor |  |
| _ROLL_ROT | 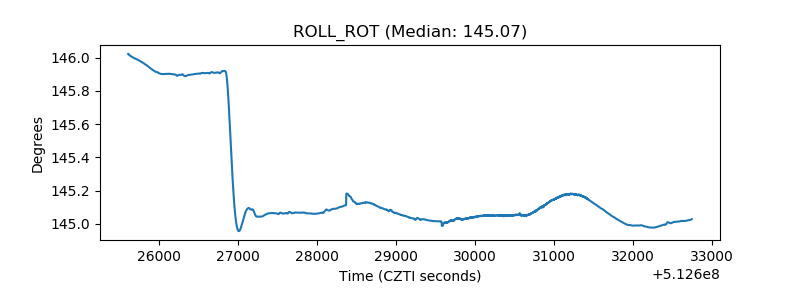 |
| _Roll_DEC | 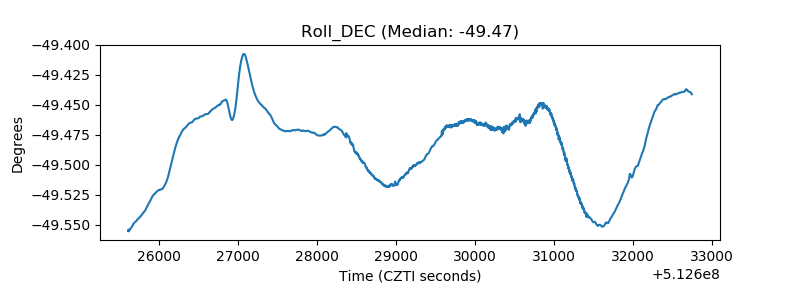 |
| _Roll_RA | 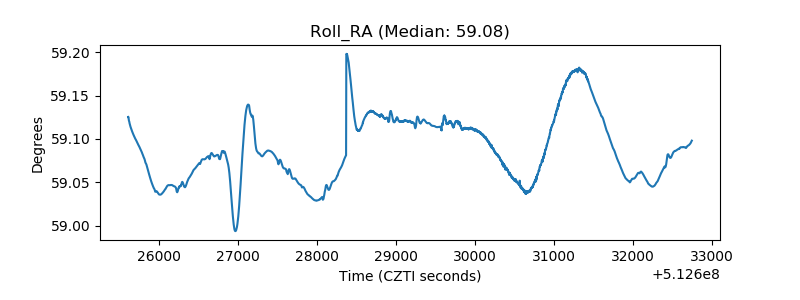 |
| Veto Counter | 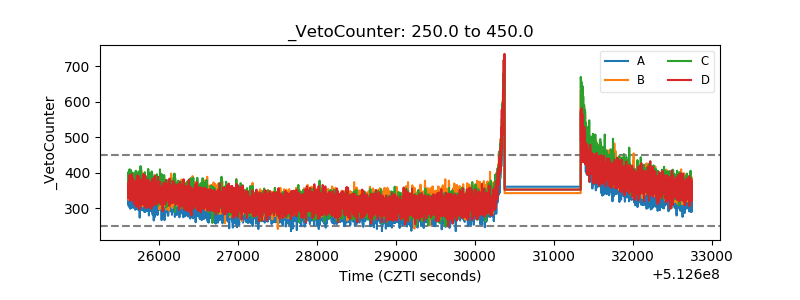 |