| Param | Original file | Final file |
|---|---|---|
| Filename | modeM0/AS1A14_083T03_9000006562_56839cztM0_level2.fits | modeM0/AS1A14_083T03_9000006562_56839cztM0_level2_quad_clean.evt |
| Size (bytes) | 616,677,120 | 90,118,080 |
| Size | 588.1 MB | 85.9 MB |
| Events in quadrant A | 6,548,633 | 619,882 |
| Events in quadrant B | 4,413,797 | 657,956 |
| Events in quadrant C | 7,633,673 | 434,622 |
| Events in quadrant D | 3,733,293 | 568,017 |
| Mode M9 | |||
|---|---|---|---|
| Quadrant | BADHDUFLAG | Total packets | Discarded packets |
| A | 0 | 11 | 0 |
| B | 0 | 11 | 0 |
| C | 0 | 11 | 0 |
| D | 0 | 11 | 0 |
| Mode SS | |||
|---|---|---|---|
| Quadrant | BADHDUFLAG | Total packets | Discarded packets |
| A | 0 | 130 | 0 |
| B | 0 | 130 | 0 |
| C | 0 | 130 | 0 |
| D | 0 | 130 | 0 |
| Mode M0 | |||
|---|---|---|---|
| Quadrant | BADHDUFLAG | Total packets | Discarded packets |
| A | 0 | 24013 | 1 |
| B | 0 | 17334 | 1 |
| C | 0 | 27162 | 1 |
| D | 0 | 15523 | 1 |
| Quadrant | Total seconds | Saturated seconds | Saturation percentage |
|---|---|---|---|
| A | 6426 | 293 | 4.559602% |
| B | 6426 | 359 | 5.586679% |
| C | 6427 | 1913 | 29.765054% |
| D | 6427 | 160 | 2.489497% |
Noise dominated data is calculated using 1-second bins in cleaned event files. If a bin has >2000 counts, and if more than 50% of those come from <1% of pixels, then it is considered to be noise-dominated and hence unusable.
| Quadrant | # 1 sec bins | Bins with >0 counts | Bins with >2000 counts | High rate bins dominated by noise | Noise dominated (total time) | Noise dominated (detector-on time) | Marked lightcurve |
|---|---|---|---|---|---|---|---|
| A | 7506 | 6427 | 176 | 176 | 2.34% | 2.74% | 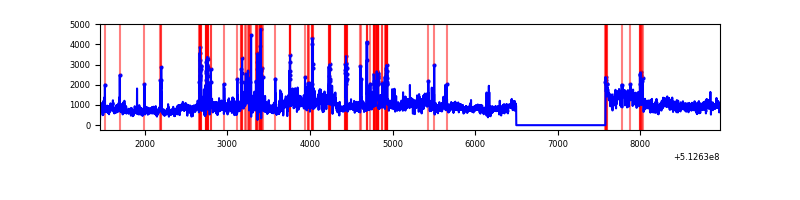 |
| B | 7506 | 6427 | 212 | 212 | 2.82% | 3.30% | 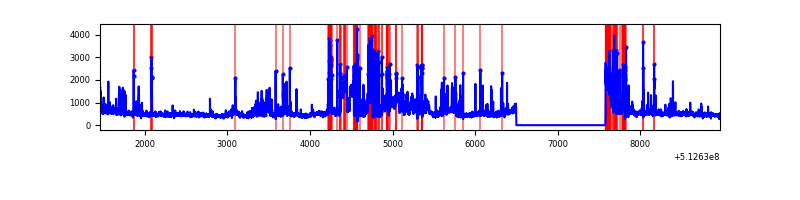 |
| C | 7507 | 6427 | 1740 | 1740 | 23.18% | 27.07% | 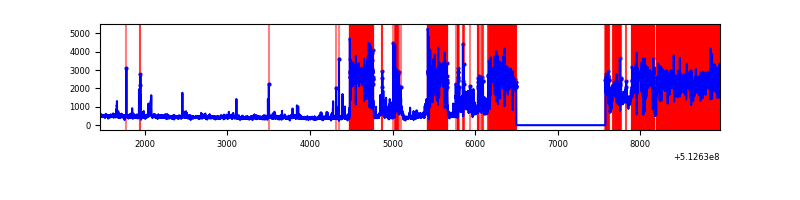 |
| D | 7507 | 6428 | 118 | 118 | 1.57% | 1.84% | 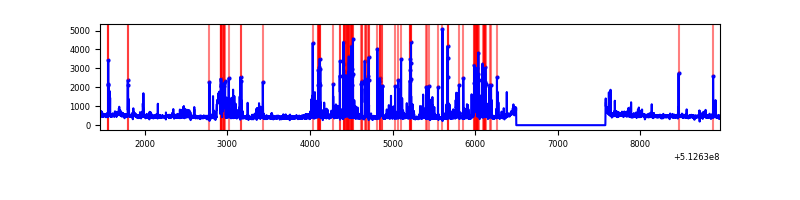 |
Top three noisy pixels from each quadrant. If the there are fewer than three noisy pixels in the level2.evt file, extra rows are filled as -1
| Pixel properties | Quadrant properties | ||||||
|---|---|---|---|---|---|---|---|
| Quadrant | DetID | PixID | Counts | Sigma | Mean | Median | Sigma |
| A | 3 | 14 | 3086631 | 17962.78 | 698 | 681 | 171.8 |
| A | 10 | 251 | 416453 | 2420.14 | 698 | 681 | 171.8 |
| A | 12 | 3 | 165435 | 959.0 | 698 | 681 | 171.8 |
| B | 5 | 185 | 933118 | 6356.75 | 683 | 658 | 146.7 |
| B | 10 | 16 | 251238 | 1708.25 | 683 | 658 | 146.7 |
| B | 0 | 197 | 160920 | 1092.54 | 683 | 658 | 146.7 |
| C | 12 | 249 | 5085627 | 30964.24 | 597 | 591 | 164.2 |
| C | 12 | 252 | 59015 | 355.76 | 597 | 591 | 164.2 |
| C | 6 | 13 | 34001 | 203.44 | 597 | 591 | 164.2 |
| D | 8 | 240 | 631709 | 3310.67 | 684 | 654 | 190.6 |
| D | 2 | 249 | 238088 | 1245.64 | 684 | 654 | 190.6 |
| D | 5 | 173 | 51784 | 268.24 | 684 | 654 | 190.6 |
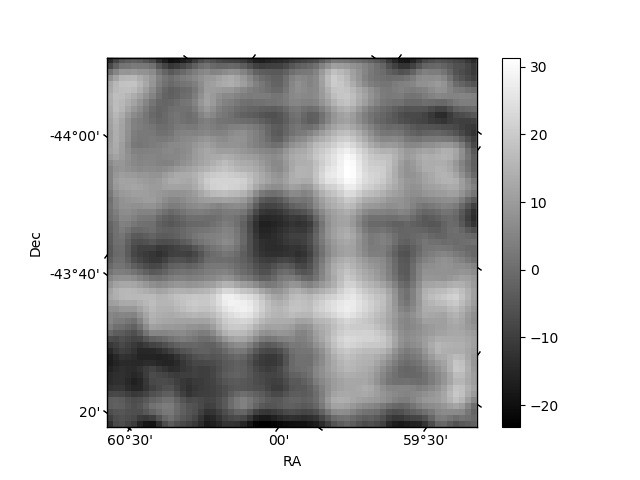
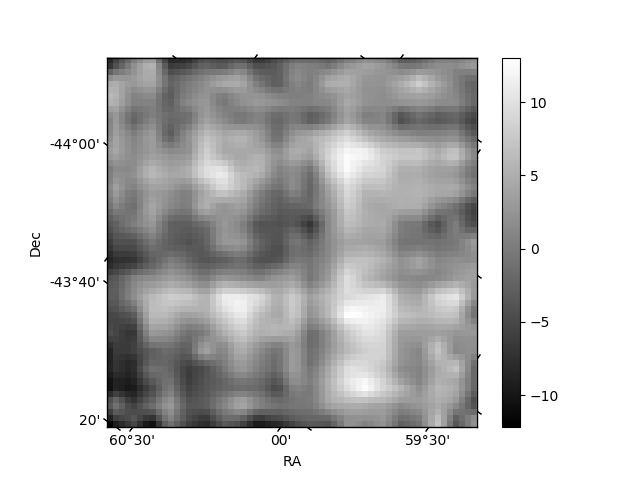
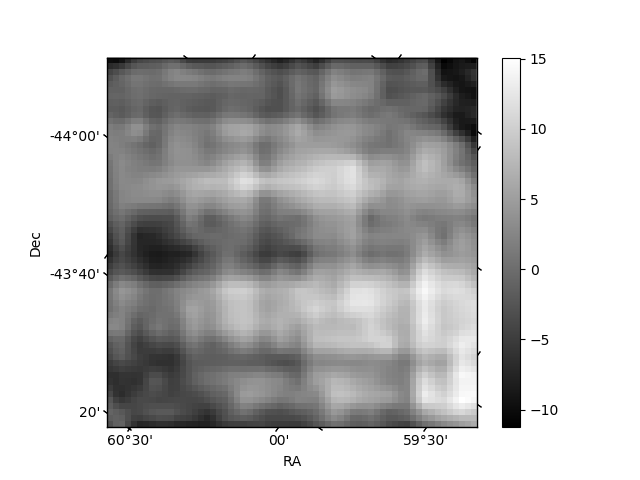
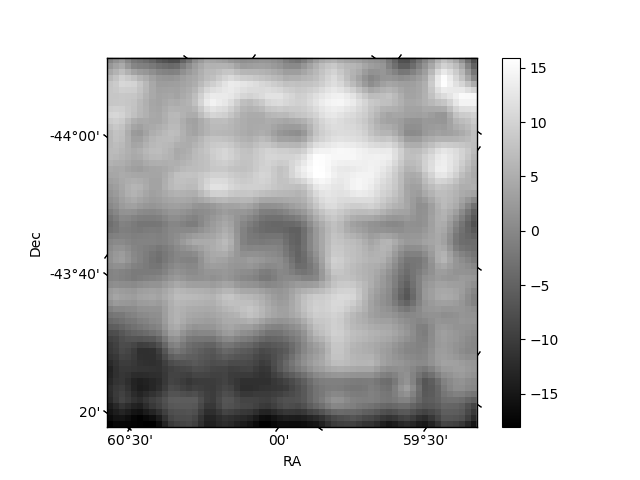
Histogram calculated using DETX and DETY for each event in the final _common_clean file
| Quadrant A | 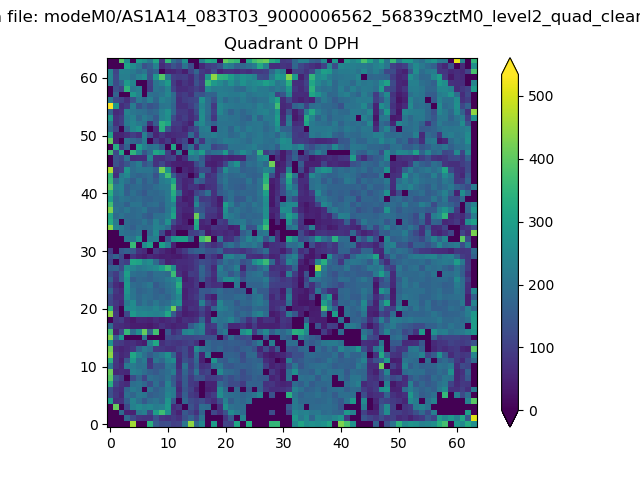 |
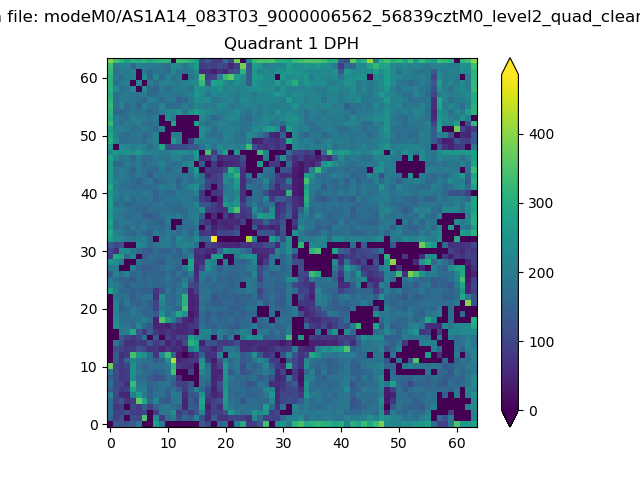 |
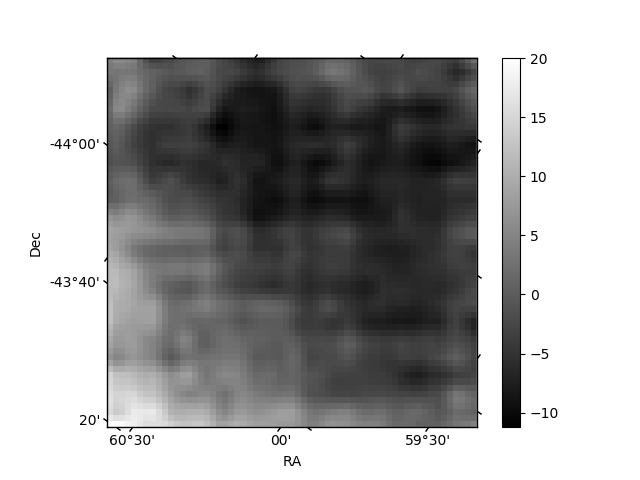
Quadrant B |
|---|---|---|---|
| Quadrant D | 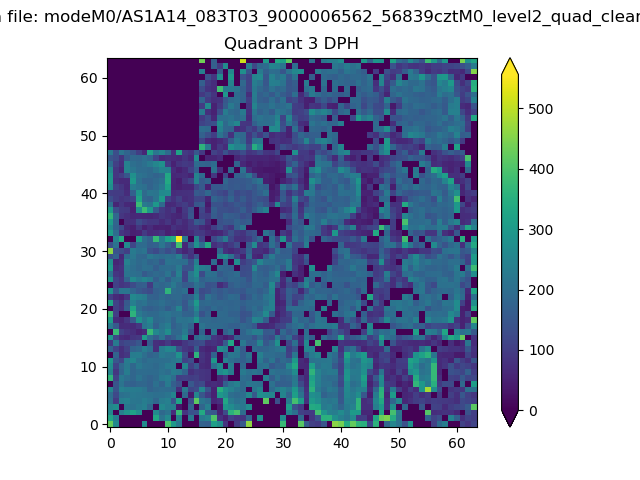 |
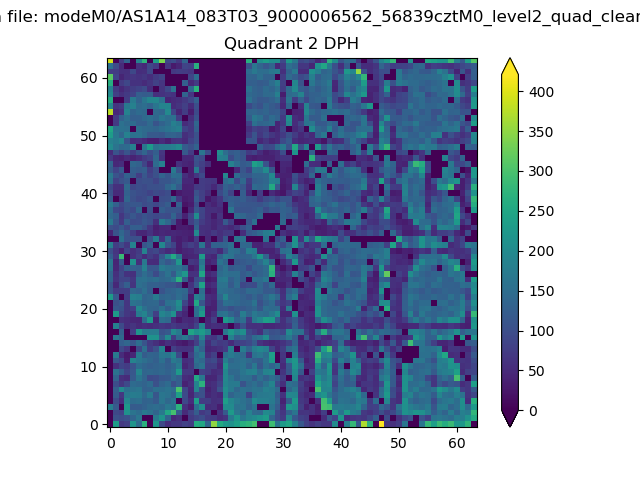 |
Quadrant C |
| Plot type | Count rate plots | Images |
|---|---|---|
| Comparison with Poisson distribution Blue bars denote a histogram of data divided into 1 sec bins. Red curve is a Poisson curve with rate = median count rate of data. |
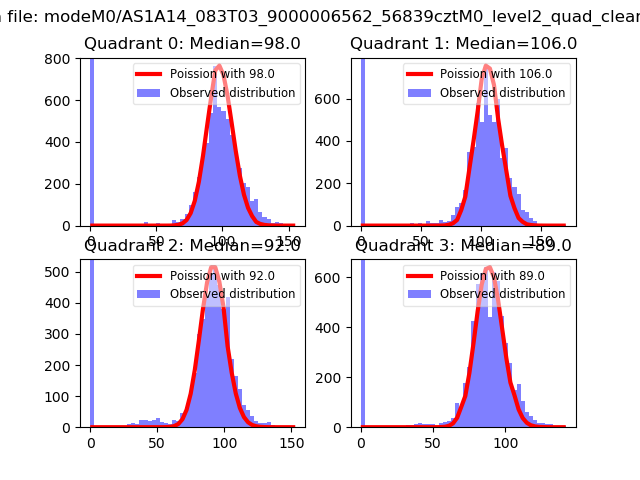 |
 |
| Quadrant-wise count rates Data is divided into 100 sec bins |
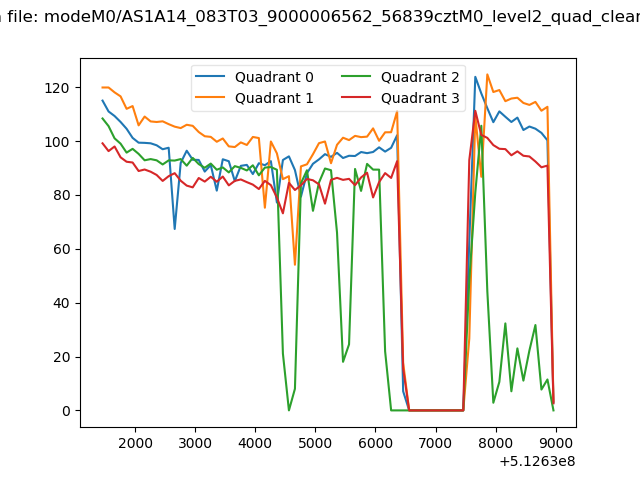 |
|
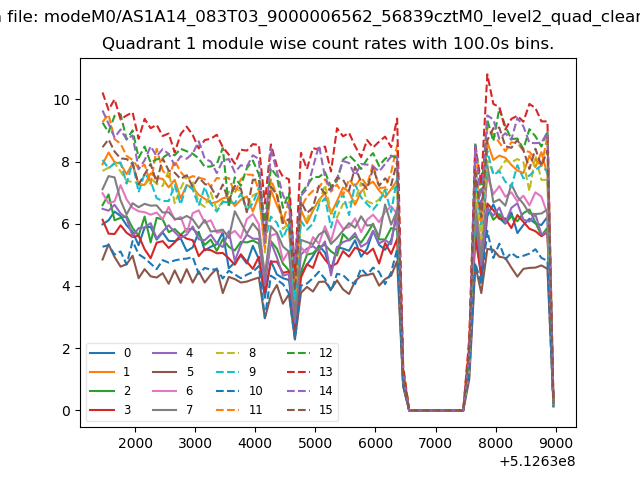
| Module-wise count rates for Quadrant A Data is divided into 100 sec bins |
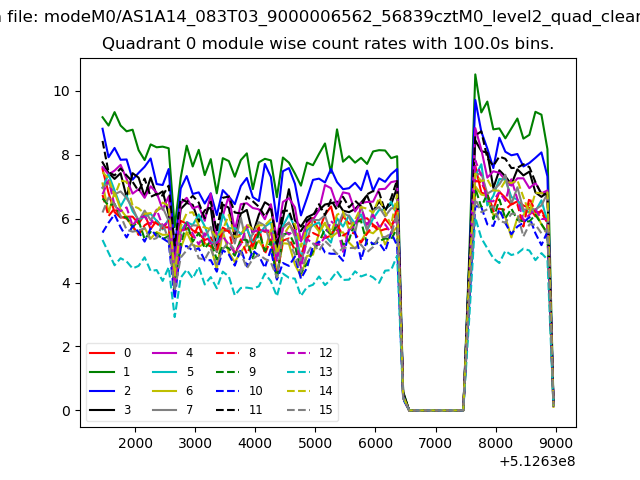 |
 |
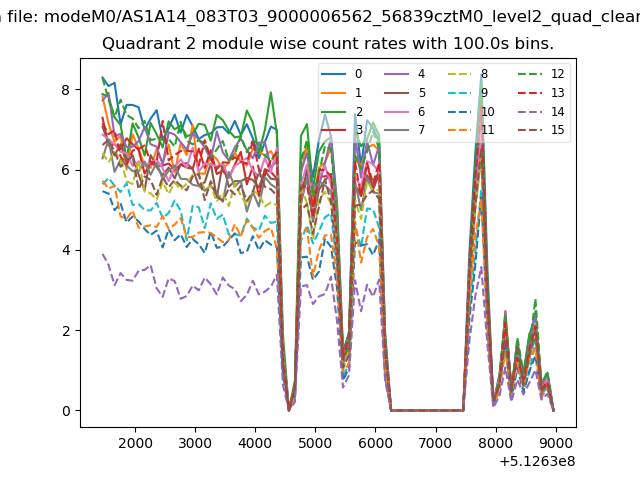
| Module-wise count rates for Quadrant B Data is divided into 100 sec bins |
 |
 |
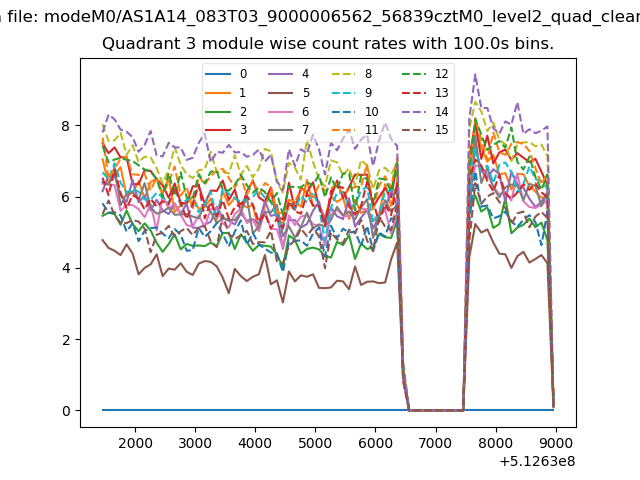
| Module-wise count rates for Quadrant C Data is divided into 100 sec bins |
 |
 |
| Module-wise count rates for Quadrant D Data is divided into 100 sec bins |
 |
 |
| Parameter | Plot |
|---|---|
| CZT HV Monitor | 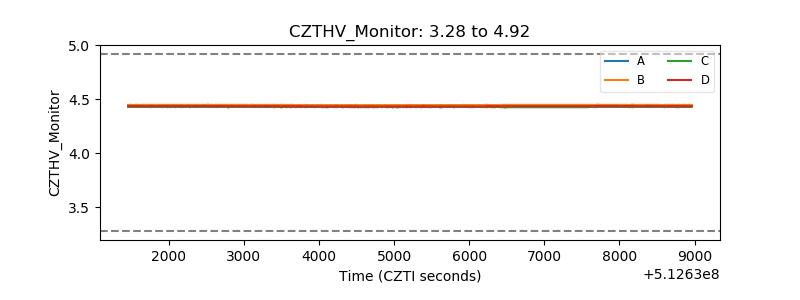 |
| D_VDD | 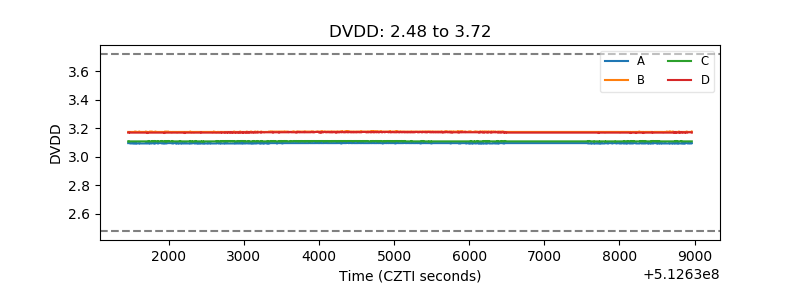 |
| Temperature 1 | 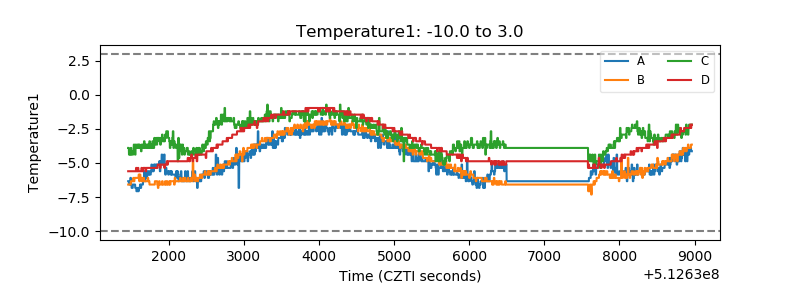 |
| Veto HV Monitor | 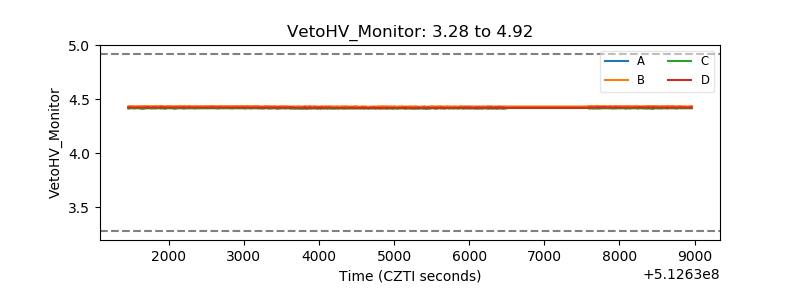 |
| Veto LLD | 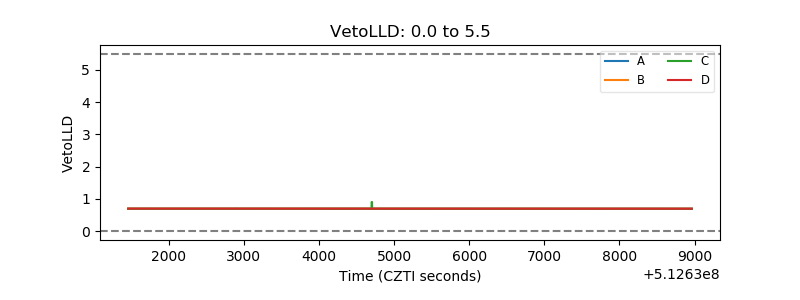 |
| Alpha Counter | 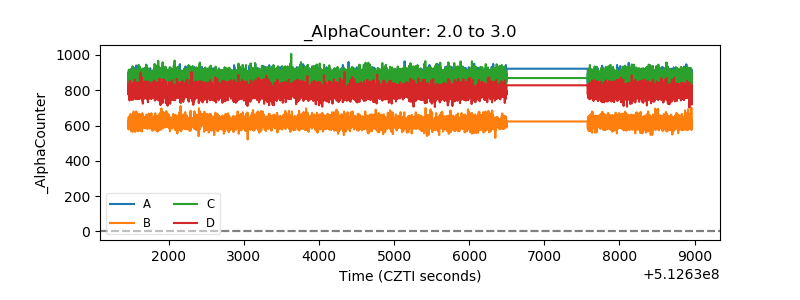 |
| _CPM_Rate | 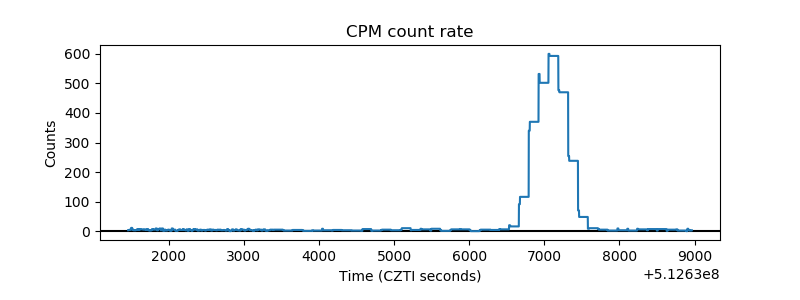 |
| CZT Counter | 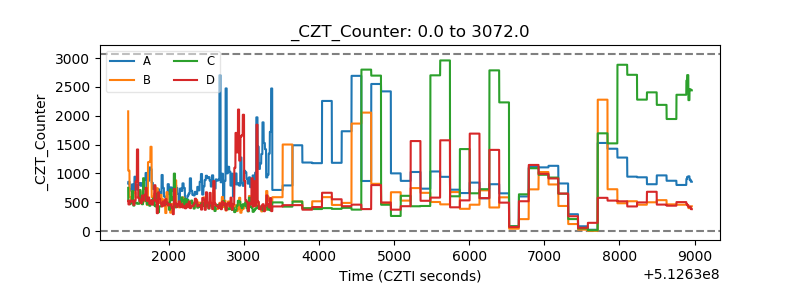 |
| +2.5 Volts monitor | 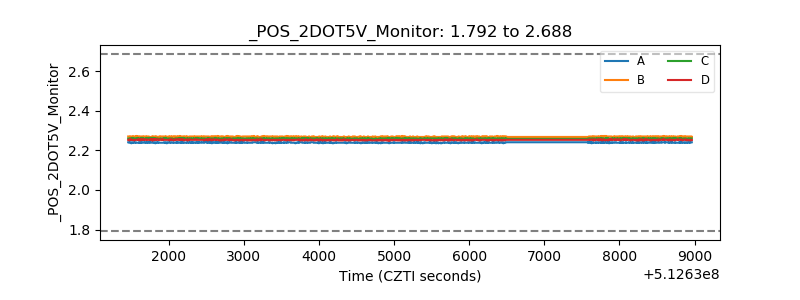 |
| +5 Volts monitor | 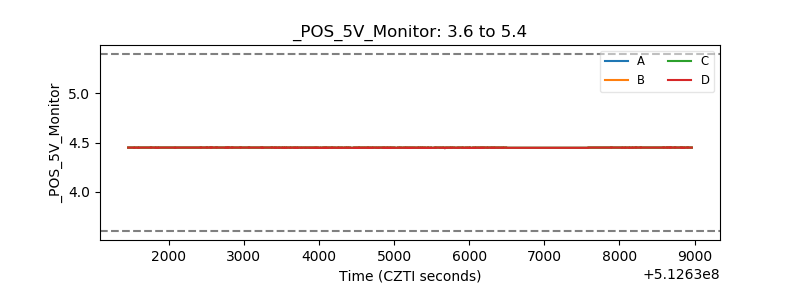 |
| _ROLL_ROT | 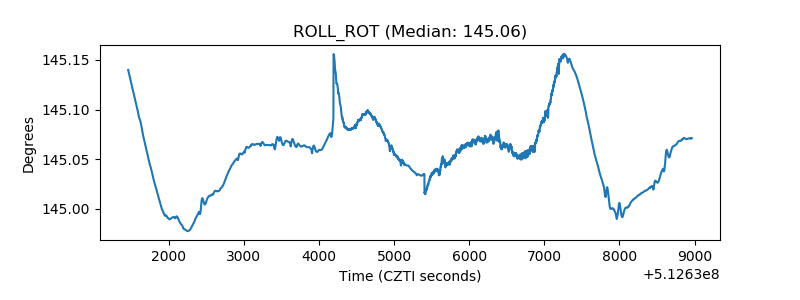 |
| _Roll_DEC | 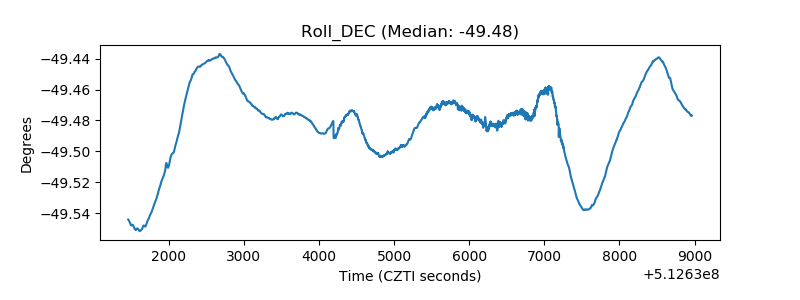 |
| _Roll_RA | 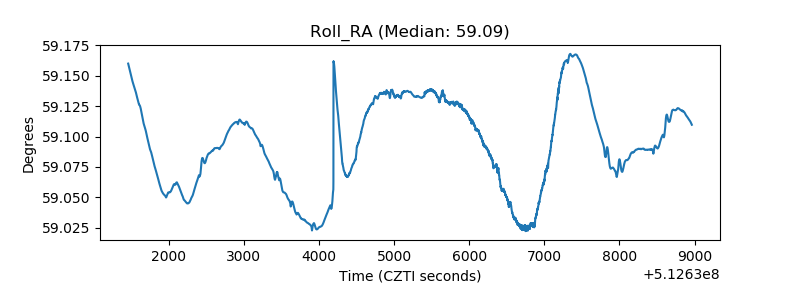 |
| Veto Counter | 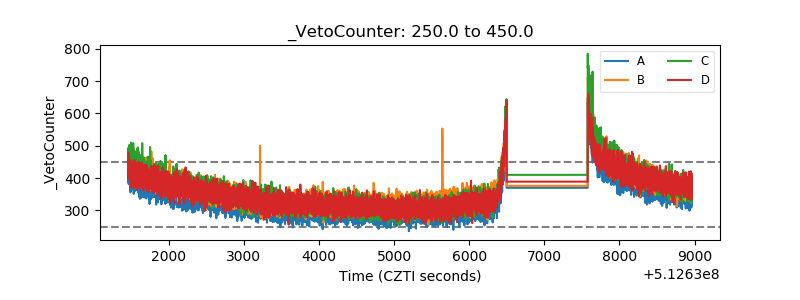 |