| Param | Original file | Final file |
|---|---|---|
| Filename | modeM0/AS1A14_083T03_9000006562_56841cztM0_level2.fits | modeM0/AS1A14_083T03_9000006562_56841cztM0_level2_quad_clean.evt |
| Size (bytes) | 483,292,800 | 88,784,640 |
| Size | 460.9 MB | 84.7 MB |
| Events in quadrant A | 3,771,339 | 598,953 |
| Events in quadrant B | 3,499,874 | 638,870 |
| Events in quadrant C | 5,551,608 | 501,555 |
| Events in quadrant D | 4,591,064 | 521,813 |
| Mode M9 | |||
|---|---|---|---|
| Quadrant | BADHDUFLAG | Total packets | Discarded packets |
| A | 0 | 11 | 0 |
| B | 0 | 11 | 0 |
| C | 0 | 11 | 0 |
| D | 0 | 11 | 0 |
| Mode SS | |||
|---|---|---|---|
| Quadrant | BADHDUFLAG | Total packets | Discarded packets |
| A | 0 | 124 | 0 |
| B | 0 | 124 | 0 |
| C | 0 | 124 | 0 |
| D | 0 | 124 | 0 |
| Mode M0 | |||
|---|---|---|---|
| Quadrant | BADHDUFLAG | Total packets | Discarded packets |
| A | 0 | 15489 | 1 |
| B | 0 | 14584 | 1 |
| C | 0 | 20802 | 1 |
| D | 0 | 17845 | 1 |
| Quadrant | Total seconds | Saturated seconds | Saturation percentage |
|---|---|---|---|
| A | 6120 | 265 | 4.330065% |
| B | 6120 | 270 | 4.411765% |
| C | 6121 | 956 | 15.618363% |
| D | 6121 | 512 | 8.364646% |
Noise dominated data is calculated using 1-second bins in cleaned event files. If a bin has >2000 counts, and if more than 50% of those come from <1% of pixels, then it is considered to be noise-dominated and hence unusable.
| Quadrant | # 1 sec bins | Bins with >0 counts | Bins with >2000 counts | High rate bins dominated by noise | Noise dominated (total time) | Noise dominated (detector-on time) | Marked lightcurve |
|---|---|---|---|---|---|---|---|
| A | 7260 | 6121 | 195 | 195 | 2.69% | 3.19% | 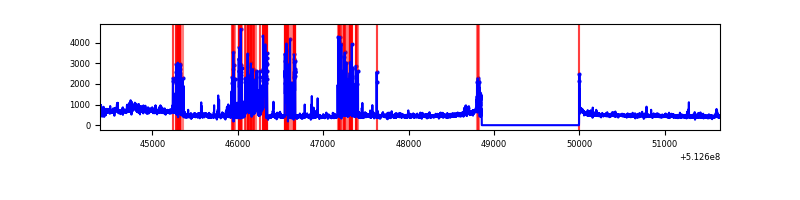 |
| B | 7260 | 6121 | 153 | 153 | 2.11% | 2.50% | 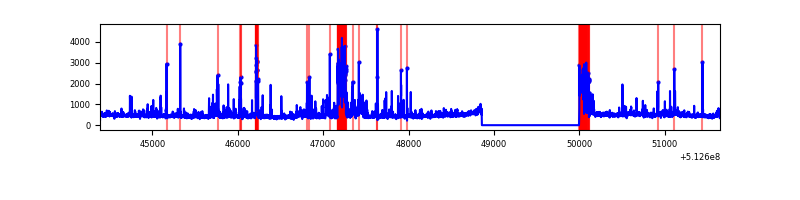 |
| C | 7261 | 6122 | 897 | 897 | 12.35% | 14.65% | 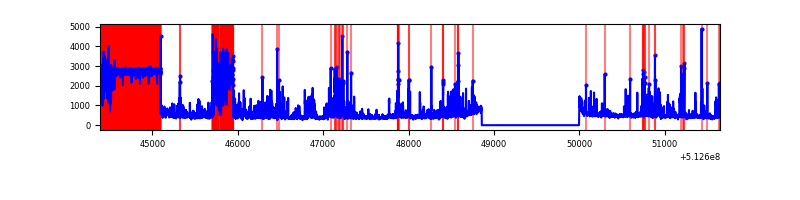 |
| D | 7261 | 6122 | 367 | 367 | 5.05% | 5.99% | 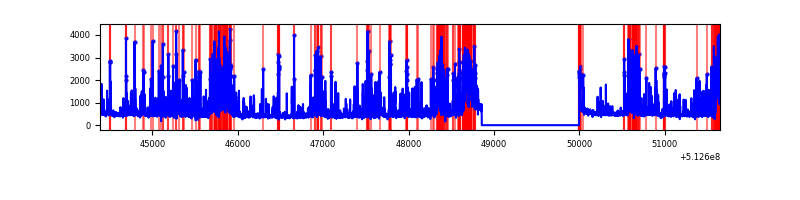 |
Top three noisy pixels from each quadrant. If the there are fewer than three noisy pixels in the level2.evt file, extra rows are filled as -1
| Pixel properties | Quadrant properties | ||||||
|---|---|---|---|---|---|---|---|
| Quadrant | DetID | PixID | Counts | Sigma | Mean | Median | Sigma |
| A | 3 | 14 | 949930 | 5730.9 | 672 | 655 | 165.6 |
| A | 3 | 62 | 143258 | 860.91 | 672 | 655 | 165.6 |
| A | 10 | 251 | 25186 | 148.1 | 672 | 655 | 165.6 |
| B | 5 | 185 | 481851 | 3431.62 | 650 | 628 | 140.2 |
| B | 10 | 16 | 161538 | 1147.46 | 650 | 628 | 140.2 |
| B | 0 | 245 | 57533 | 405.79 | 650 | 628 | 140.2 |
| C | 12 | 249 | 2271806 | 14246.22 | 580 | 573 | 159.4 |
| C | 12 | 252 | 692683 | 4341.23 | 580 | 573 | 159.4 |
| C | 6 | 223 | 198134 | 1239.19 | 580 | 573 | 159.4 |
| D | 8 | 240 | 1462843 | 8185.3 | 634 | 605 | 178.6 |
| D | 2 | 249 | 388638 | 2172.13 | 634 | 605 | 178.6 |
| D | 11 | 224 | 68956 | 382.61 | 634 | 605 | 178.6 |
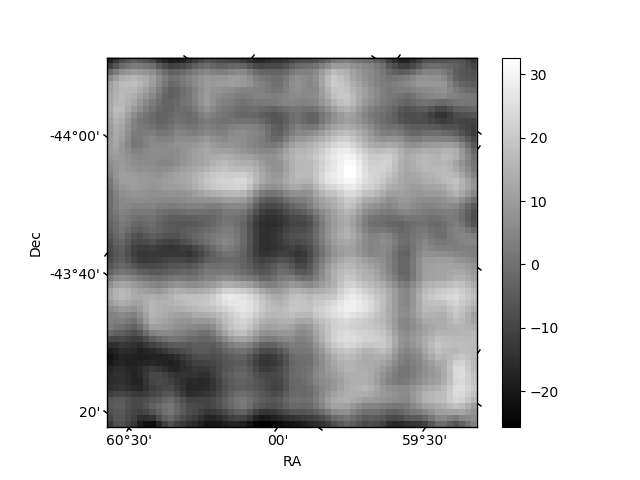
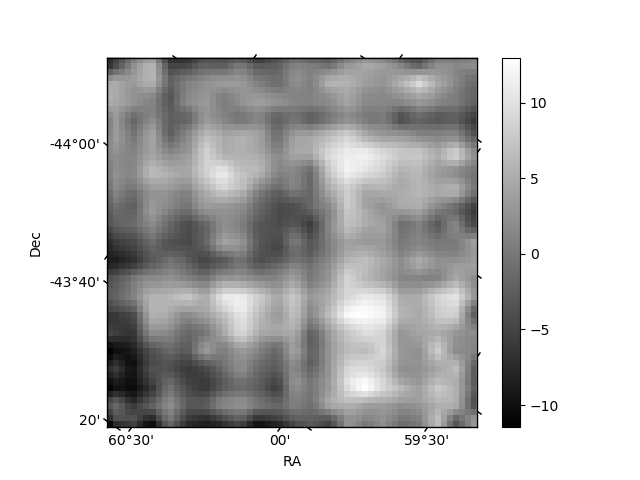
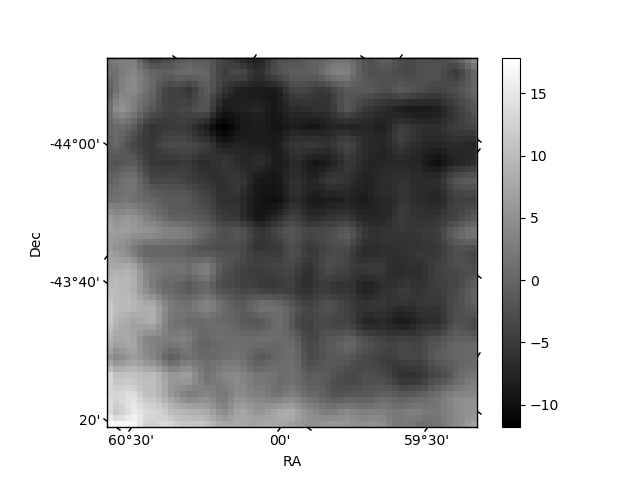
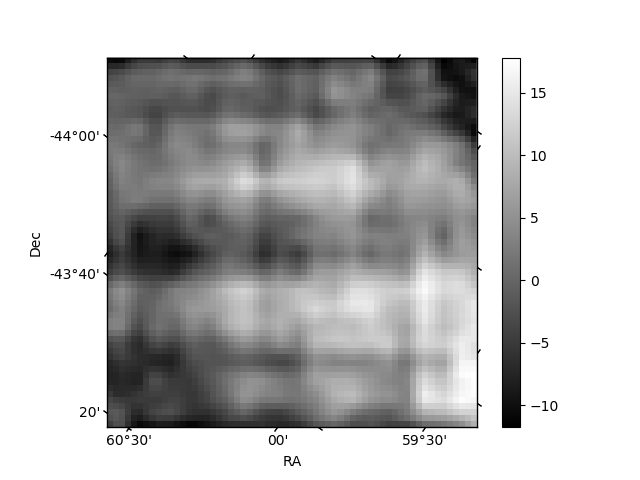
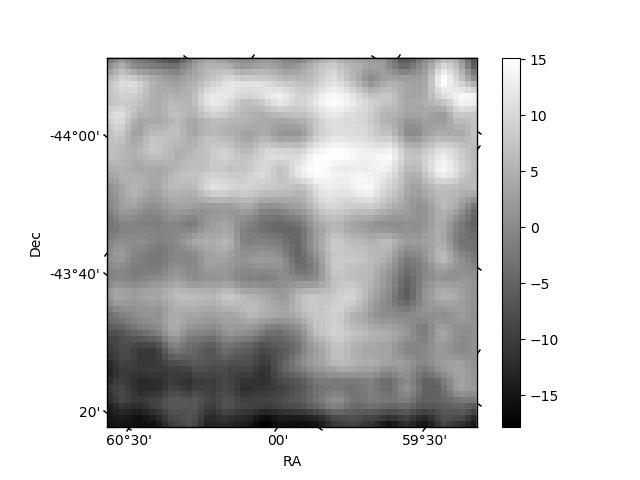
Histogram calculated using DETX and DETY for each event in the final _common_clean file
| Quadrant A | 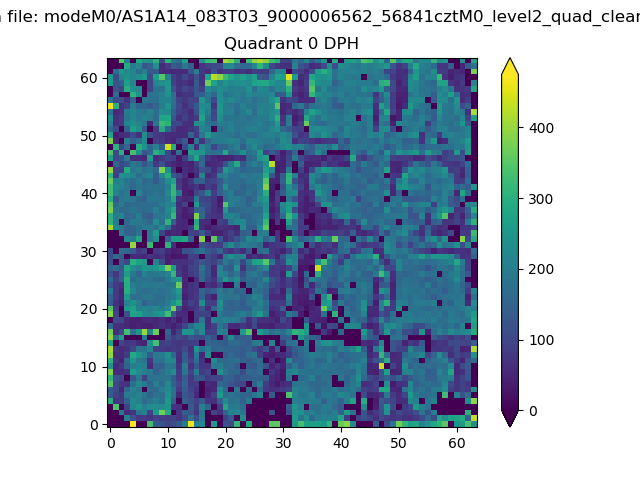 |
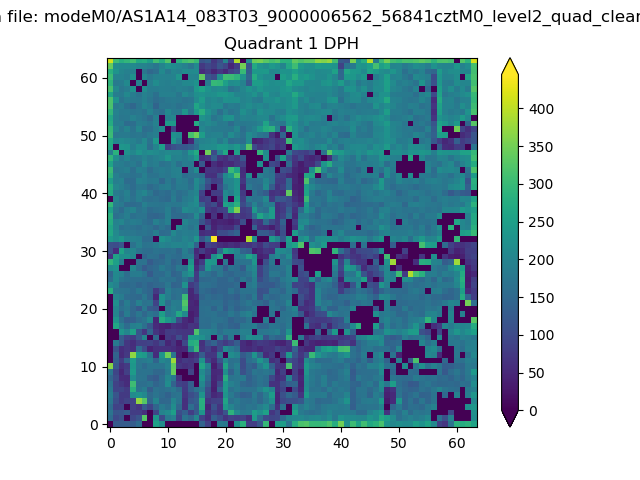 |
Quadrant B |
|---|---|---|---|
| Quadrant D | 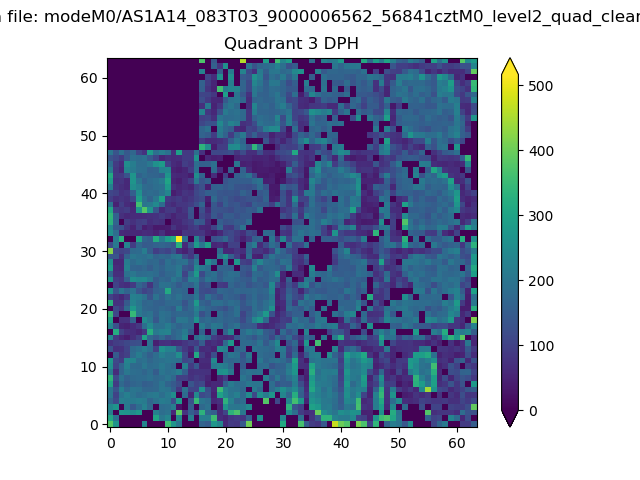 |
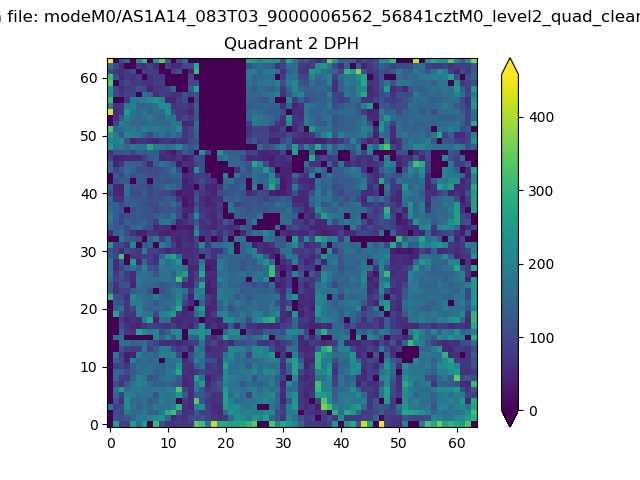 |
Quadrant C |
| Plot type | Count rate plots | Images |
|---|---|---|
| Comparison with Poisson distribution Blue bars denote a histogram of data divided into 1 sec bins. Red curve is a Poisson curve with rate = median count rate of data. |
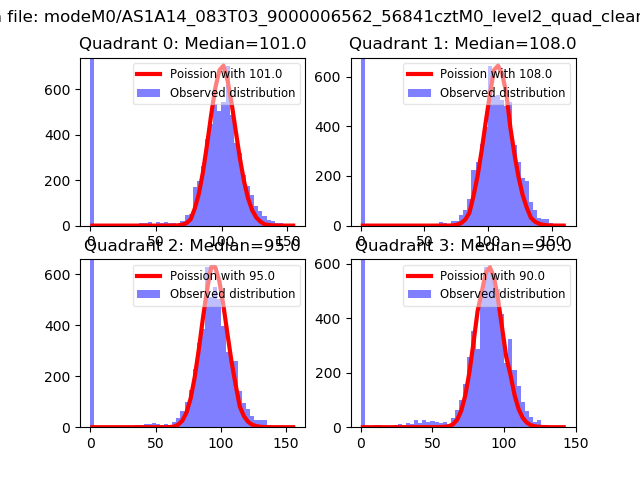 |
 |
| Quadrant-wise count rates Data is divided into 100 sec bins |
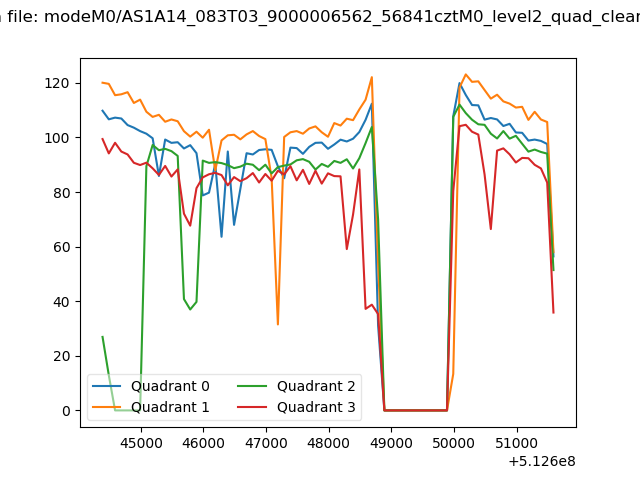 |
|
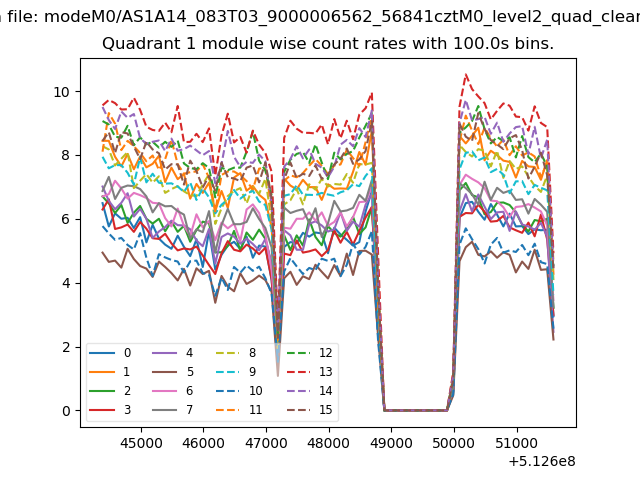
| Module-wise count rates for Quadrant A Data is divided into 100 sec bins |
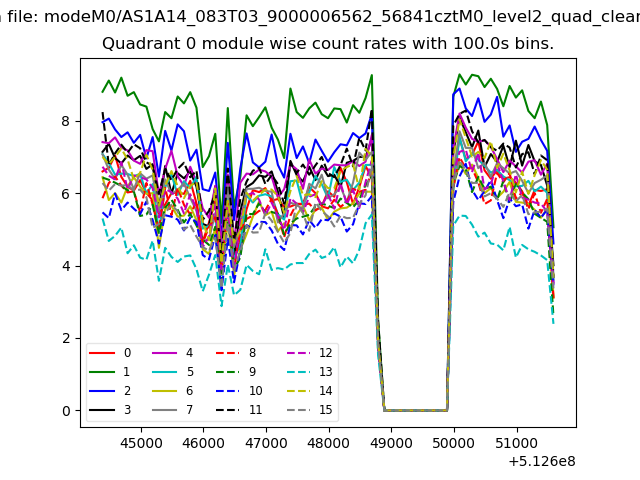 |
 |
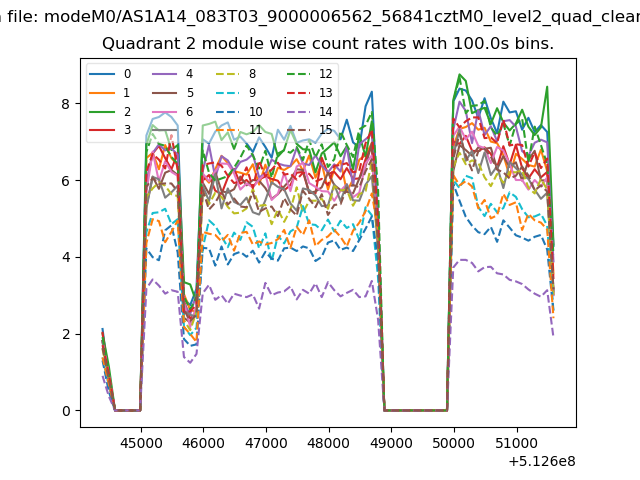
| Module-wise count rates for Quadrant B Data is divided into 100 sec bins |
 |
 |
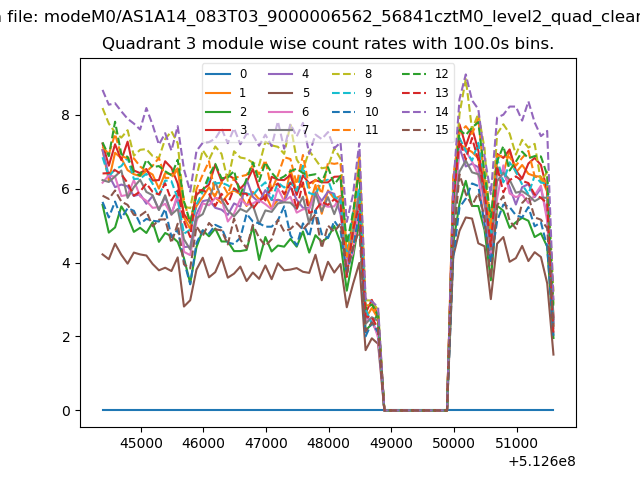
| Module-wise count rates for Quadrant C Data is divided into 100 sec bins |
 |
 |
| Module-wise count rates for Quadrant D Data is divided into 100 sec bins |
 |
 |
| Parameter | Plot |
|---|---|
| CZT HV Monitor | 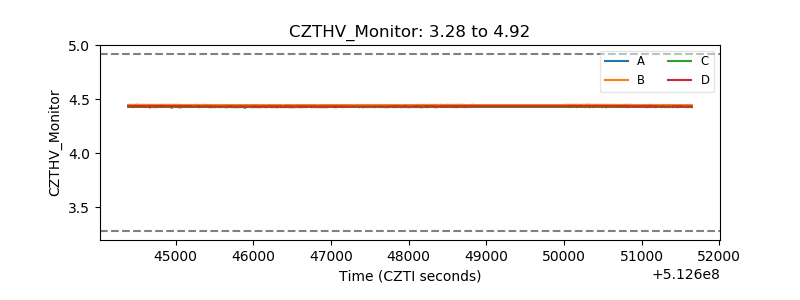 |
| D_VDD | 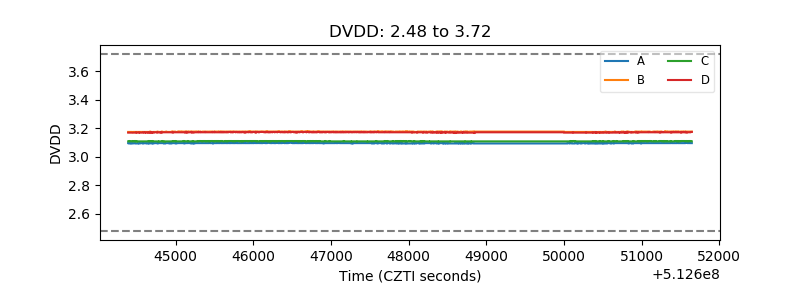 |
| Temperature 1 | 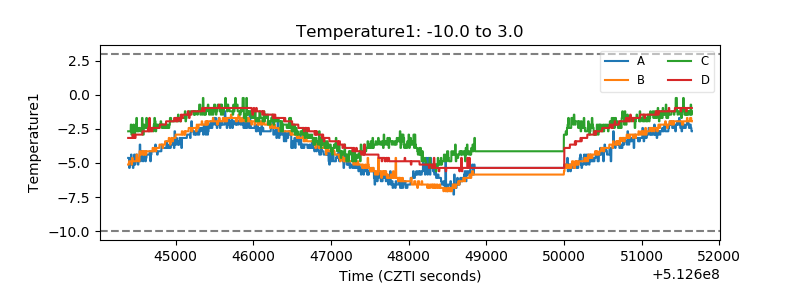 |
| Veto HV Monitor | 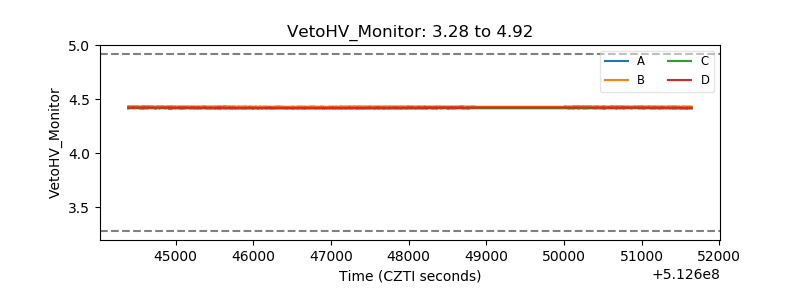 |
| Veto LLD |  |
| Alpha Counter | 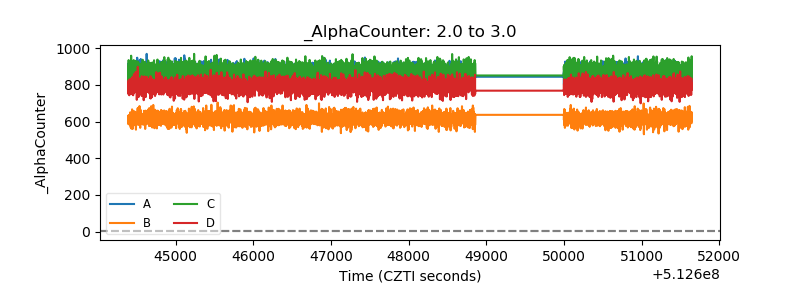 |
| _CPM_Rate | 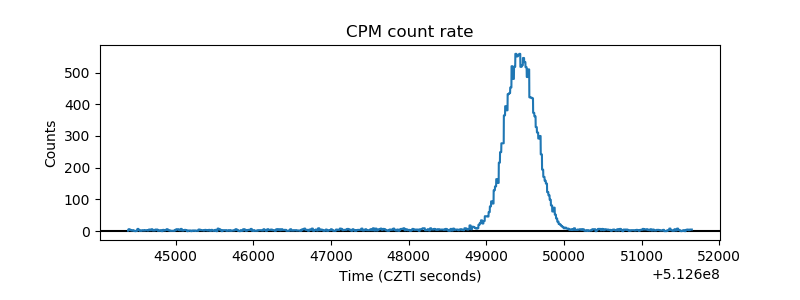 |
| CZT Counter | 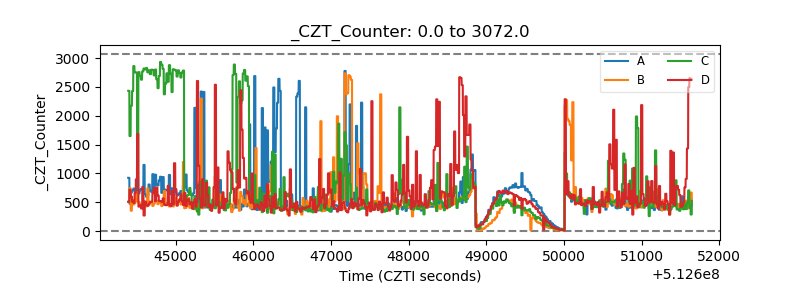 |
| +2.5 Volts monitor |  |
| +5 Volts monitor |  |
| _ROLL_ROT | 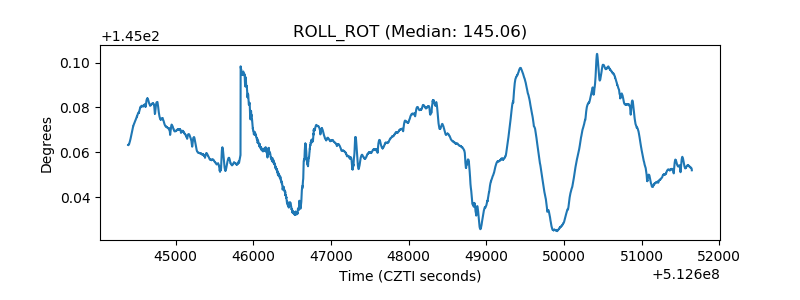 |
| _Roll_DEC | 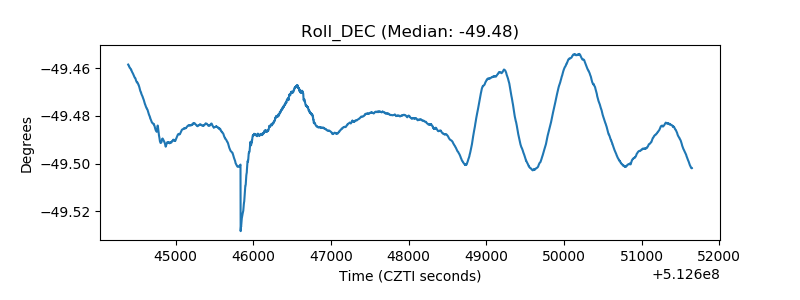 |
| _Roll_RA | 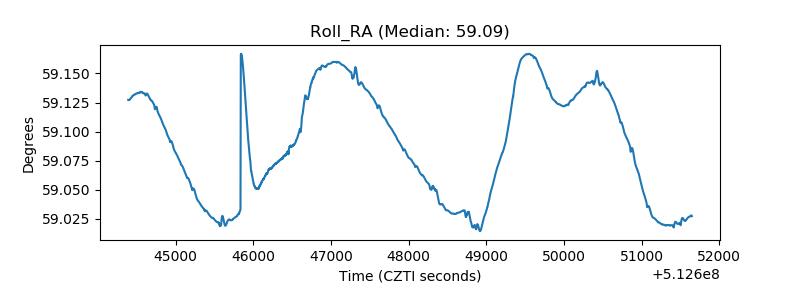 |
| Veto Counter | 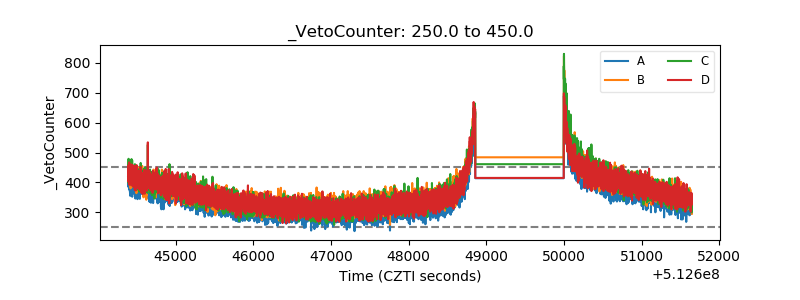 |