| Param | Original file | Final file |
|---|---|---|
| Filename | modeM0/AS1A14_083T03_9000006562_56842cztM0_level2.fits | modeM0/AS1A14_083T03_9000006562_56842cztM0_level2_quad_clean.evt |
| Size (bytes) | 404,392,320 | 95,647,680 |
| Size | 385.7 MB | 91.2 MB |
| Events in quadrant A | 3,009,211 | 632,859 |
| Events in quadrant B | 3,324,051 | 675,432 |
| Events in quadrant C | 3,718,338 | 594,304 |
| Events in quadrant D | 4,417,965 | 545,906 |
| Mode M9 | |||
|---|---|---|---|
| Quadrant | BADHDUFLAG | Total packets | Discarded packets |
| A | 0 | 11 | 0 |
| B | 0 | 11 | 0 |
| C | 0 | 11 | 0 |
| D | 0 | 11 | 0 |
| Mode SS | |||
|---|---|---|---|
| Quadrant | BADHDUFLAG | Total packets | Discarded packets |
| A | 0 | 130 | 0 |
| B | 0 | 130 | 0 |
| C | 0 | 130 | 0 |
| D | 0 | 130 | 0 |
| Mode M0 | |||
|---|---|---|---|
| Quadrant | BADHDUFLAG | Total packets | Discarded packets |
| A | 0 | 13692 | 1 |
| B | 0 | 14296 | 1 |
| C | 0 | 15658 | 1 |
| D | 0 | 17603 | 1 |
| Quadrant | Total seconds | Saturated seconds | Saturation percentage |
|---|---|---|---|
| A | 6419 | 77 | 1.199564% |
| B | 6419 | 141 | 2.196604% |
| C | 6420 | 206 | 3.208723% |
| D | 6420 | 417 | 6.495327% |
Noise dominated data is calculated using 1-second bins in cleaned event files. If a bin has >2000 counts, and if more than 50% of those come from <1% of pixels, then it is considered to be noise-dominated and hence unusable.
| Quadrant | # 1 sec bins | Bins with >0 counts | Bins with >2000 counts | High rate bins dominated by noise | Noise dominated (total time) | Noise dominated (detector-on time) | Marked lightcurve |
|---|---|---|---|---|---|---|---|
| A | 7499 | 6420 | 11 | 11 | 0.15% | 0.17% | 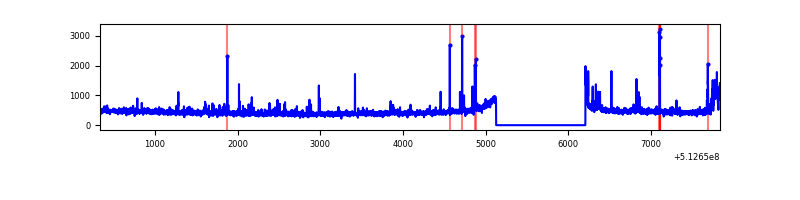 |
| B | 7499 | 6420 | 54 | 54 | 0.72% | 0.84% | 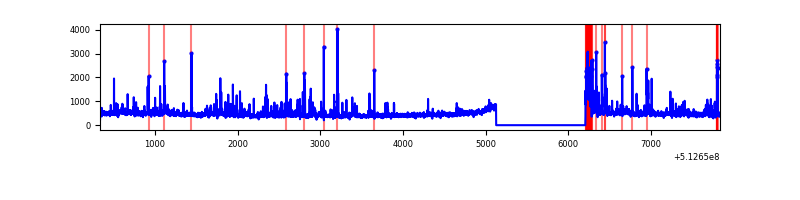 |
| C | 7500 | 6421 | 144 | 144 | 1.92% | 2.24% | 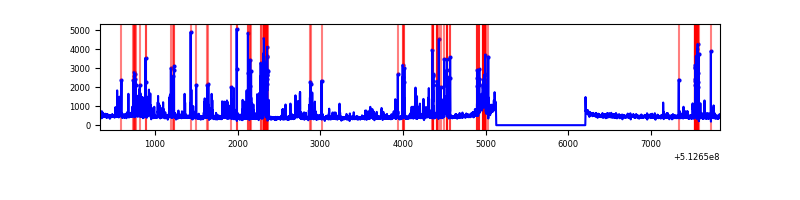 |
| D | 7500 | 6421 | 356 | 356 | 4.75% | 5.54% | 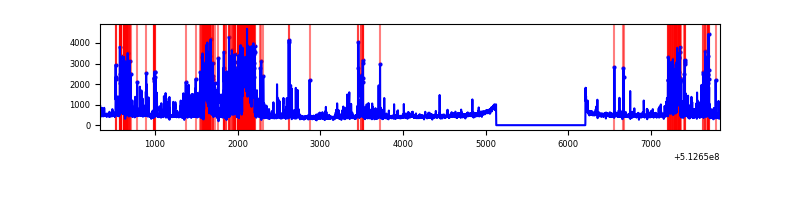 |
Top three noisy pixels from each quadrant. If the there are fewer than three noisy pixels in the level2.evt file, extra rows are filled as -1
| Pixel properties | Quadrant properties | ||||||
|---|---|---|---|---|---|---|---|
| Quadrant | DetID | PixID | Counts | Sigma | Mean | Median | Sigma |
| A | 7 | 64 | 80354 | 455.2 | 708 | 690 | 175.0 |
| A | 3 | 62 | 59708 | 337.23 | 708 | 690 | 175.0 |
| A | 3 | 14 | 54655 | 308.36 | 708 | 690 | 175.0 |
| B | 5 | 185 | 179305 | 1210.41 | 684 | 658 | 147.6 |
| B | 10 | 16 | 149834 | 1010.73 | 684 | 658 | 147.6 |
| B | 0 | 245 | 63746 | 427.45 | 684 | 658 | 147.6 |
| C | 12 | 252 | 856471 | 4637.62 | 668 | 659 | 184.5 |
| C | 13 | 3 | 102967 | 554.4 | 668 | 659 | 184.5 |
| C | 1 | 16 | 99636 | 536.35 | 668 | 659 | 184.5 |
| D | 2 | 249 | 854252 | 4512.64 | 668 | 635 | 189.2 |
| D | 8 | 240 | 753301 | 3978.97 | 668 | 635 | 189.2 |
| D | 2 | 31 | 65850 | 344.76 | 668 | 635 | 189.2 |
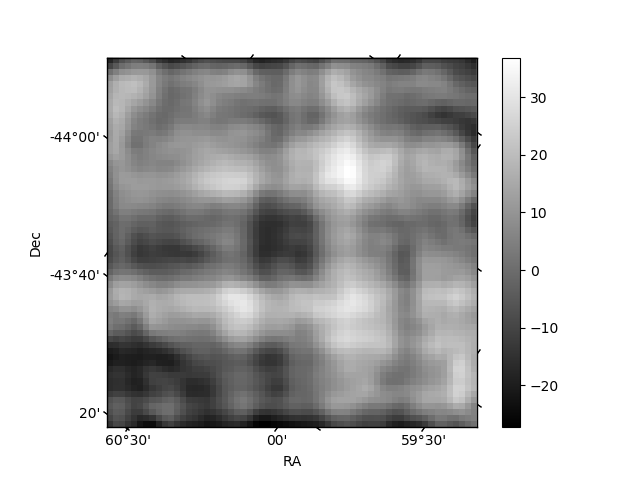
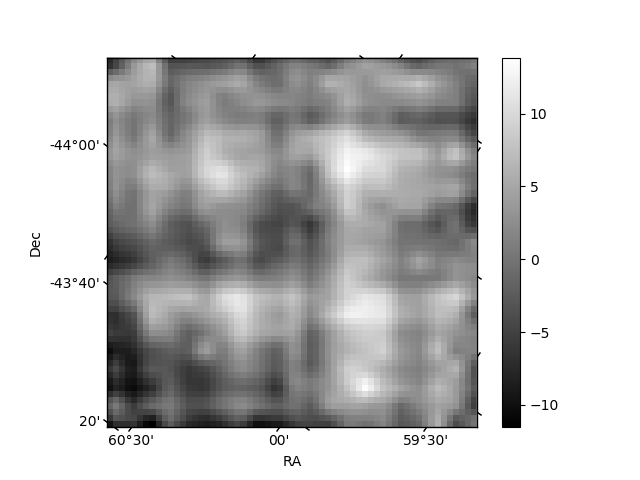
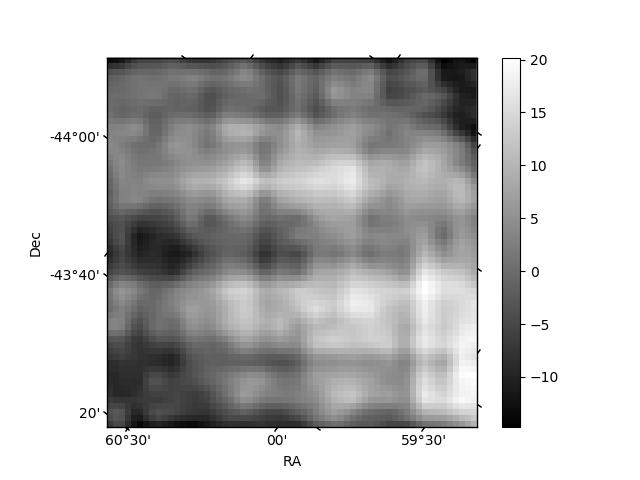
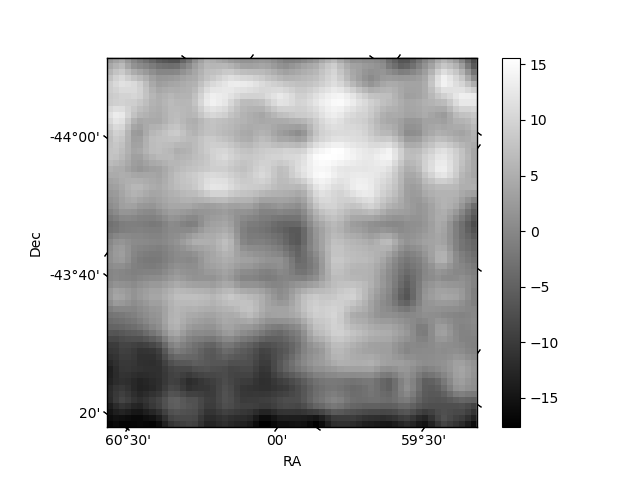
Histogram calculated using DETX and DETY for each event in the final _common_clean file
| Quadrant A | 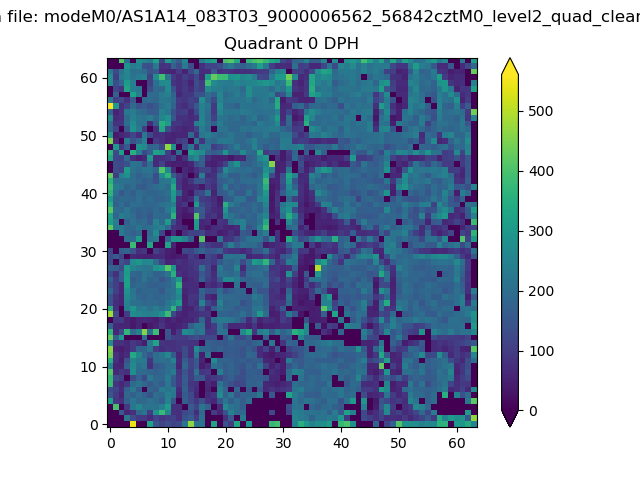 |
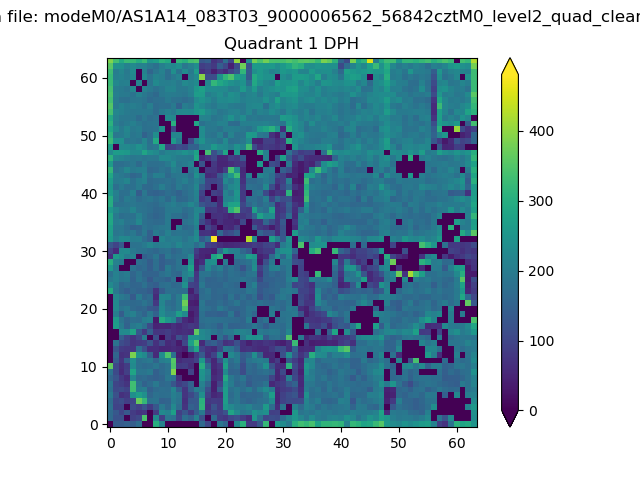 |
Quadrant B |
|---|---|---|---|
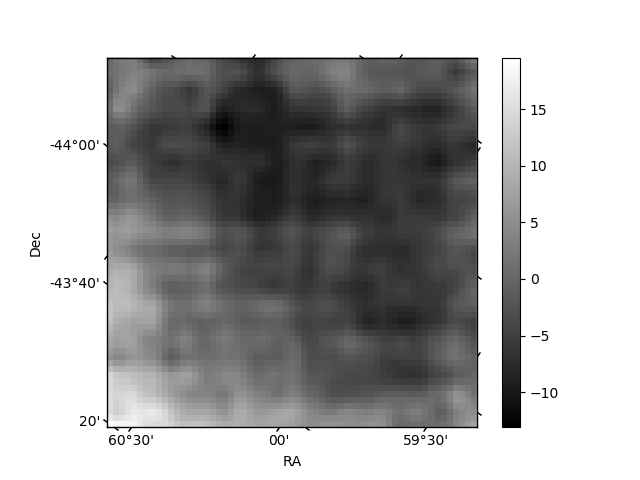
| Quadrant D | 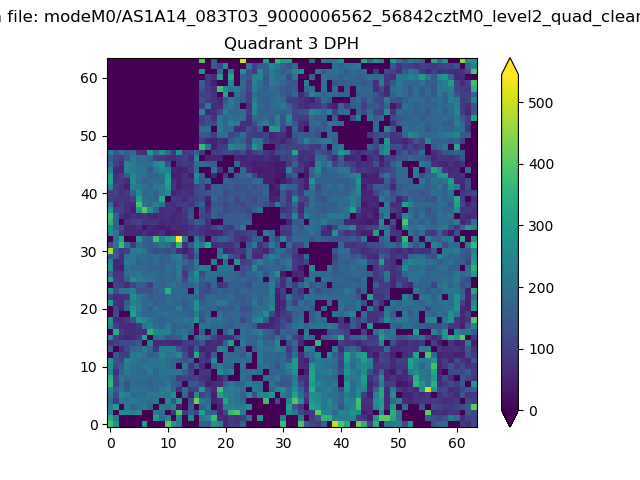 |
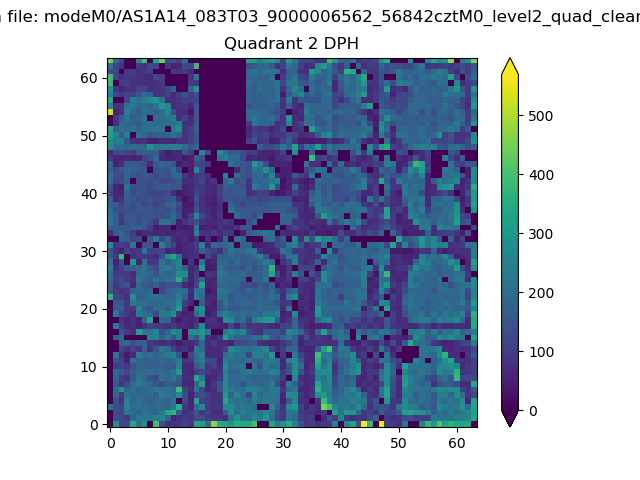 |
Quadrant C |
| Plot type | Count rate plots | Images |
|---|---|---|
| Comparison with Poisson distribution Blue bars denote a histogram of data divided into 1 sec bins. Red curve is a Poisson curve with rate = median count rate of data. |
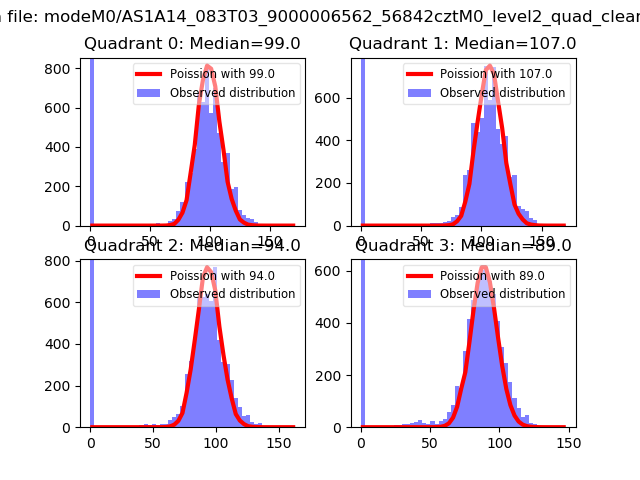 |
 |
| Quadrant-wise count rates Data is divided into 100 sec bins |
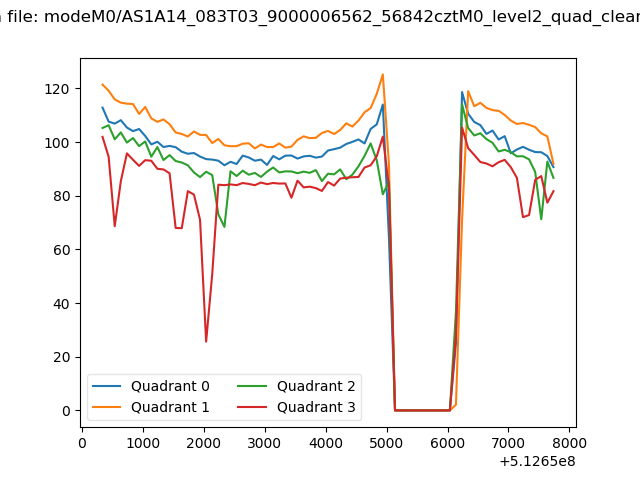 |
|
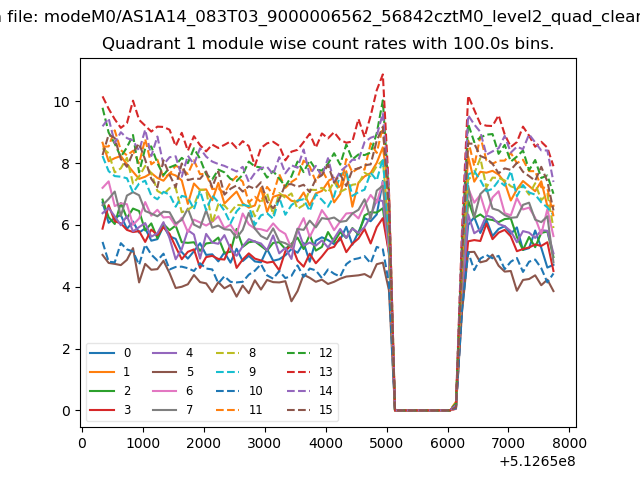
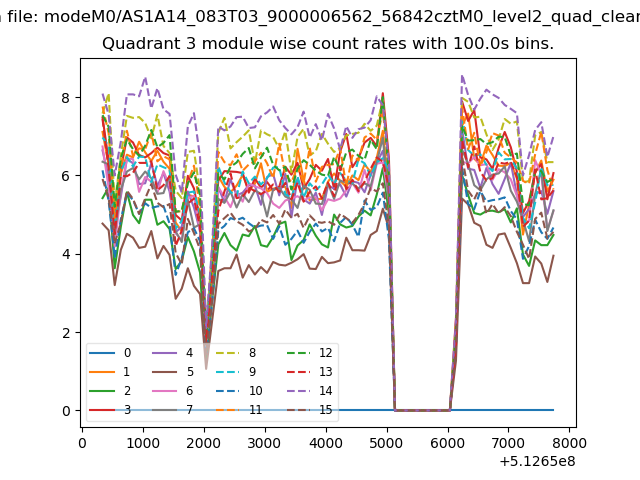
| Module-wise count rates for Quadrant A Data is divided into 100 sec bins |
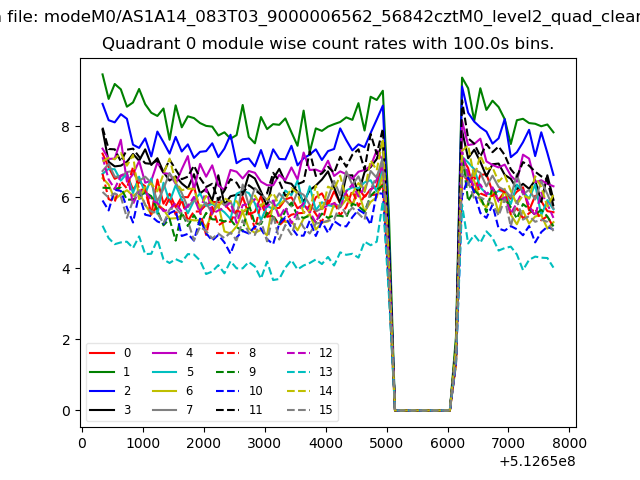 |
 |
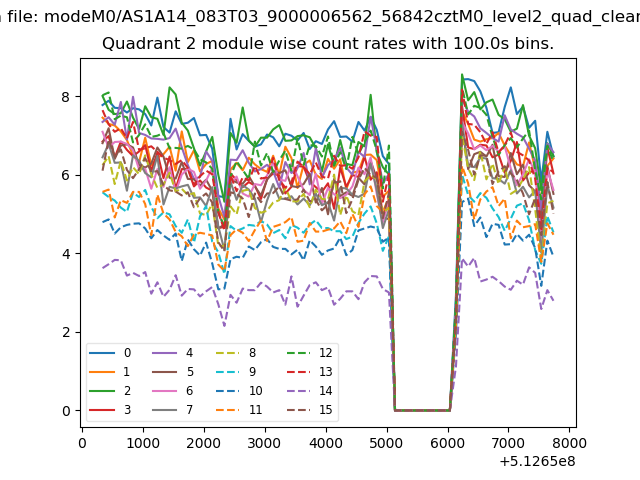
| Module-wise count rates for Quadrant B Data is divided into 100 sec bins |
 |
 |
| Module-wise count rates for Quadrant C Data is divided into 100 sec bins |
 |
 |
| Module-wise count rates for Quadrant D Data is divided into 100 sec bins |
 |
 |
| Parameter | Plot |
|---|---|
| CZT HV Monitor |  |
| D_VDD | 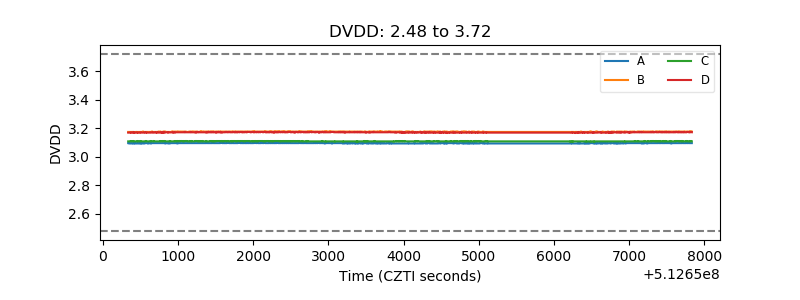 |
| Temperature 1 | 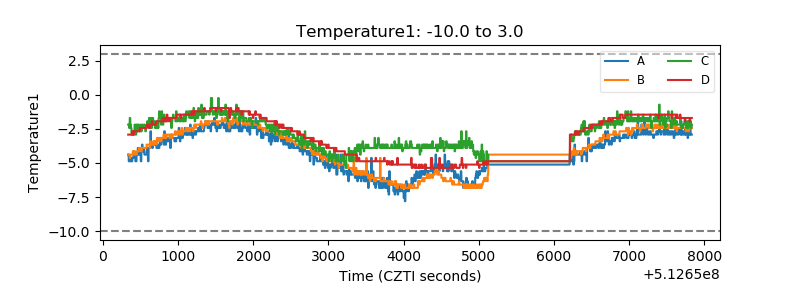 |
| Veto HV Monitor | 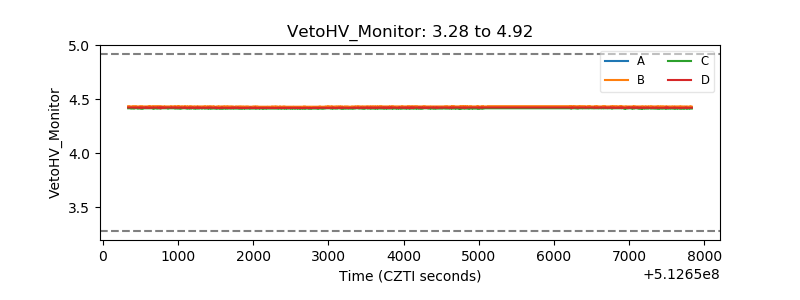 |
| Veto LLD | 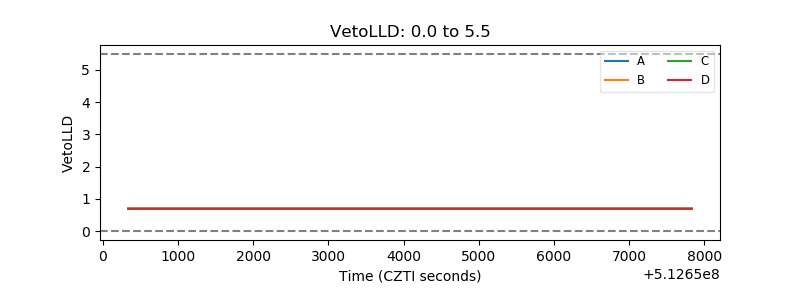 |
| Alpha Counter | 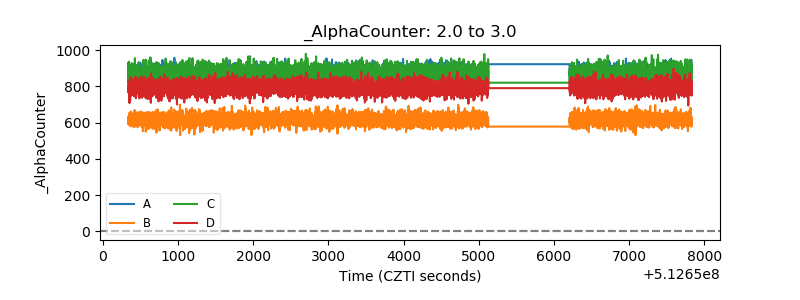 |
| _CPM_Rate | 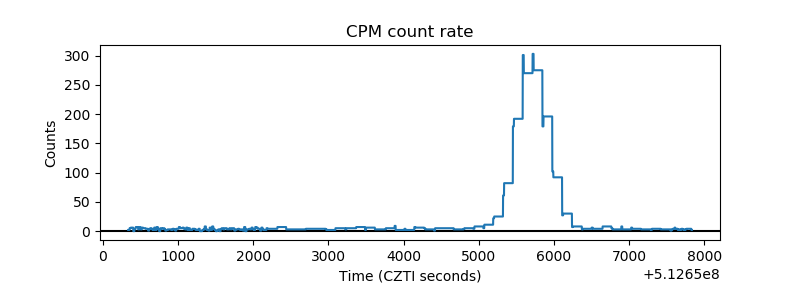 |
| CZT Counter | 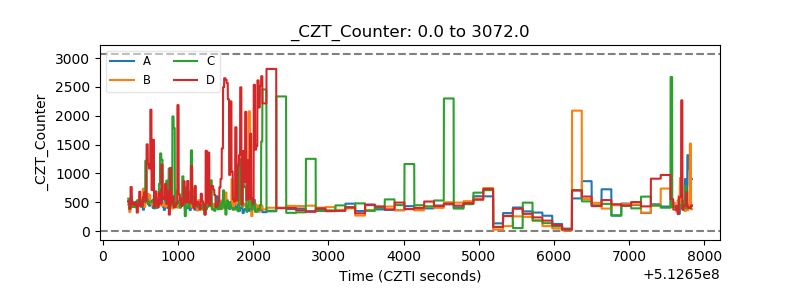 |
| +2.5 Volts monitor |  |
| +5 Volts monitor | 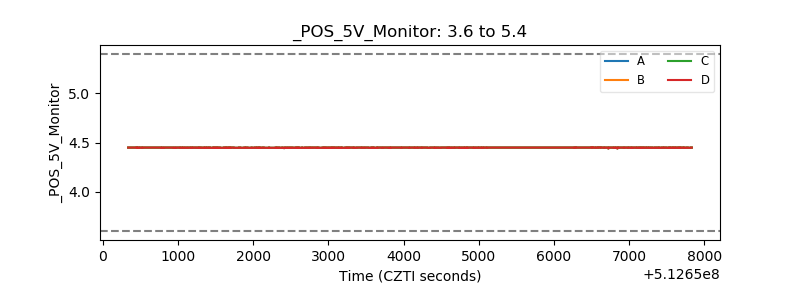 |
| _ROLL_ROT | 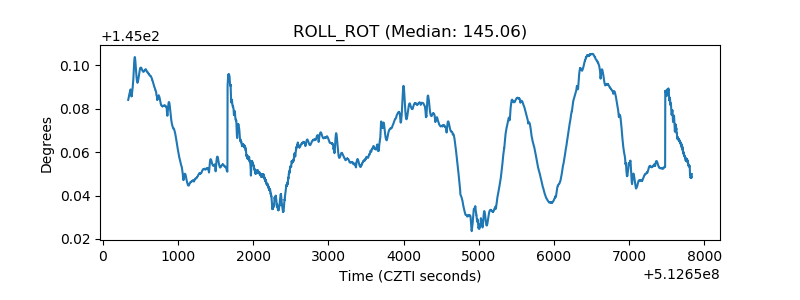 |
| _Roll_DEC | 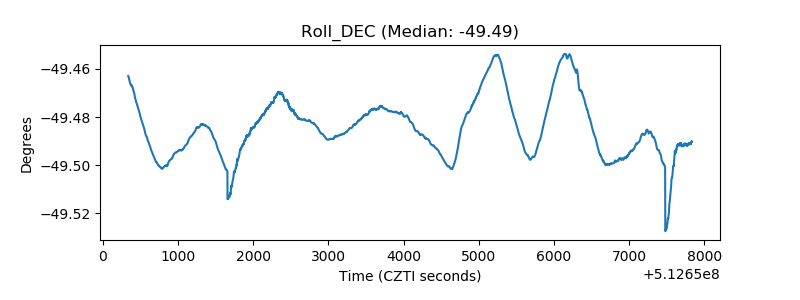 |
| _Roll_RA | 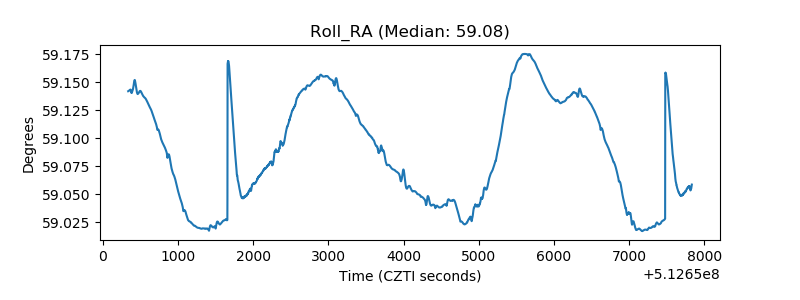 |
| Veto Counter | 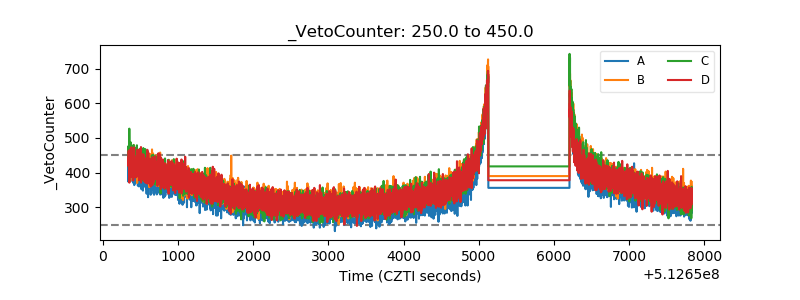 |