| Param | Original file | Final file |
|---|---|---|
| Filename | modeM0/AS1A14_083T03_9000006562_56843cztM0_level2.fits | modeM0/AS1A14_083T03_9000006562_56843cztM0_level2_quad_clean.evt |
| Size (bytes) | 414,976,320 | 96,292,800 |
| Size | 395.8 MB | 91.8 MB |
| Events in quadrant A | 3,304,089 | 631,909 |
| Events in quadrant B | 3,566,837 | 667,393 |
| Events in quadrant C | 3,230,470 | 605,798 |
| Events in quadrant D | 4,748,428 | 552,332 |
| Mode M9 | |||
|---|---|---|---|
| Quadrant | BADHDUFLAG | Total packets | Discarded packets |
| A | 0 | 9 | 0 |
| B | 0 | 9 | 0 |
| C | 0 | 9 | 0 |
| D | 0 | 9 | 0 |
| Mode SS | |||
|---|---|---|---|
| Quadrant | BADHDUFLAG | Total packets | Discarded packets |
| A | 0 | 134 | 0 |
| B | 0 | 134 | 0 |
| C | 0 | 134 | 0 |
| D | 0 | 134 | 0 |
| Mode M0 | |||
|---|---|---|---|
| Quadrant | BADHDUFLAG | Total packets | Discarded packets |
| A | 0 | 14459 | 1 |
| B | 0 | 15295 | 1 |
| C | 0 | 14449 | 3 |
| D | 0 | 18816 | 1 |
| Quadrant | Total seconds | Saturated seconds | Saturation percentage |
|---|---|---|---|
| A | 6573 | 77 | 1.171459% |
| B | 6573 | 195 | 2.966682% |
| C | 6572 | 53 | 0.806452% |
| D | 6572 | 364 | 5.538649% |
Noise dominated data is calculated using 1-second bins in cleaned event files. If a bin has >2000 counts, and if more than 50% of those come from <1% of pixels, then it is considered to be noise-dominated and hence unusable.
| Quadrant | # 1 sec bins | Bins with >0 counts | Bins with >2000 counts | High rate bins dominated by noise | Noise dominated (total time) | Noise dominated (detector-on time) | Marked lightcurve |
|---|---|---|---|---|---|---|---|
| A | 7483 | 6574 | 22 | 22 | 0.29% | 0.33% | 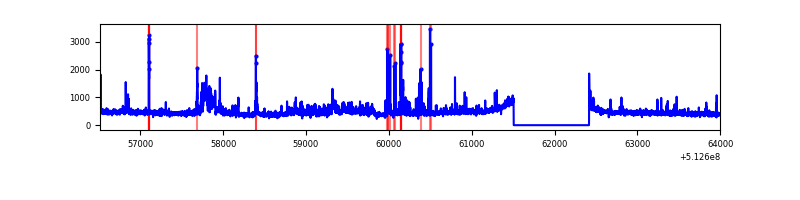 |
| B | 7483 | 6574 | 102 | 102 | 1.36% | 1.55% | 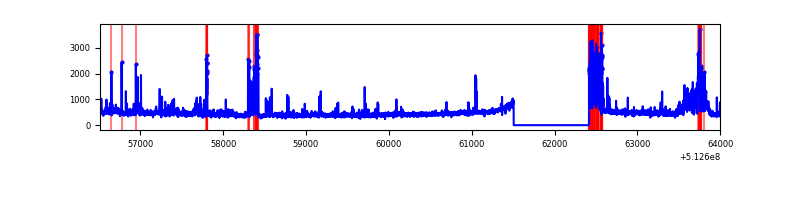 |
| C | 7482 | 6573 | 27 | 27 | 0.36% | 0.41% | 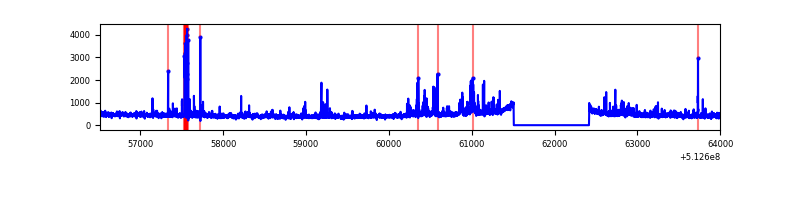 |
| D | 7482 | 6573 | 316 | 316 | 4.22% | 4.81% | 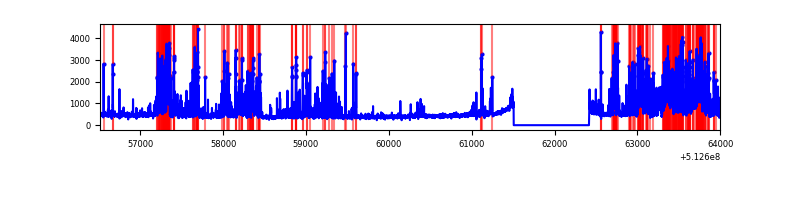 |
Top three noisy pixels from each quadrant. If the there are fewer than three noisy pixels in the level2.evt file, extra rows are filled as -1
| Pixel properties | Quadrant properties | ||||||
|---|---|---|---|---|---|---|---|
| Quadrant | DetID | PixID | Counts | Sigma | Mean | Median | Sigma |
| A | 3 | 14 | 163539 | 922.77 | 711 | 693 | 176.5 |
| A | 10 | 251 | 161257 | 909.84 | 711 | 693 | 176.5 |
| A | 7 | 64 | 137692 | 776.31 | 711 | 693 | 176.5 |
| B | 0 | 173 | 213085 | 1439.58 | 690 | 665 | 147.6 |
| B | 10 | 16 | 207763 | 1403.51 | 690 | 665 | 147.6 |
| B | 5 | 185 | 187223 | 1264.31 | 690 | 665 | 147.6 |
| C | 13 | 3 | 275439 | 1474.43 | 680 | 673 | 186.4 |
| C | 1 | 16 | 188363 | 1007.17 | 680 | 673 | 186.4 |
| C | 12 | 252 | 34817 | 183.22 | 680 | 673 | 186.4 |
| D | 2 | 249 | 1192247 | 6212.41 | 675 | 645 | 191.8 |
| D | 8 | 240 | 587891 | 3061.61 | 675 | 645 | 191.8 |
| D | 11 | 129 | 109460 | 567.31 | 675 | 645 | 191.8 |
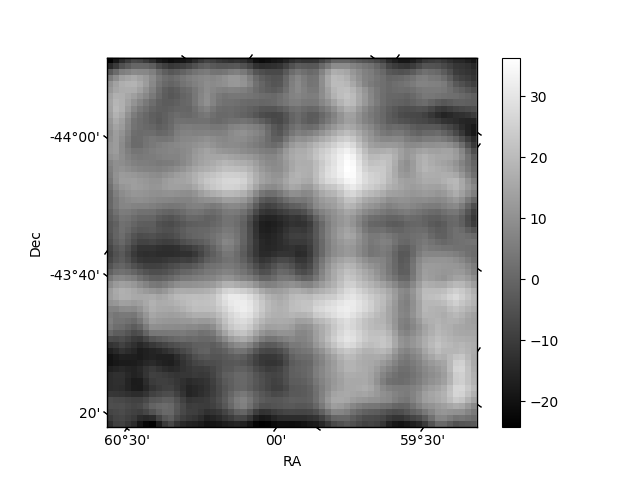
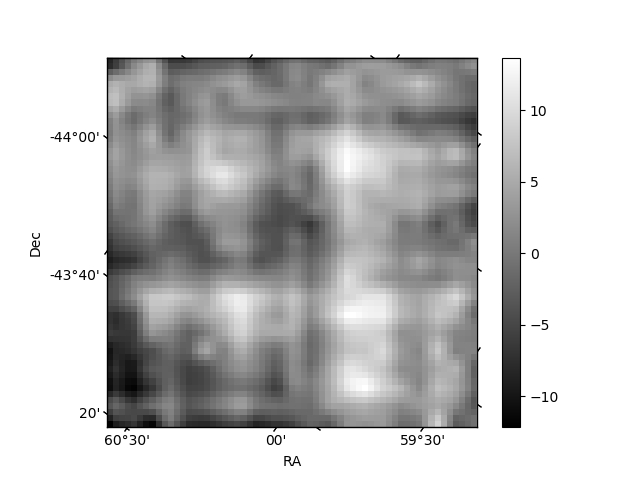
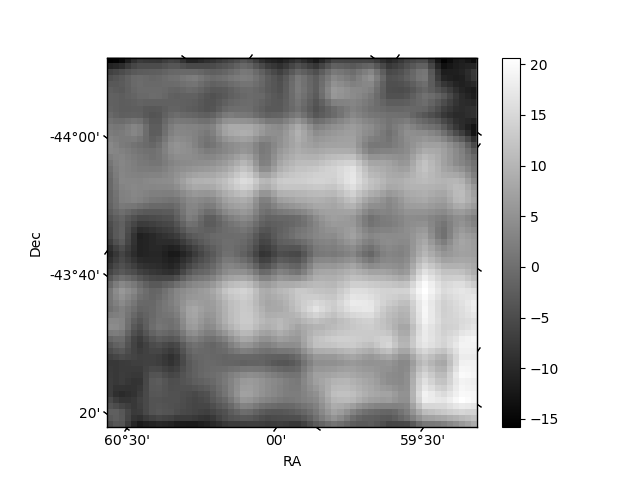
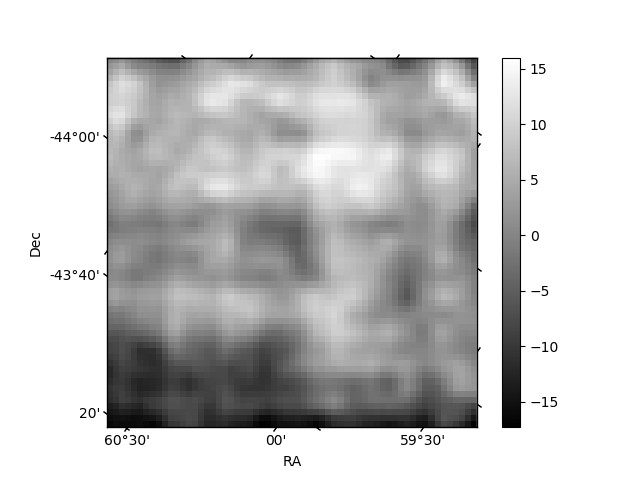
Histogram calculated using DETX and DETY for each event in the final _common_clean file
| Quadrant A | 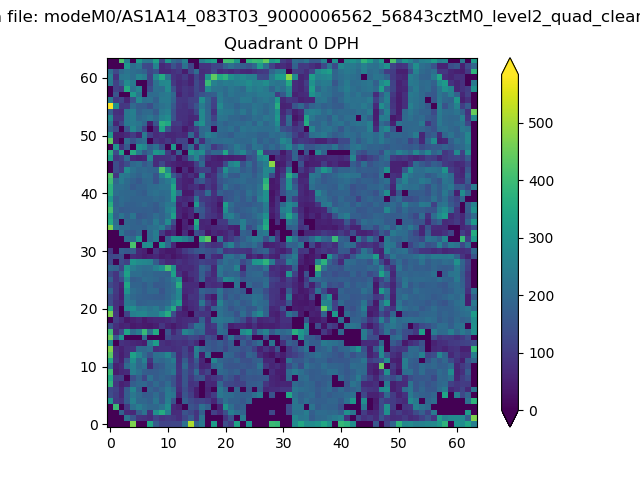 |
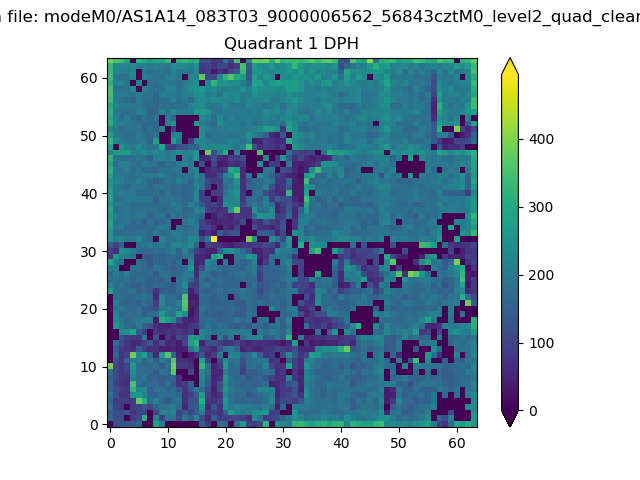 |
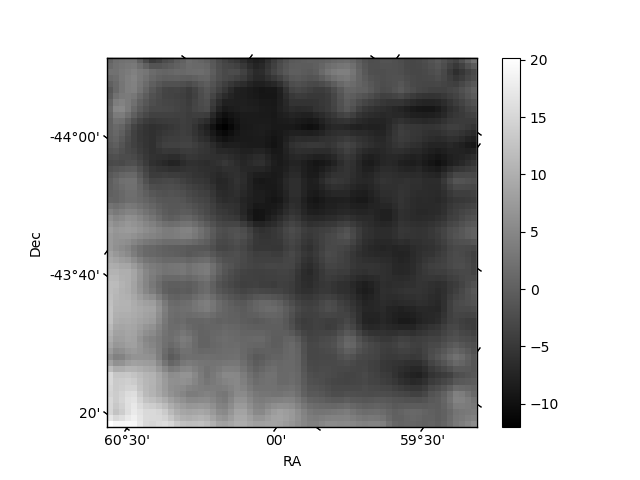
Quadrant B |
|---|---|---|---|
| Quadrant D | 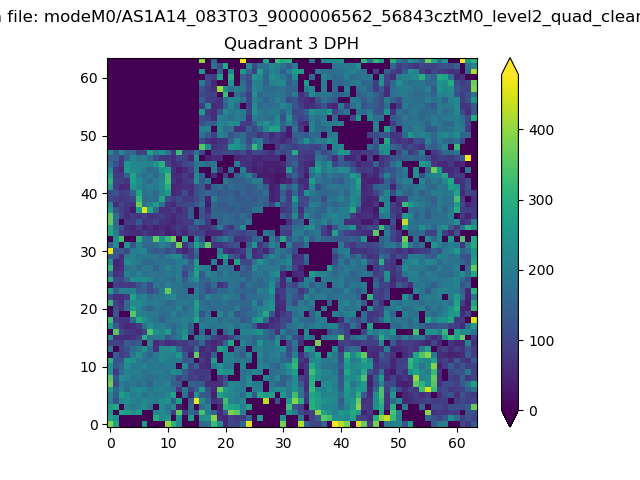 |
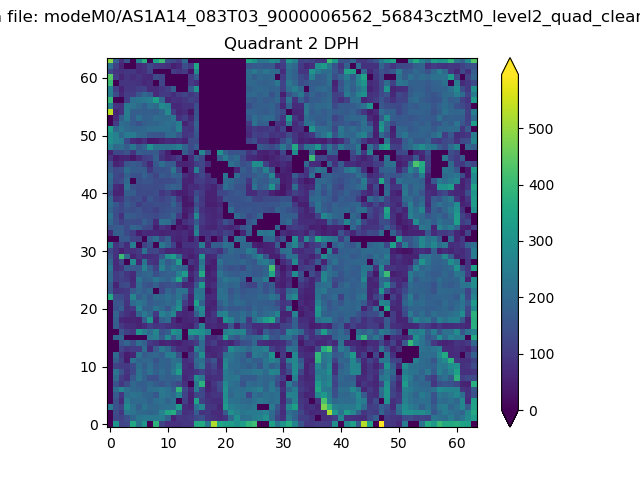 |
Quadrant C |
| Plot type | Count rate plots | Images |
|---|---|---|
| Comparison with Poisson distribution Blue bars denote a histogram of data divided into 1 sec bins. Red curve is a Poisson curve with rate = median count rate of data. |
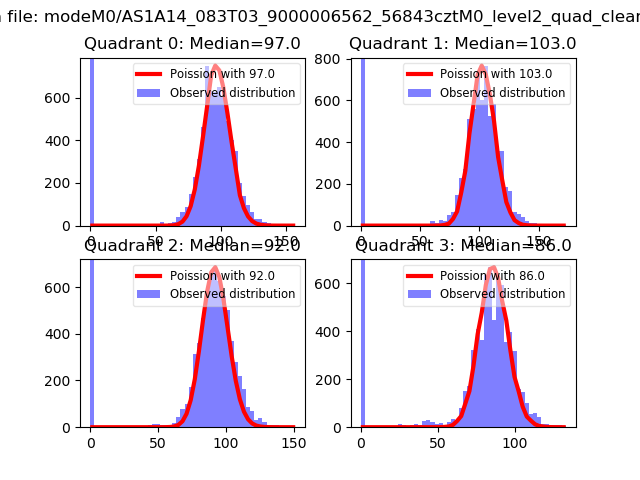 |
 |
| Quadrant-wise count rates Data is divided into 100 sec bins |
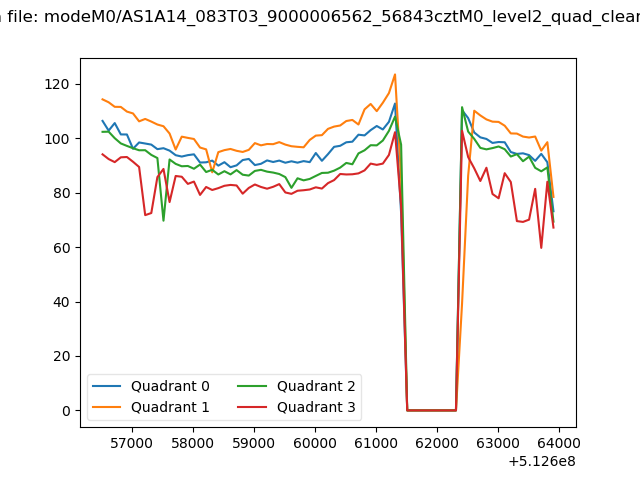 |
|
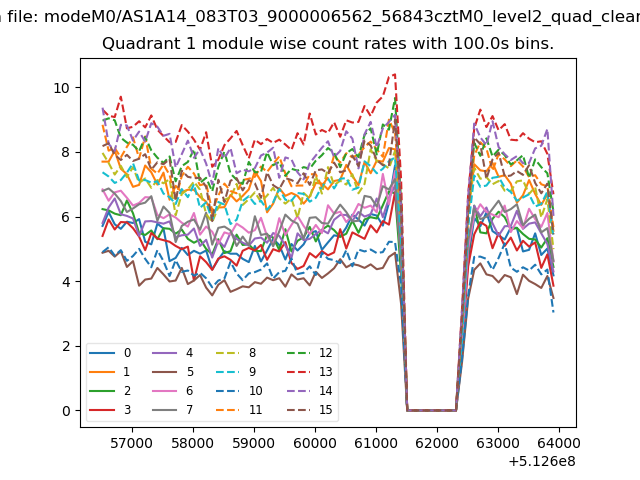
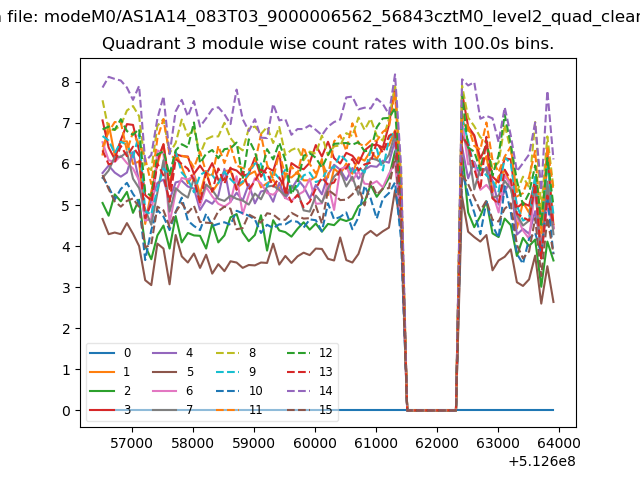
| Module-wise count rates for Quadrant A Data is divided into 100 sec bins |
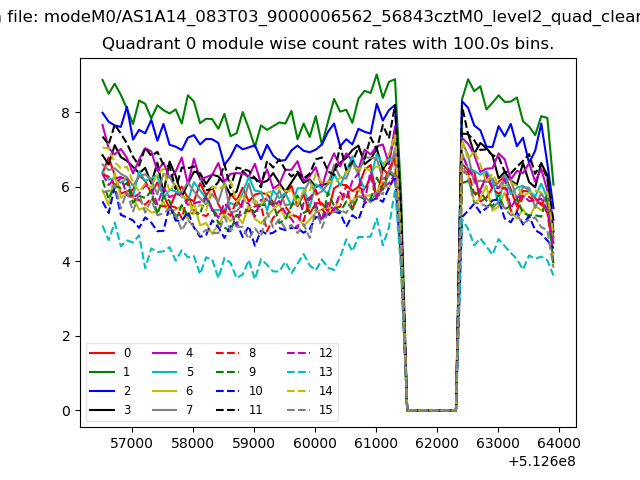 |
 |
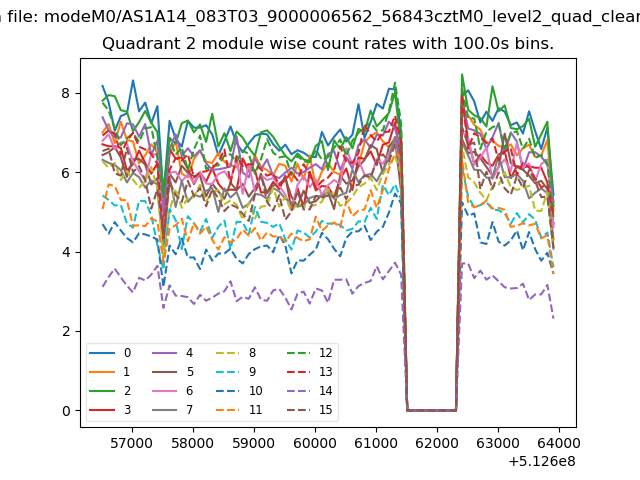
| Module-wise count rates for Quadrant B Data is divided into 100 sec bins |
 |
 |
| Module-wise count rates for Quadrant C Data is divided into 100 sec bins |
 |
 |
| Module-wise count rates for Quadrant D Data is divided into 100 sec bins |
 |
 |
| Parameter | Plot |
|---|---|
| CZT HV Monitor | 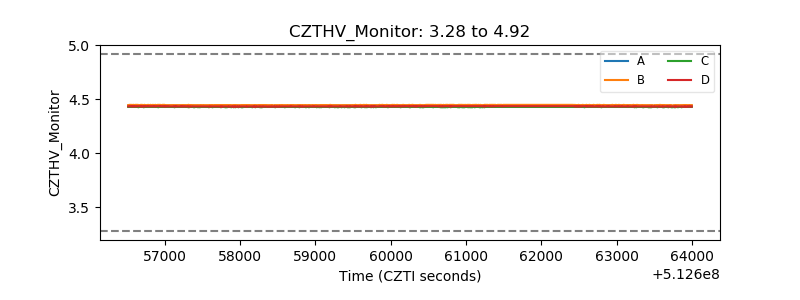 |
| D_VDD | 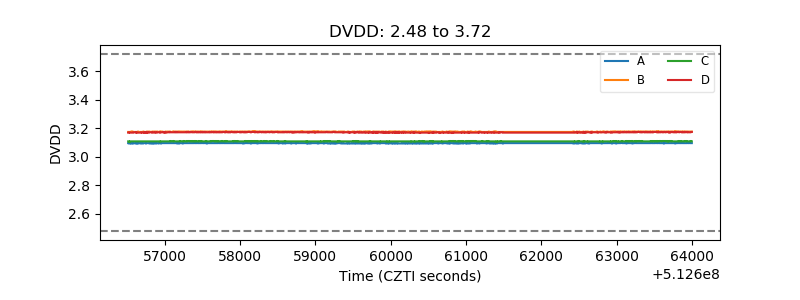 |
| Temperature 1 | 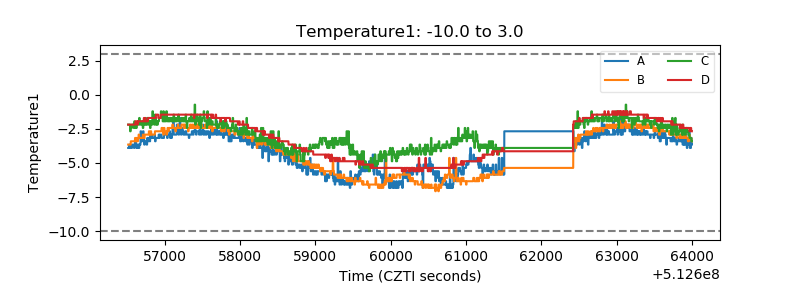 |
| Veto HV Monitor | 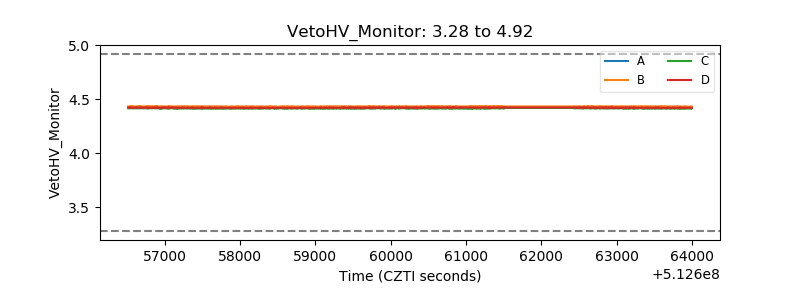 |
| Veto LLD | 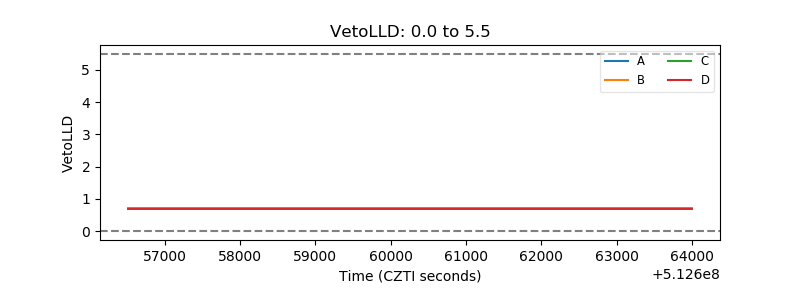 |
| Alpha Counter | 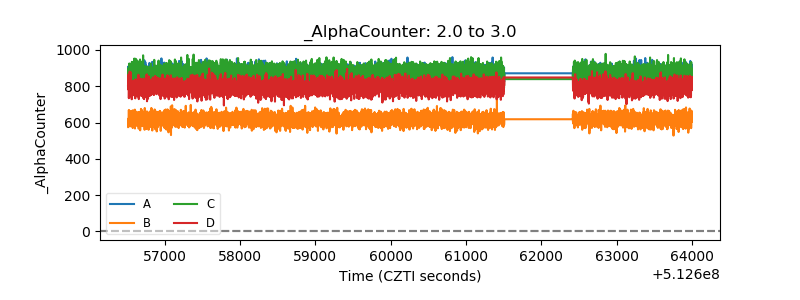 |
| _CPM_Rate | 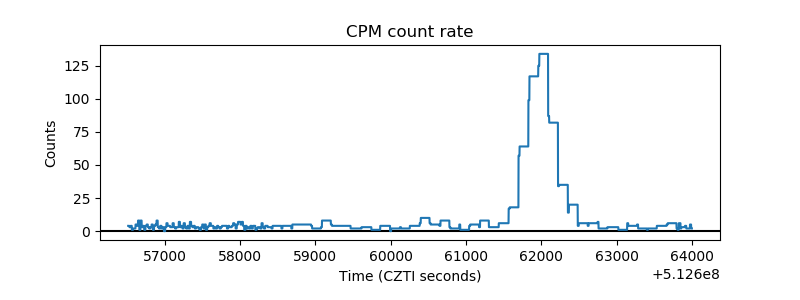 |
| CZT Counter | 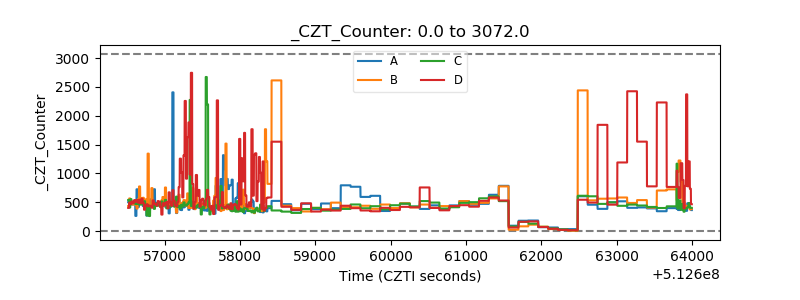 |
| +2.5 Volts monitor |  |
| +5 Volts monitor | 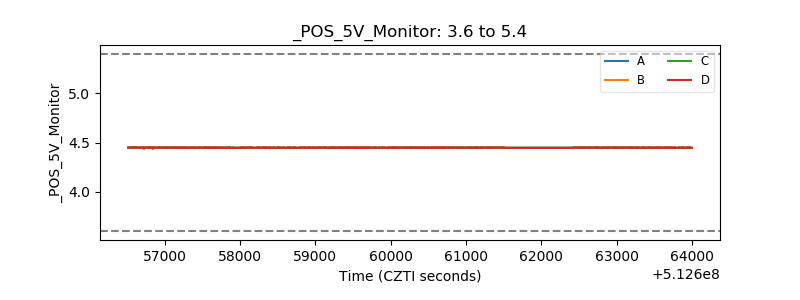 |
| _ROLL_ROT | 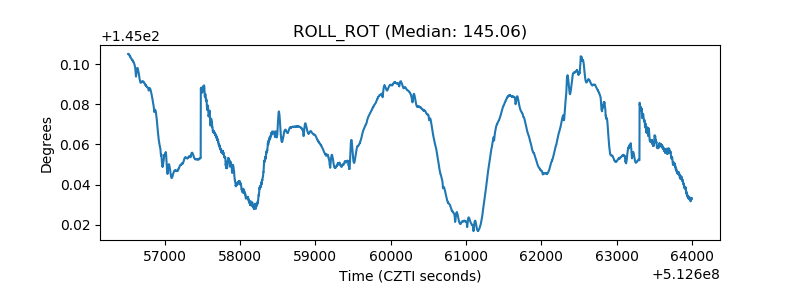 |
| _Roll_DEC | 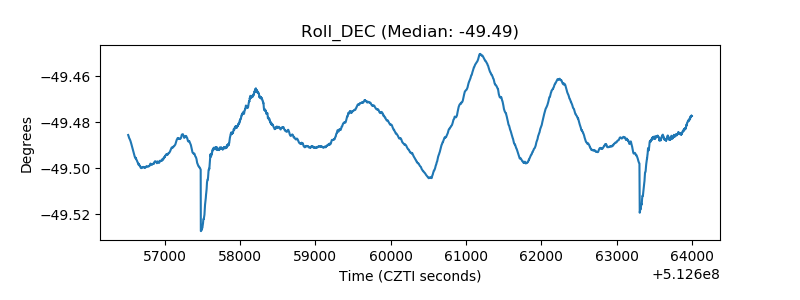 |
| _Roll_RA | 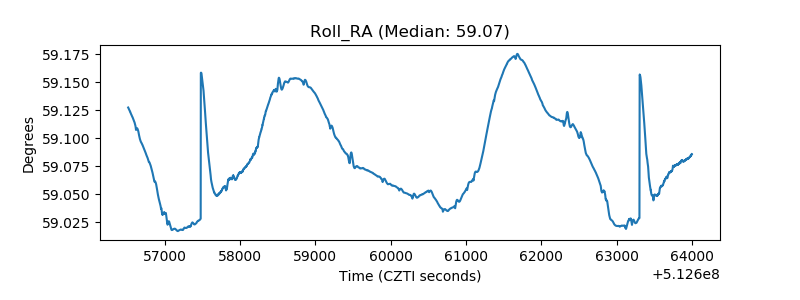 |
| Veto Counter | 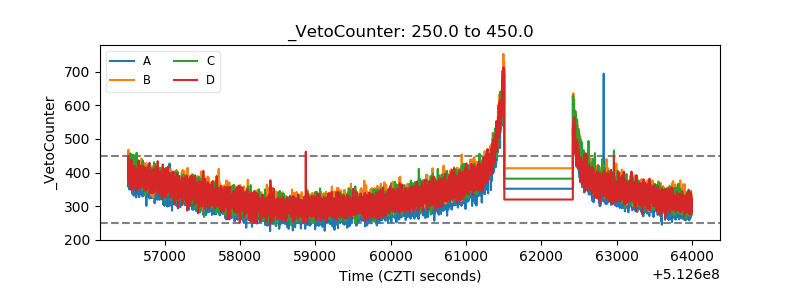 |