| Param | Original file | Final file |
|---|---|---|
| Filename | modeM0/AS1A14_083T03_9000006562_56844cztM0_level2.fits | modeM0/AS1A14_083T03_9000006562_56844cztM0_level2_quad_clean.evt |
| Size (bytes) | 431,674,560 | 100,572,480 |
| Size | 411.7 MB | 95.9 MB |
| Events in quadrant A | 3,306,377 | 657,155 |
| Events in quadrant B | 3,659,109 | 700,831 |
| Events in quadrant C | 3,330,851 | 634,470 |
| Events in quadrant D | 5,142,206 | 568,736 |
| Mode M9 | |||
|---|---|---|---|
| Quadrant | BADHDUFLAG | Total packets | Discarded packets |
| A | 0 | 5 | 0 |
| B | 0 | 5 | 0 |
| C | 0 | 5 | 0 |
| D | 0 | 5 | 0 |
| Mode SS | |||
|---|---|---|---|
| Quadrant | BADHDUFLAG | Total packets | Discarded packets |
| A | 0 | 142 | 0 |
| B | 0 | 142 | 0 |
| C | 0 | 142 | 0 |
| D | 0 | 142 | 0 |
| Mode M0 | |||
|---|---|---|---|
| Quadrant | BADHDUFLAG | Total packets | Discarded packets |
| A | 0 | 15129 | 1 |
| B | 0 | 15858 | 1 |
| C | 0 | 15040 | 1 |
| D | 0 | 20246 | 1 |
| Quadrant | Total seconds | Saturated seconds | Saturation percentage |
|---|---|---|---|
| A | 6946 | 115 | 1.655629% |
| B | 6946 | 151 | 2.173913% |
| C | 6946 | 11 | 0.158365% |
| D | 6947 | 494 | 7.110983% |
Noise dominated data is calculated using 1-second bins in cleaned event files. If a bin has >2000 counts, and if more than 50% of those come from <1% of pixels, then it is considered to be noise-dominated and hence unusable.
| Quadrant | # 1 sec bins | Bins with >0 counts | Bins with >2000 counts | High rate bins dominated by noise | Noise dominated (total time) | Noise dominated (detector-on time) | Marked lightcurve |
|---|---|---|---|---|---|---|---|
| A | 7481 | 6947 | 64 | 64 | 0.86% | 0.92% | 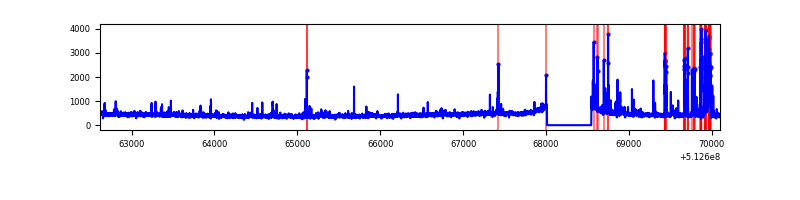 |
| B | 7481 | 6947 | 75 | 75 | 1.00% | 1.08% | 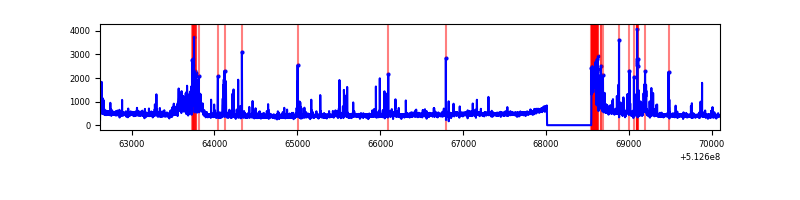 |
| C | 7481 | 6947 | 8 | 8 | 0.11% | 0.12% | 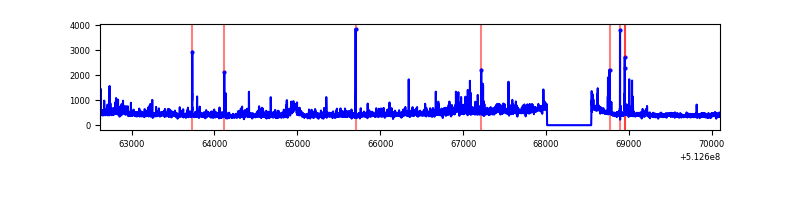 |
| D | 7482 | 6948 | 412 | 412 | 5.51% | 5.93% | 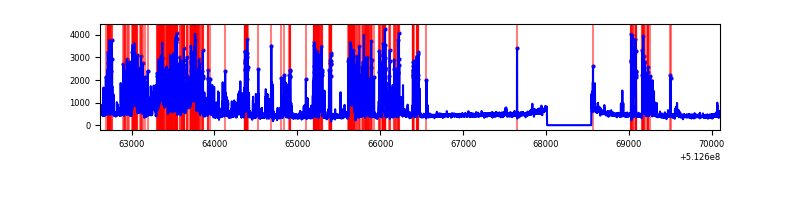 |
Top three noisy pixels from each quadrant. If the there are fewer than three noisy pixels in the level2.evt file, extra rows are filled as -1
| Pixel properties | Quadrant properties | ||||||
|---|---|---|---|---|---|---|---|
| Quadrant | DetID | PixID | Counts | Sigma | Mean | Median | Sigma |
| A | 3 | 62 | 212624 | 1157.43 | 742 | 724 | 183.1 |
| A | 10 | 251 | 95309 | 516.64 | 742 | 724 | 183.1 |
| A | 4 | 13 | 56874 | 306.7 | 742 | 724 | 183.1 |
| B | 0 | 173 | 205025 | 1319.79 | 724 | 699 | 154.8 |
| B | 5 | 185 | 171368 | 1102.39 | 724 | 699 | 154.8 |
| B | 10 | 16 | 120455 | 773.53 | 724 | 699 | 154.8 |
| C | 1 | 16 | 252740 | 1286.44 | 717 | 710 | 195.9 |
| C | 13 | 3 | 86893 | 439.9 | 717 | 710 | 195.9 |
| C | 14 | 96 | 52254 | 263.09 | 717 | 710 | 195.9 |
| D | 8 | 240 | 1158752 | 5809.92 | 700 | 667 | 199.3 |
| D | 2 | 249 | 885055 | 4436.83 | 700 | 667 | 199.3 |
| D | 11 | 129 | 122408 | 610.75 | 700 | 667 | 199.3 |
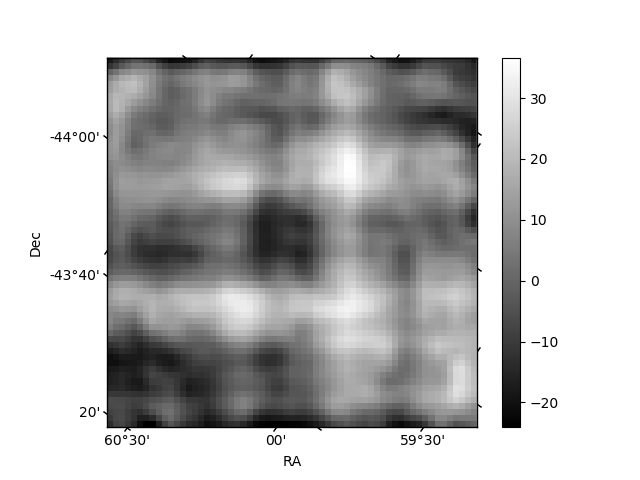
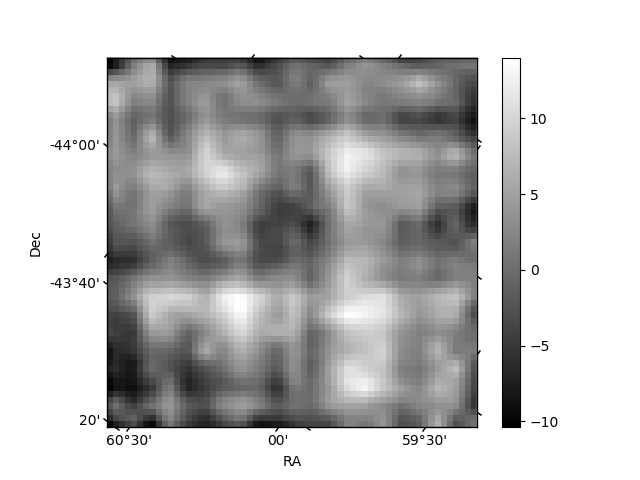
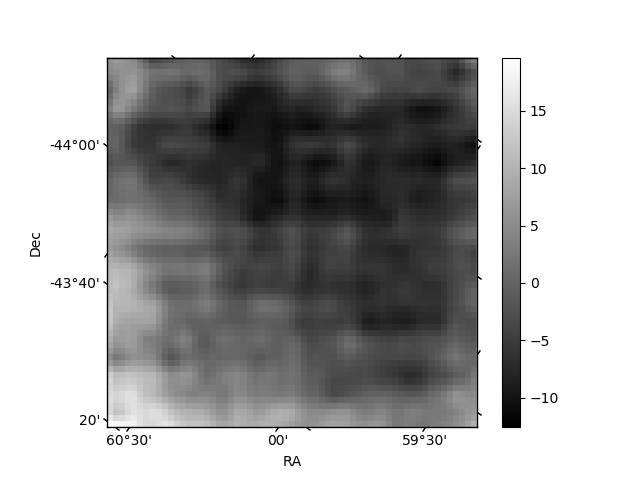
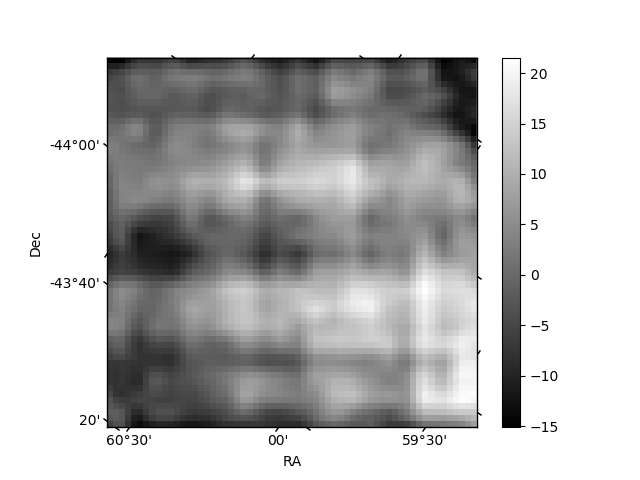
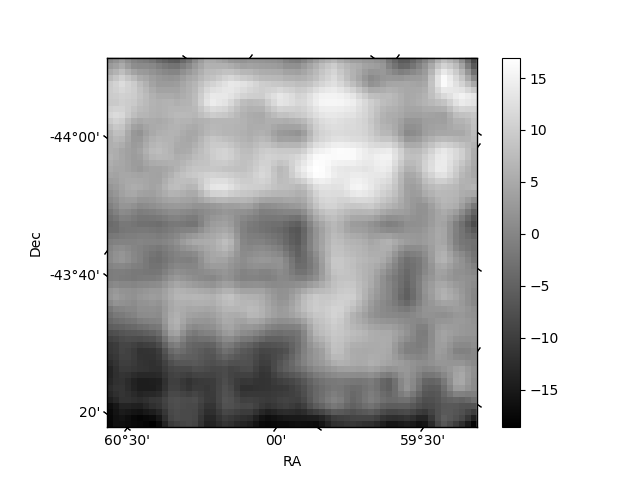
Histogram calculated using DETX and DETY for each event in the final _common_clean file
| Quadrant A | 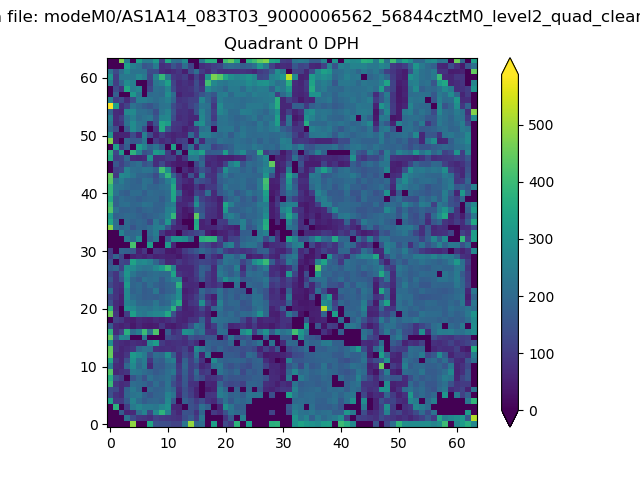 |
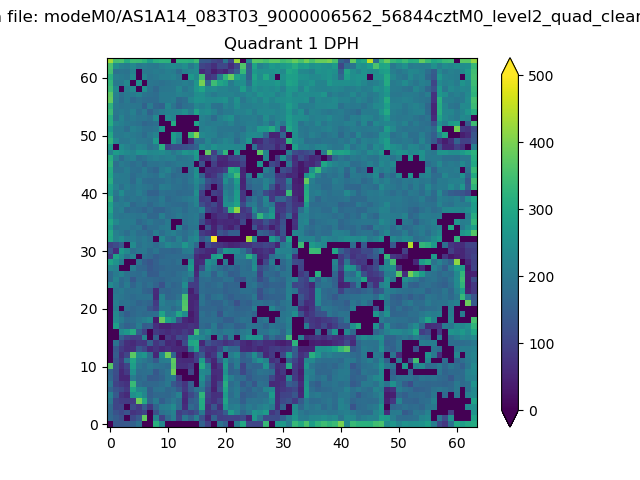 |
Quadrant B |
|---|---|---|---|
| Quadrant D |  |
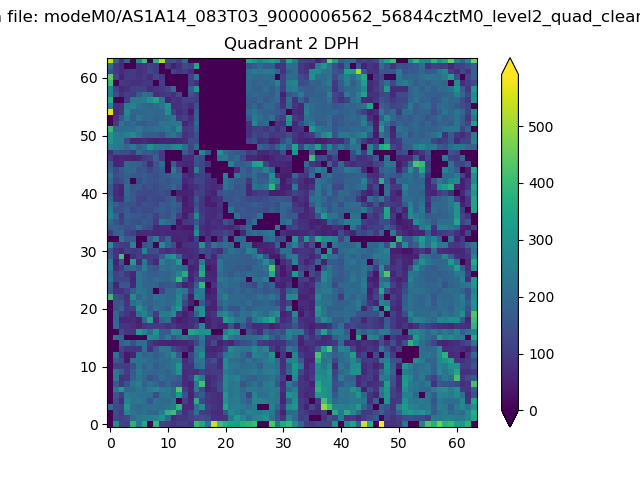 |
Quadrant C |
| Plot type | Count rate plots | Images |
|---|---|---|
| Comparison with Poisson distribution Blue bars denote a histogram of data divided into 1 sec bins. Red curve is a Poisson curve with rate = median count rate of data. |
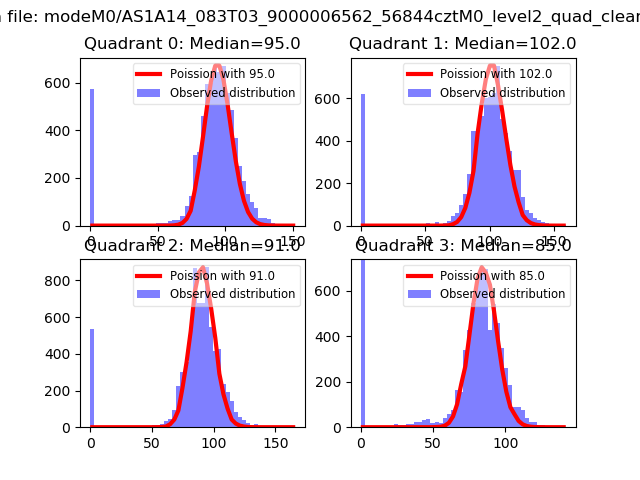 |
 |
| Quadrant-wise count rates Data is divided into 100 sec bins |
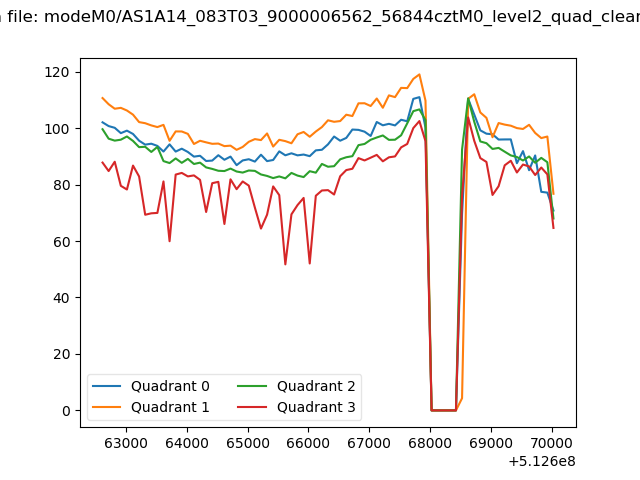 |
|
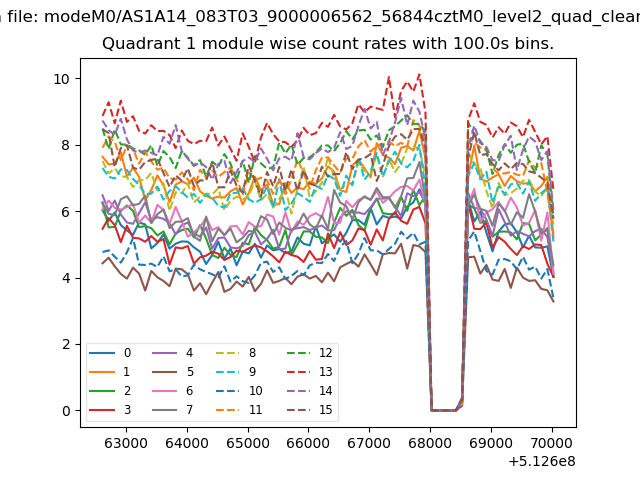
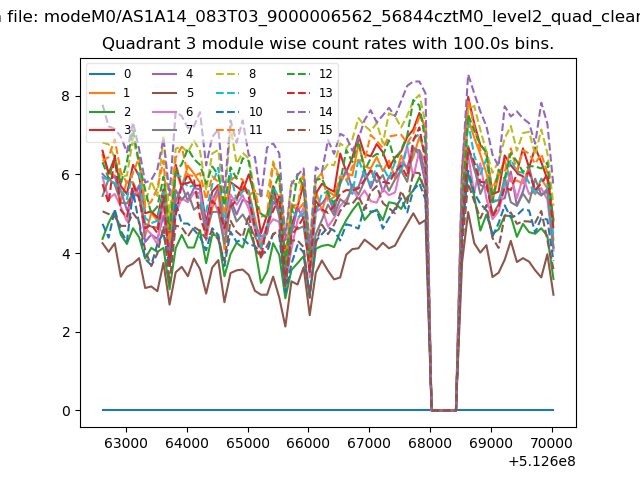
| Module-wise count rates for Quadrant A Data is divided into 100 sec bins |
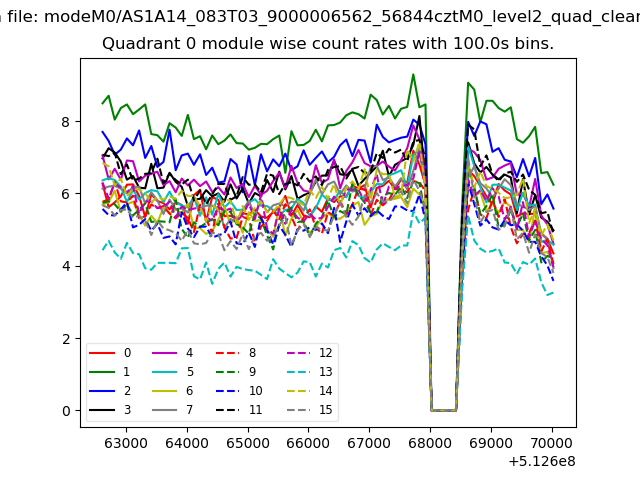 |
 |
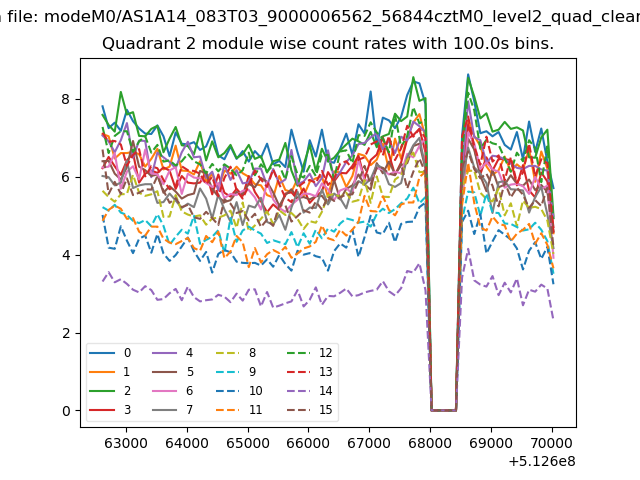
| Module-wise count rates for Quadrant B Data is divided into 100 sec bins |
 |
 |
| Module-wise count rates for Quadrant C Data is divided into 100 sec bins |
 |
 |
| Module-wise count rates for Quadrant D Data is divided into 100 sec bins |
 |
 |
| Parameter | Plot |
|---|---|
| CZT HV Monitor |  |
| D_VDD | 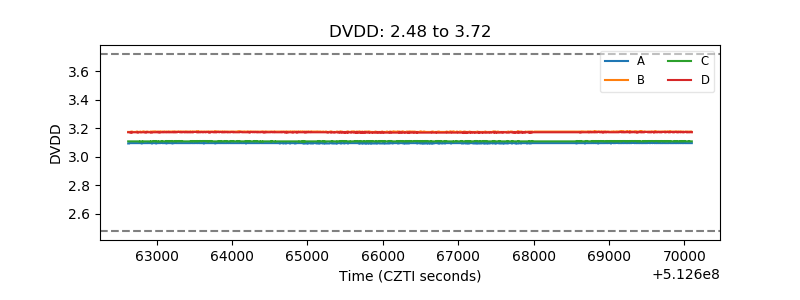 |
| Temperature 1 | 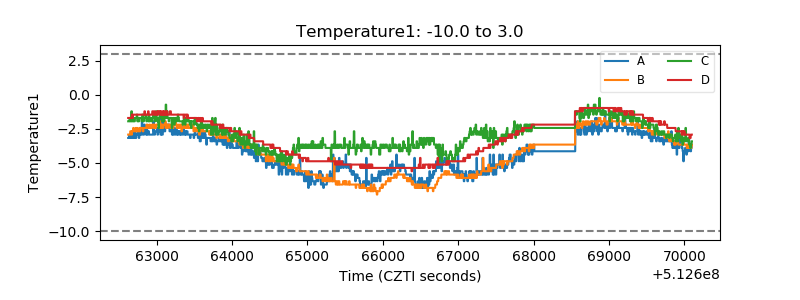 |
| Veto HV Monitor | 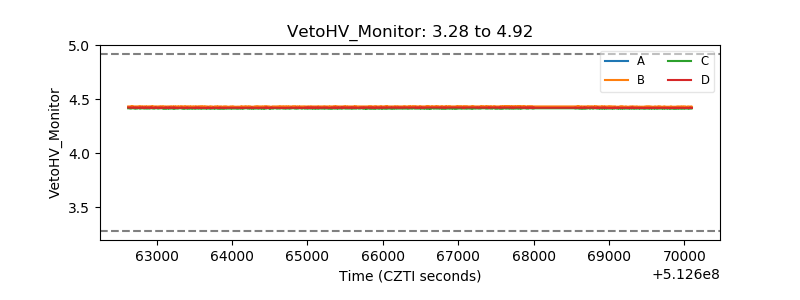 |
| Veto LLD | 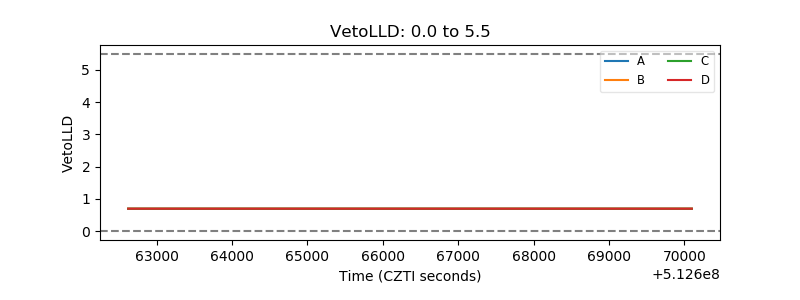 |
| Alpha Counter | 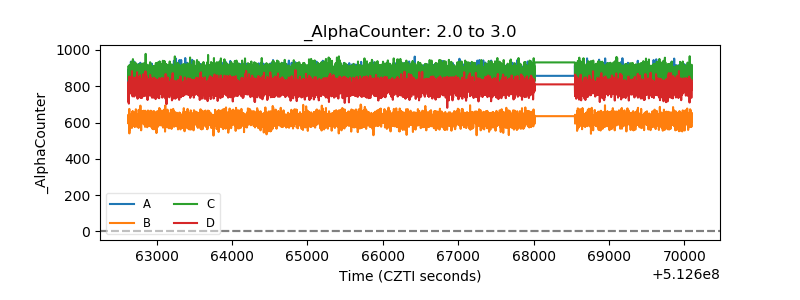 |
| _CPM_Rate | 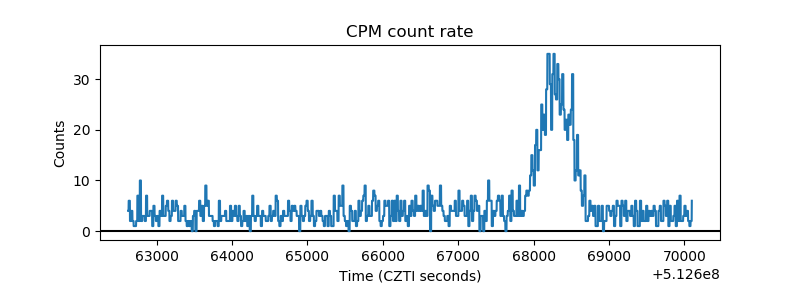 |
| CZT Counter | 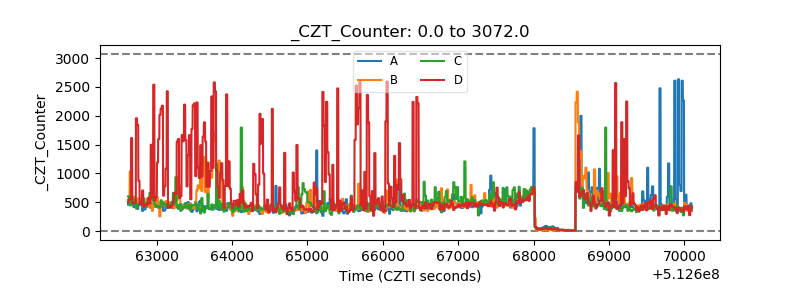 |
| +2.5 Volts monitor |  |
| +5 Volts monitor | 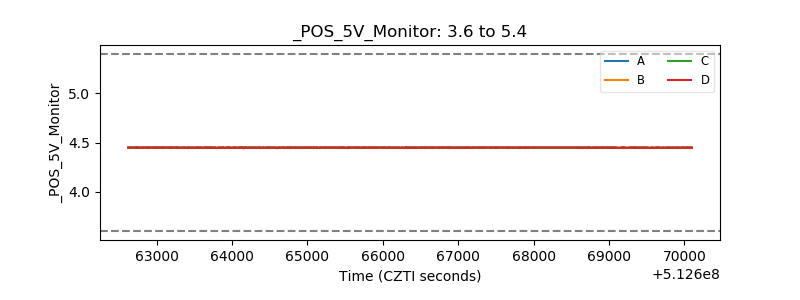 |
| _ROLL_ROT | 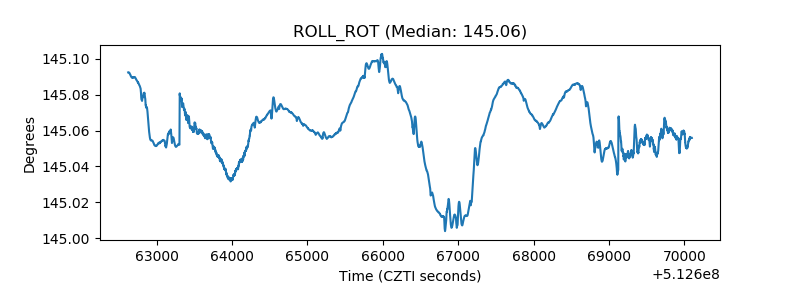 |
| _Roll_DEC | 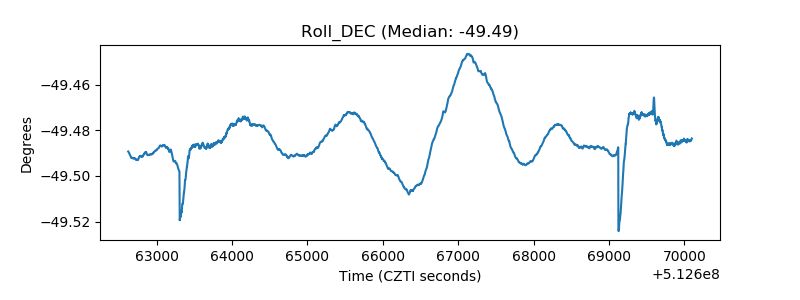 |
| _Roll_RA | 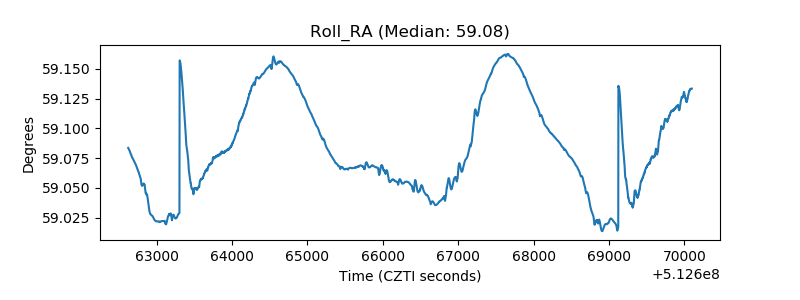 |
| Veto Counter | 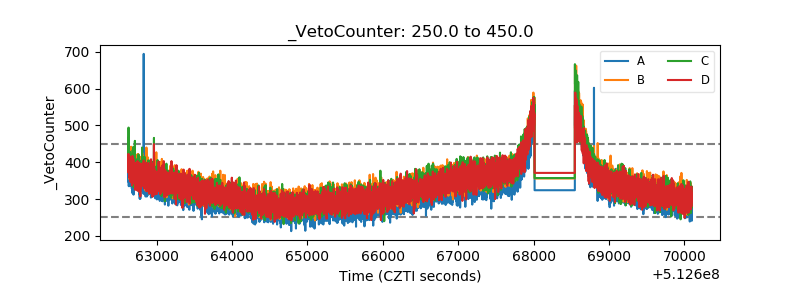 |