| Param | Original file | Final file |
|---|---|---|
| Filename | modeM0/AS1A14_083T03_9000006562_56845cztM0_level2.fits | modeM0/AS1A14_083T03_9000006562_56845cztM0_level2_quad_clean.evt |
| Size (bytes) | 469,416,960 | 112,965,120 |
| Size | 447.7 MB | 107.7 MB |
| Events in quadrant A | 4,109,614 | 730,149 |
| Events in quadrant B | 5,208,107 | 770,998 |
| Events in quadrant C | 3,569,438 | 711,275 |
| Events in quadrant D | 3,880,768 | 664,070 |
| Mode SS | |||
|---|---|---|---|
| Quadrant | BADHDUFLAG | Total packets | Discarded packets |
| A | 0 | 156 | 0 |
| B | 0 | 156 | 0 |
| C | 0 | 156 | 0 |
| D | 0 | 156 | 0 |
| Mode M0 | |||
|---|---|---|---|
| Quadrant | BADHDUFLAG | Total packets | Discarded packets |
| A | 0 | 18073 | 1 |
| B | 0 | 21162 | 0 |
| C | 0 | 16596 | 0 |
| D | 0 | 17392 | 0 |
| Quadrant | Total seconds | Saturated seconds | Saturation percentage |
|---|---|---|---|
| A | 7822 | 191 | 2.441831% |
| B | 7823 | 414 | 5.292087% |
| C | 7823 | 19 | 0.242874% |
| D | 7823 | 93 | 1.188802% |
Noise dominated data is calculated using 1-second bins in cleaned event files. If a bin has >2000 counts, and if more than 50% of those come from <1% of pixels, then it is considered to be noise-dominated and hence unusable.
| Quadrant | # 1 sec bins | Bins with >0 counts | Bins with >2000 counts | High rate bins dominated by noise | Noise dominated (total time) | Noise dominated (detector-on time) | Marked lightcurve |
|---|---|---|---|---|---|---|---|
| A | 7822 | 7822 | 134 | 134 | 1.71% | 1.71% | 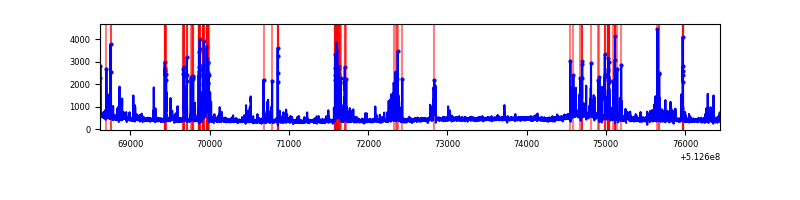 |
| B | 7823 | 7823 | 272 | 272 | 3.48% | 3.48% | 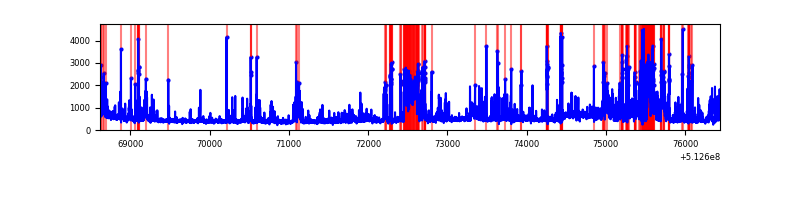 |
| C | 7823 | 7823 | 27 | 27 | 0.35% | 0.35% | 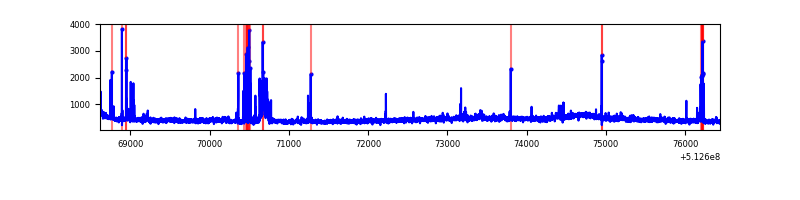 |
| D | 7823 | 7823 | 58 | 58 | 0.74% | 0.74% | 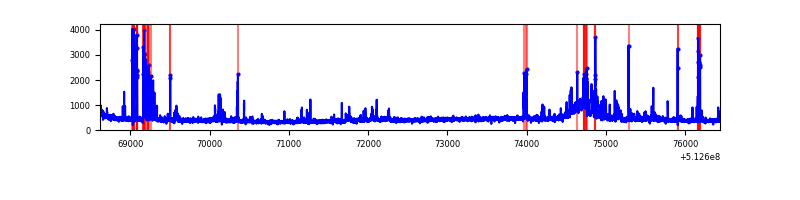 |
Top three noisy pixels from each quadrant. If the there are fewer than three noisy pixels in the level2.evt file, extra rows are filled as -1
| Pixel properties | Quadrant properties | ||||||
|---|---|---|---|---|---|---|---|
| Quadrant | DetID | PixID | Counts | Sigma | Mean | Median | Sigma |
| A | 10 | 251 | 428417 | 2058.95 | 835 | 812 | 207.7 |
| A | 3 | 62 | 257140 | 1234.24 | 835 | 812 | 207.7 |
| A | 4 | 13 | 60309 | 286.48 | 835 | 812 | 207.7 |
| B | 5 | 185 | 1683428 | 9631.86 | 816 | 787 | 174.7 |
| B | 0 | 245 | 91509 | 519.32 | 816 | 787 | 174.7 |
| B | 5 | 248 | 53620 | 302.43 | 816 | 787 | 174.7 |
| C | 12 | 252 | 196855 | 875.94 | 812 | 804 | 223.8 |
| C | 13 | 3 | 48120 | 211.4 | 812 | 804 | 223.8 |
| C | 11 | 244 | 38043 | 166.38 | 812 | 804 | 223.8 |
| D | 8 | 240 | 253872 | 1116.5 | 806 | 769 | 226.7 |
| D | 2 | 249 | 230927 | 1015.28 | 806 | 769 | 226.7 |
| D | 5 | 173 | 74098 | 323.47 | 806 | 769 | 226.7 |
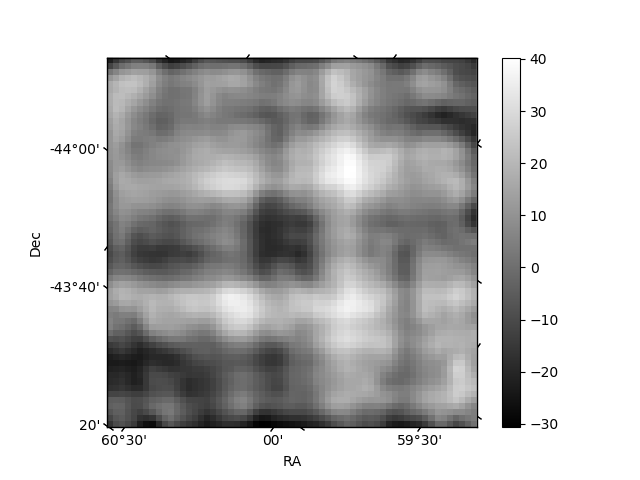
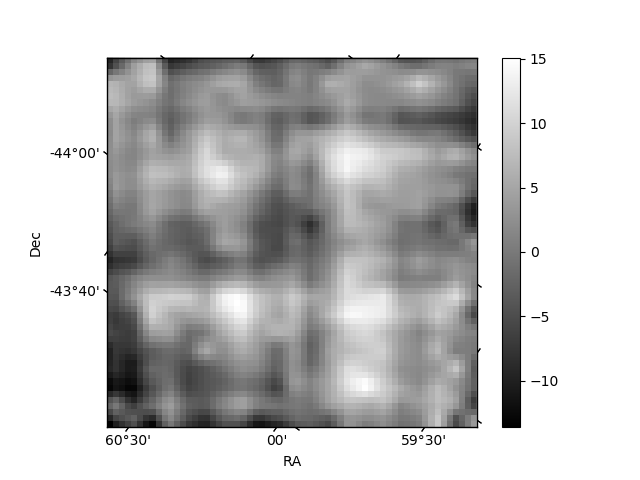
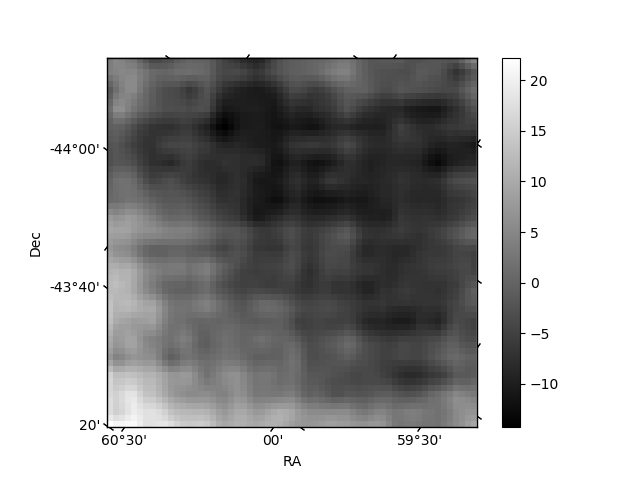
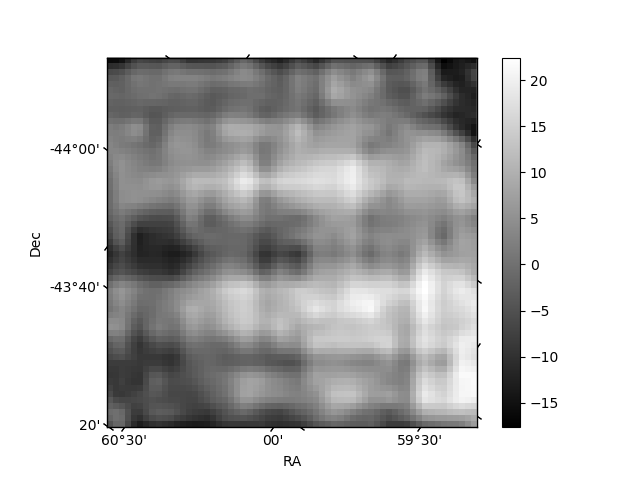
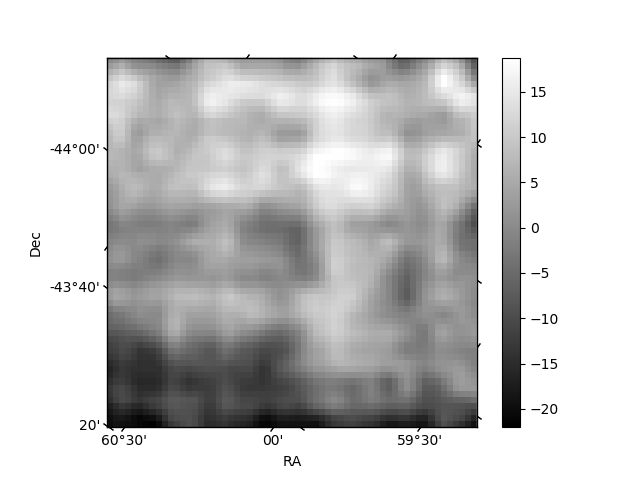
Histogram calculated using DETX and DETY for each event in the final _common_clean file
| Quadrant A | 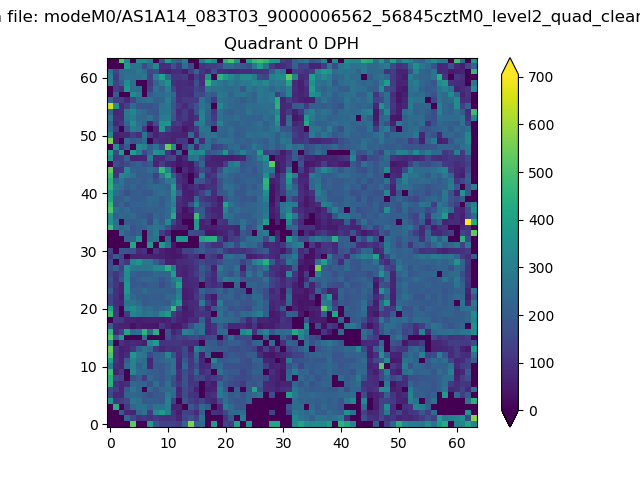 |
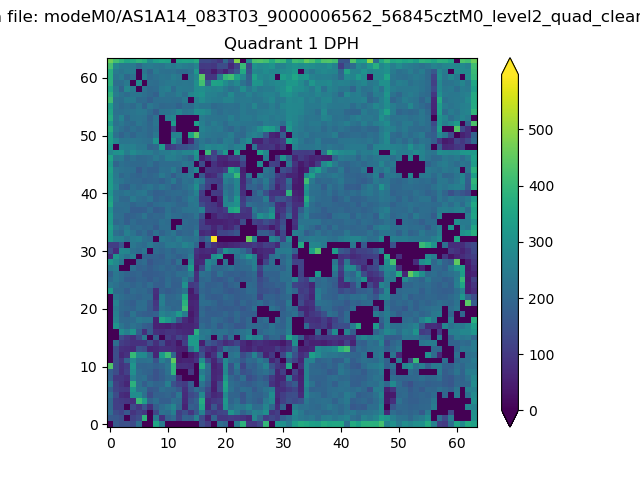 |
Quadrant B |
|---|---|---|---|
| Quadrant D | 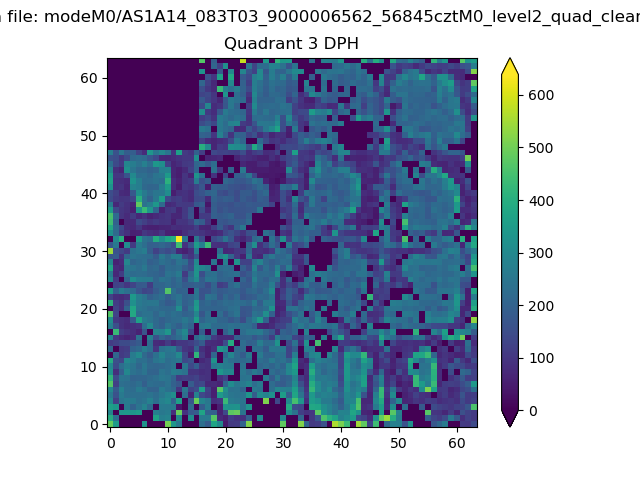 |
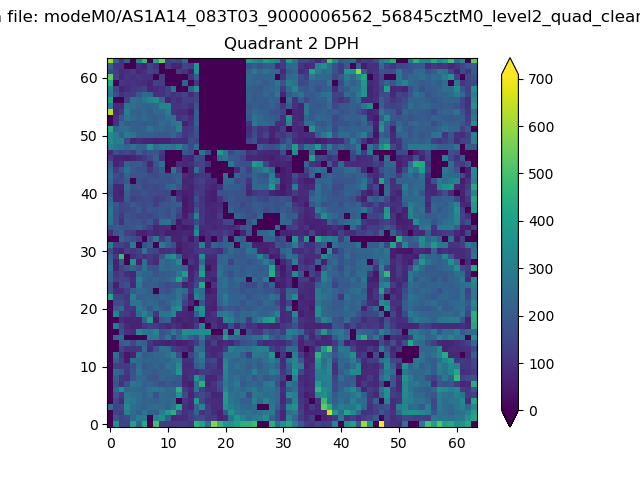 |
Quadrant C |
| Plot type | Count rate plots | Images |
|---|---|---|
| Comparison with Poisson distribution Blue bars denote a histogram of data divided into 1 sec bins. Red curve is a Poisson curve with rate = median count rate of data. |
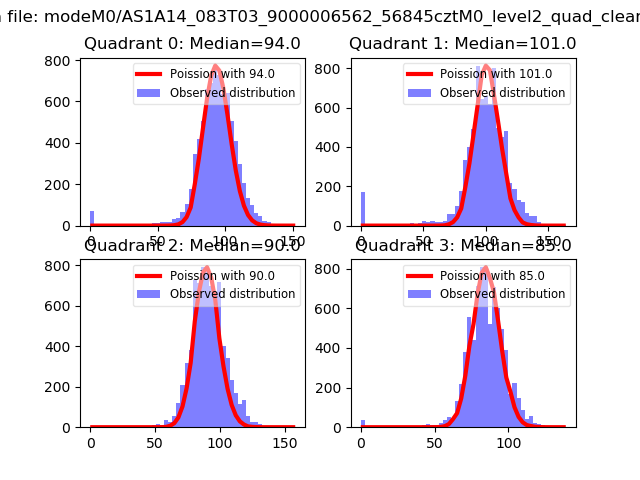 |
 |
| Quadrant-wise count rates Data is divided into 100 sec bins |
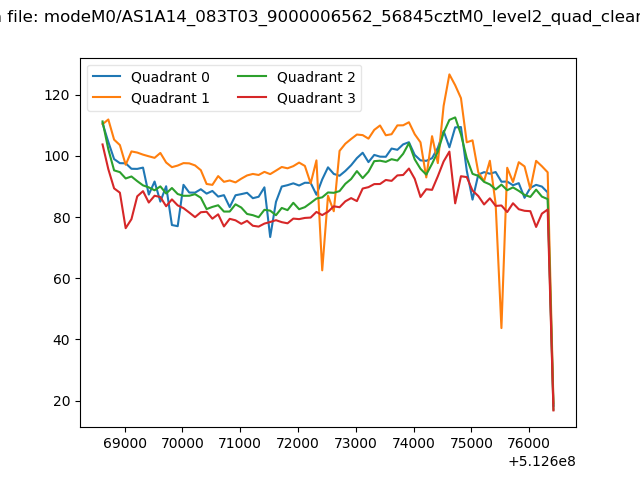 |
|
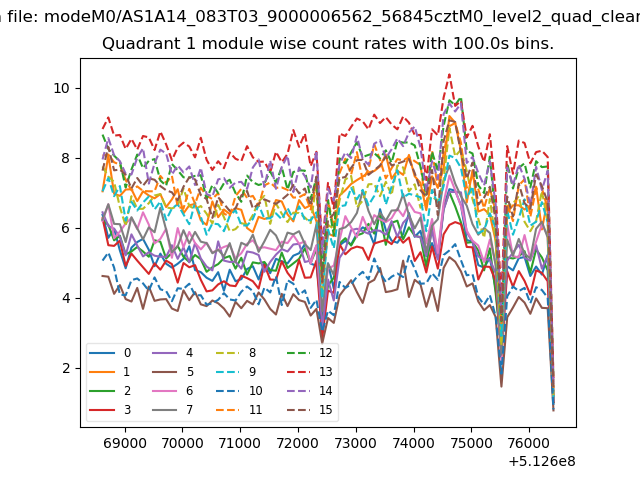
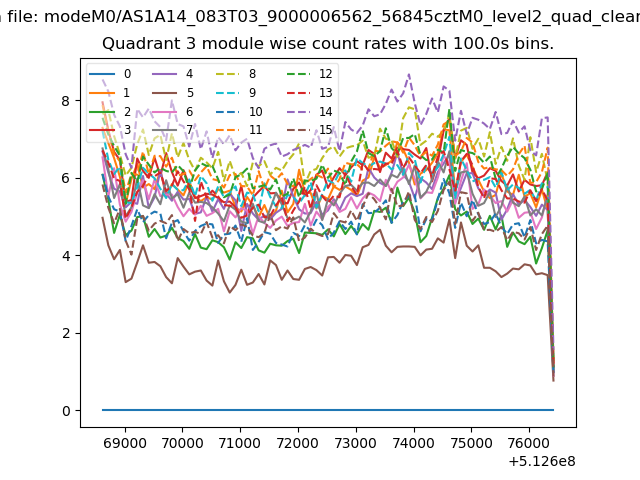
| Module-wise count rates for Quadrant A Data is divided into 100 sec bins |
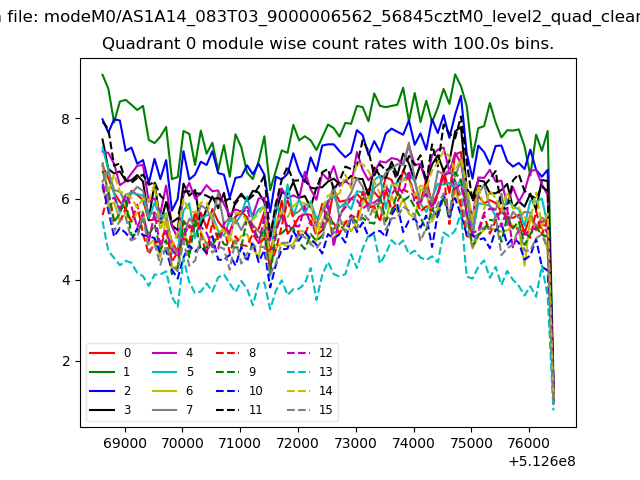 |
 |
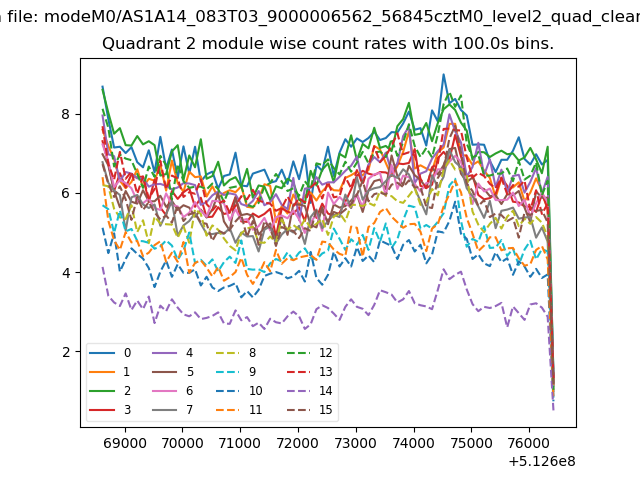
| Module-wise count rates for Quadrant B Data is divided into 100 sec bins |
 |
 |
| Module-wise count rates for Quadrant C Data is divided into 100 sec bins |
 |
 |
| Module-wise count rates for Quadrant D Data is divided into 100 sec bins |
 |
 |
| Parameter | Plot |
|---|---|
| CZT HV Monitor | 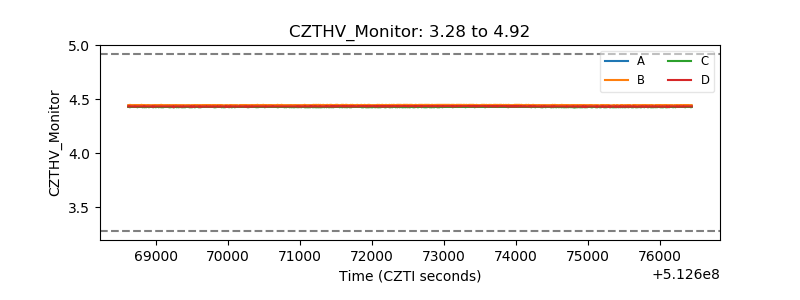 |
| D_VDD | 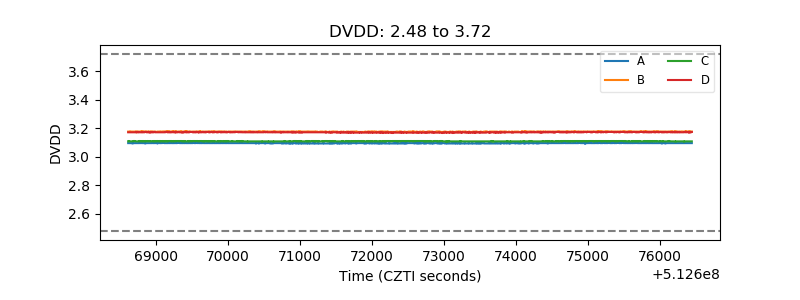 |
| Temperature 1 | 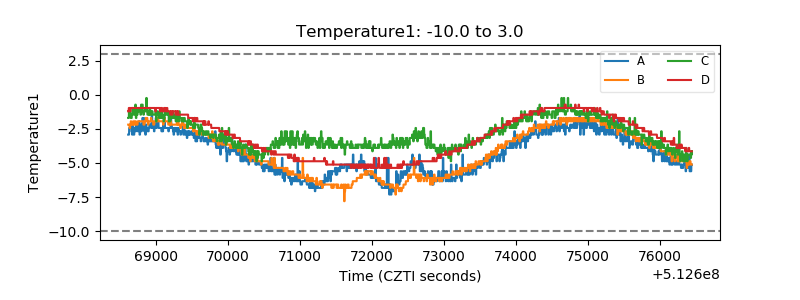 |
| Veto HV Monitor | 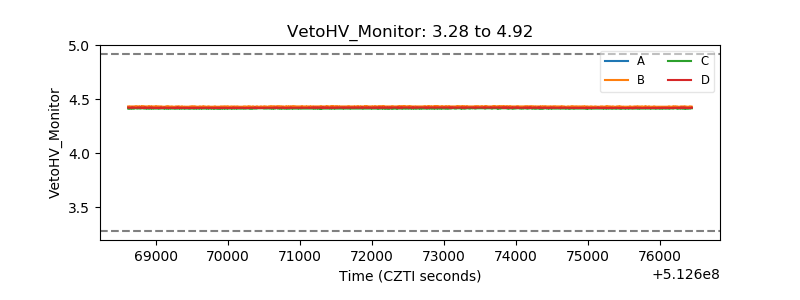 |
| Veto LLD | 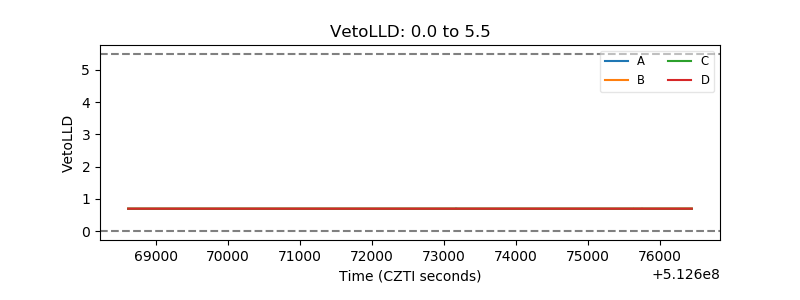 |
| Alpha Counter | 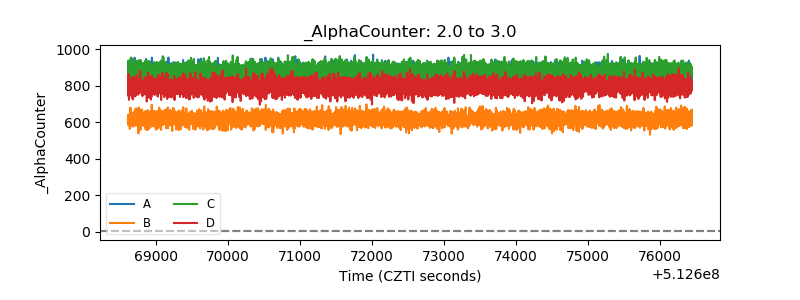 |
| _CPM_Rate | 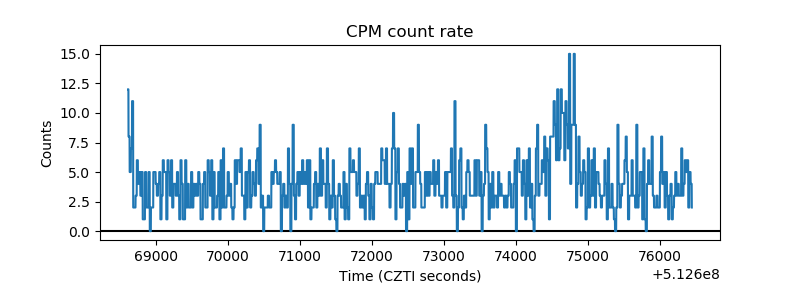 |
| CZT Counter | 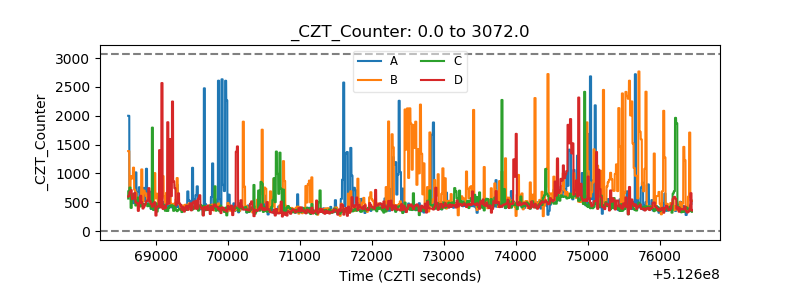 |
| +2.5 Volts monitor |  |
| +5 Volts monitor | 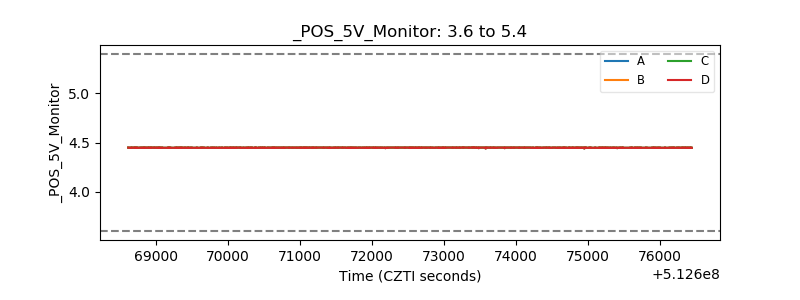 |
| _ROLL_ROT | 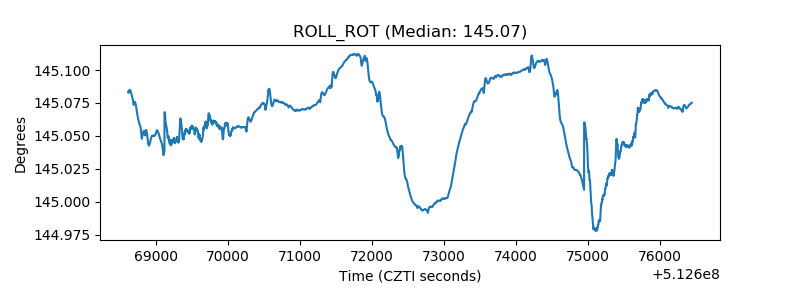 |
| _Roll_DEC | 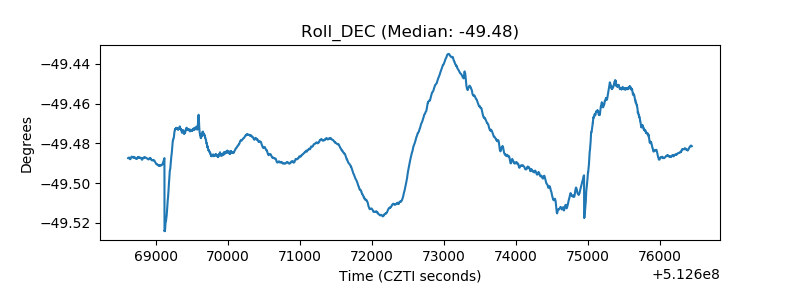 |
| _Roll_RA | 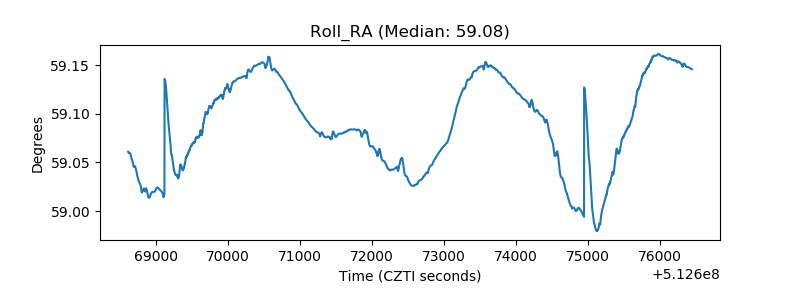 |
| Veto Counter | 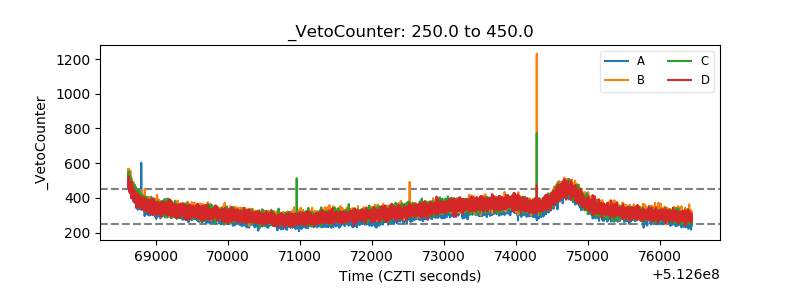 |