| Param | Original file | Final file |
|---|---|---|
| Filename | modeM0/AS1A14_083T03_9000006562_56846cztM0_level2.fits | modeM0/AS1A14_083T03_9000006562_56846cztM0_level2_quad_clean.evt |
| Size (bytes) | 494,326,080 | 114,670,080 |
| Size | 471.4 MB | 109.4 MB |
| Events in quadrant A | 4,068,185 | 743,082 |
| Events in quadrant B | 4,985,825 | 792,021 |
| Events in quadrant C | 3,550,126 | 721,156 |
| Events in quadrant D | 5,071,191 | 658,717 |
| Mode SS | |||
|---|---|---|---|
| Quadrant | BADHDUFLAG | Total packets | Discarded packets |
| A | 0 | 160 | 0 |
| B | 0 | 160 | 0 |
| C | 0 | 160 | 0 |
| D | 0 | 160 | 0 |
| Mode M0 | |||
|---|---|---|---|
| Quadrant | BADHDUFLAG | Total packets | Discarded packets |
| A | 0 | 18226 | 0 |
| B | 0 | 20483 | 0 |
| C | 0 | 16637 | 0 |
| D | 0 | 20770 | 0 |
| Quadrant | Total seconds | Saturated seconds | Saturation percentage |
|---|---|---|---|
| A | 8013 | 190 | 2.371147% |
| B | 8013 | 319 | 3.981031% |
| C | 8014 | 12 | 0.149738% |
| D | 8014 | 333 | 4.155228% |
Noise dominated data is calculated using 1-second bins in cleaned event files. If a bin has >2000 counts, and if more than 50% of those come from <1% of pixels, then it is considered to be noise-dominated and hence unusable.
| Quadrant | # 1 sec bins | Bins with >0 counts | Bins with >2000 counts | High rate bins dominated by noise | Noise dominated (total time) | Noise dominated (detector-on time) | Marked lightcurve |
|---|---|---|---|---|---|---|---|
| A | 8013 | 8013 | 129 | 129 | 1.61% | 1.61% | 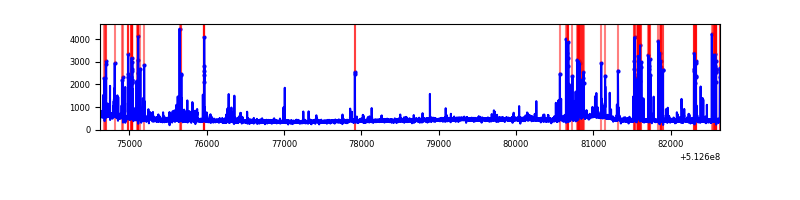 |
| B | 8013 | 8013 | 220 | 220 | 2.75% | 2.75% | 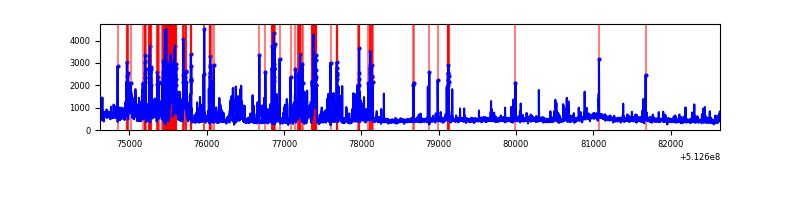 |
| C | 8014 | 8014 | 16 | 16 | 0.20% | 0.20% | 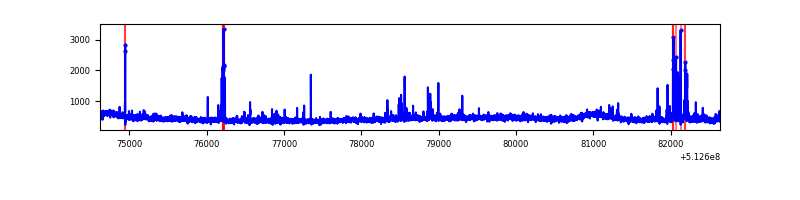 |
| D | 8014 | 8014 | 255 | 255 | 3.18% | 3.18% | 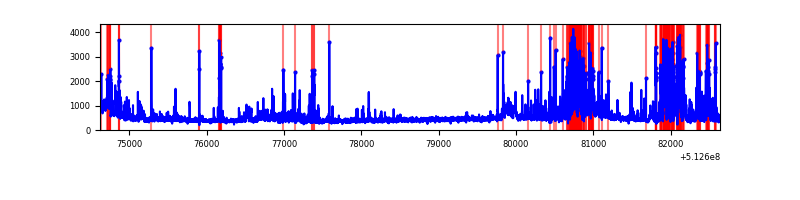 |
Top three noisy pixels from each quadrant. If the there are fewer than three noisy pixels in the level2.evt file, extra rows are filled as -1
| Pixel properties | Quadrant properties | ||||||
|---|---|---|---|---|---|---|---|
| Quadrant | DetID | PixID | Counts | Sigma | Mean | Median | Sigma |
| A | 3 | 62 | 330027 | 1552.78 | 855 | 834 | 212.0 |
| A | 10 | 251 | 271640 | 1277.37 | 855 | 834 | 212.0 |
| A | 4 | 13 | 64670 | 301.11 | 855 | 834 | 212.0 |
| B | 5 | 185 | 1351392 | 7452.17 | 843 | 812 | 181.2 |
| B | 0 | 245 | 77663 | 424.04 | 843 | 812 | 181.2 |
| B | 10 | 247 | 57156 | 310.89 | 843 | 812 | 181.2 |
| C | 12 | 252 | 143825 | 628.04 | 831 | 819 | 227.7 |
| C | 14 | 254 | 32082 | 137.3 | 831 | 819 | 227.7 |
| C | 11 | 244 | 23123 | 97.95 | 831 | 819 | 227.7 |
| D | 8 | 240 | 779553 | 3408.11 | 814 | 779 | 228.5 |
| D | 2 | 249 | 590296 | 2579.88 | 814 | 779 | 228.5 |
| D | 2 | 120 | 128468 | 558.8 | 814 | 779 | 228.5 |
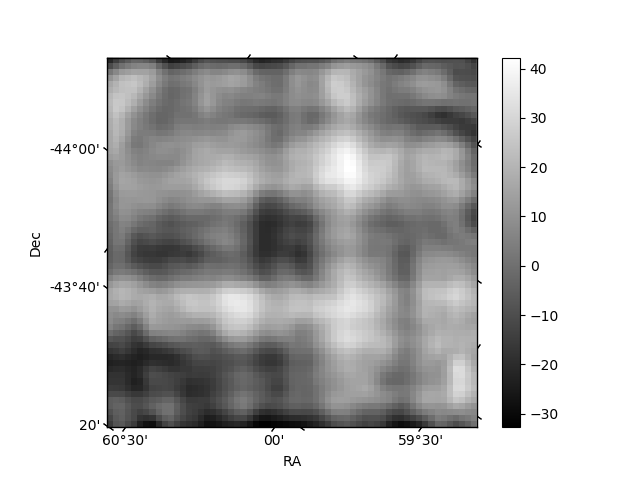
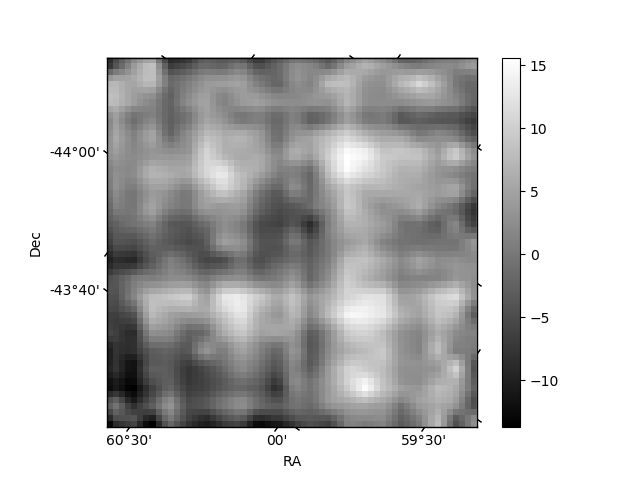
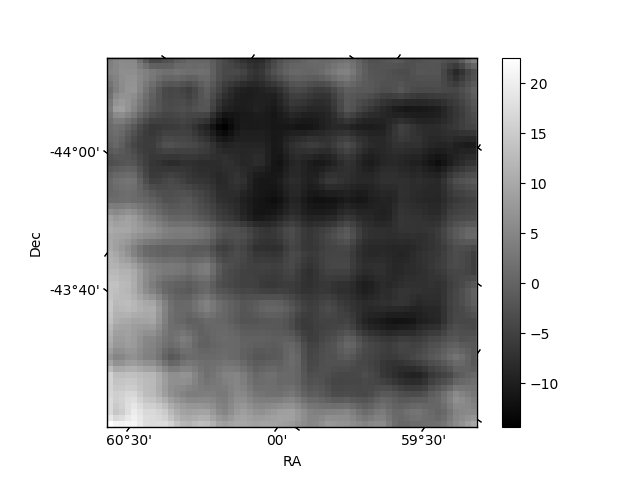
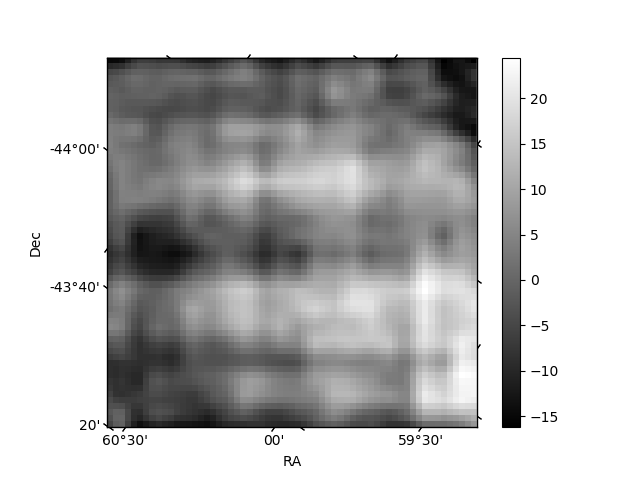
Histogram calculated using DETX and DETY for each event in the final _common_clean file
| Quadrant A | 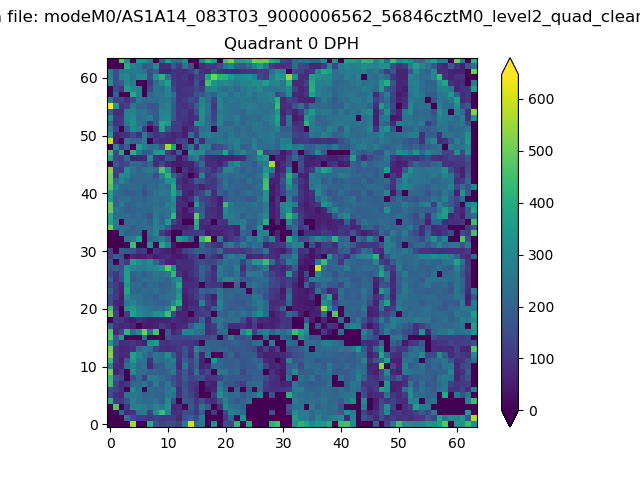 |
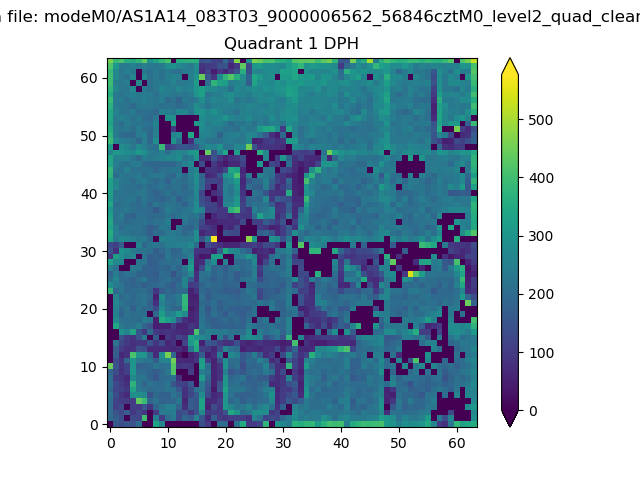 |
Quadrant B |
|---|---|---|---|
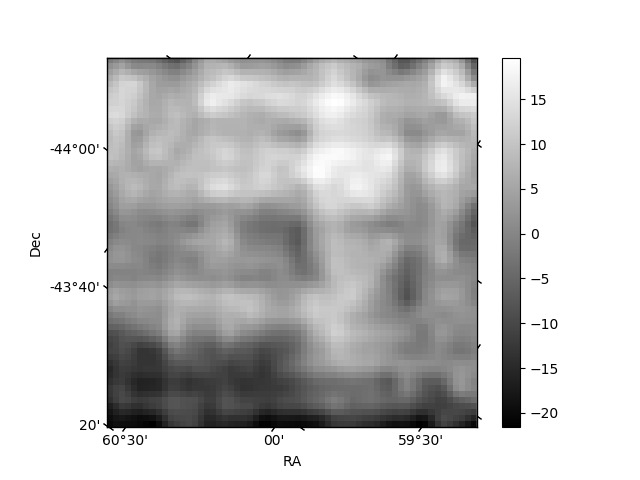
| Quadrant D | 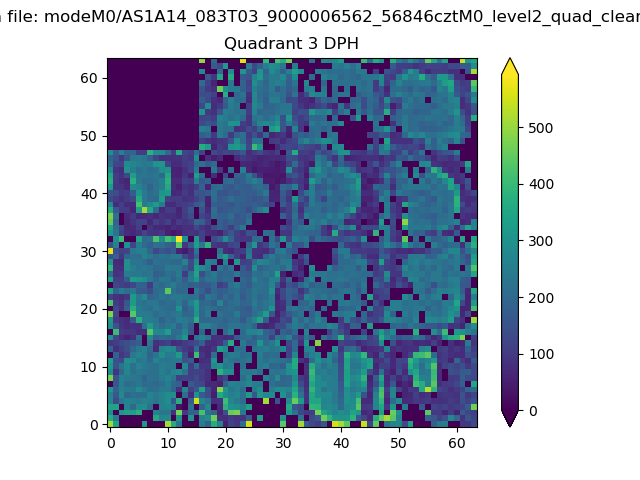 |
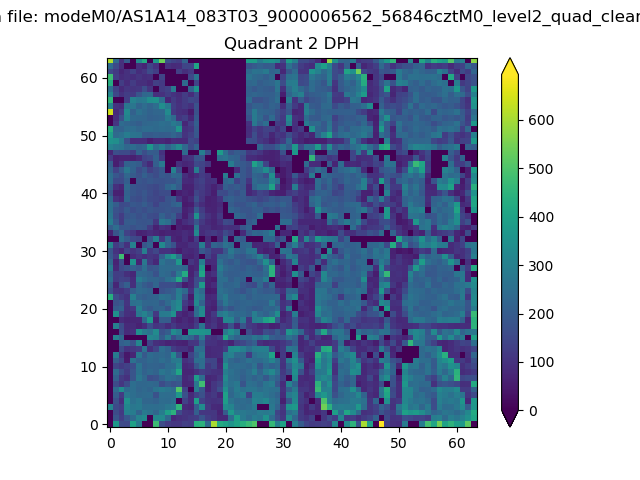 |
Quadrant C |
| Plot type | Count rate plots | Images |
|---|---|---|
| Comparison with Poisson distribution Blue bars denote a histogram of data divided into 1 sec bins. Red curve is a Poisson curve with rate = median count rate of data. |
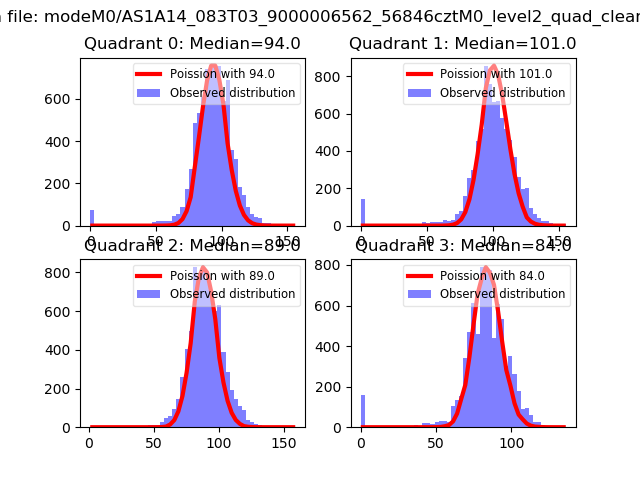 |
 |
| Quadrant-wise count rates Data is divided into 100 sec bins |
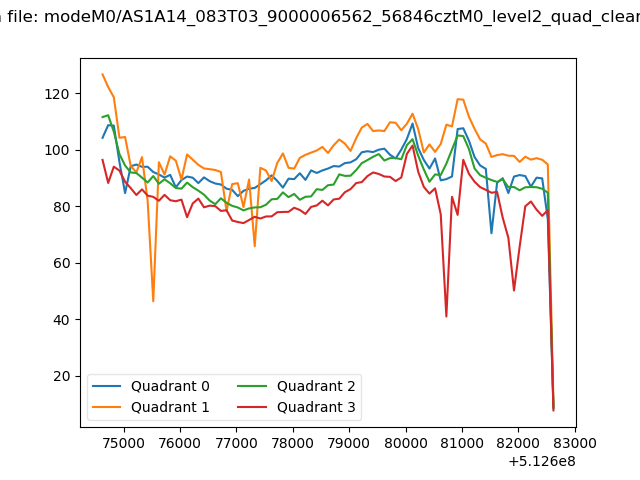 |
|
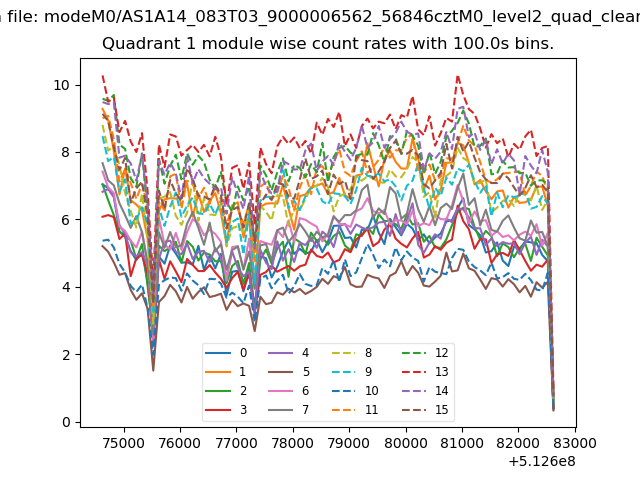
| Module-wise count rates for Quadrant A Data is divided into 100 sec bins |
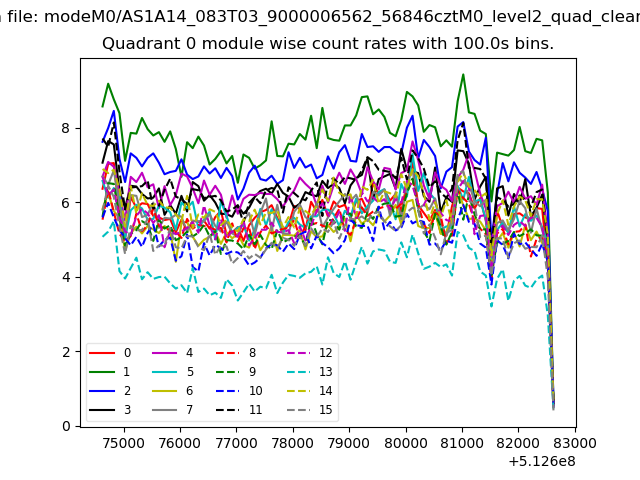 |
 |
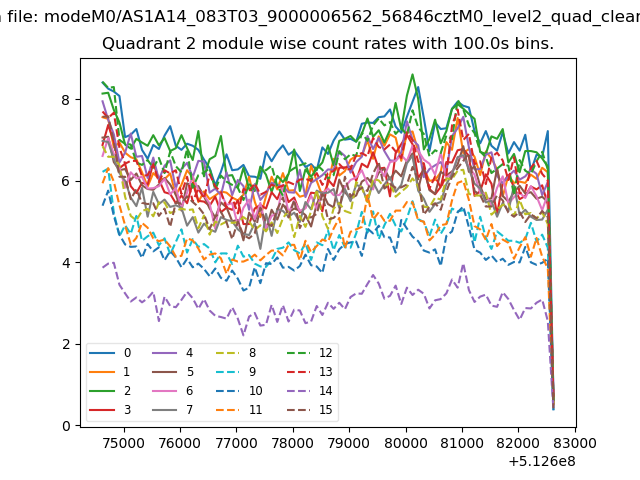
| Module-wise count rates for Quadrant B Data is divided into 100 sec bins |
 |
 |
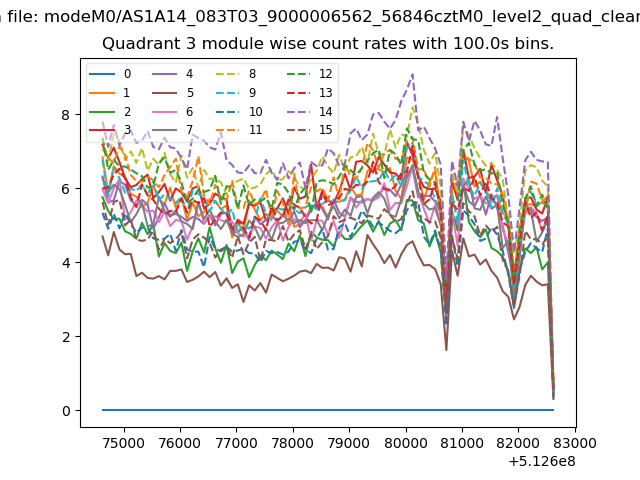
| Module-wise count rates for Quadrant C Data is divided into 100 sec bins |
 |
 |
| Module-wise count rates for Quadrant D Data is divided into 100 sec bins |
 |
 |
| Parameter | Plot |
|---|---|
| CZT HV Monitor | 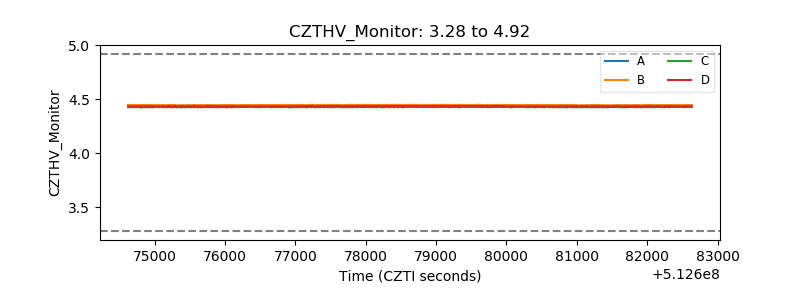 |
| D_VDD | 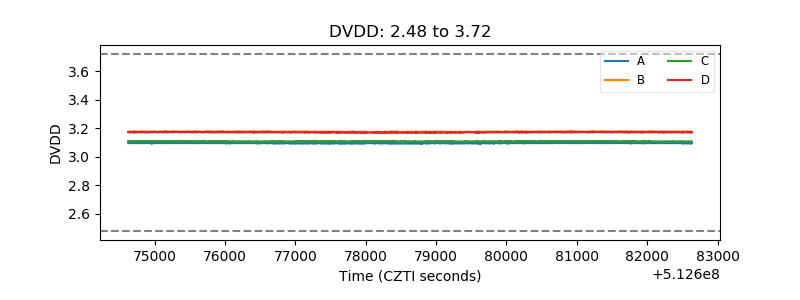 |
| Temperature 1 | 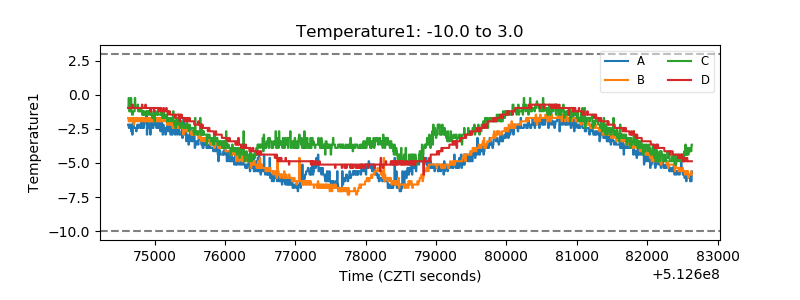 |
| Veto HV Monitor | 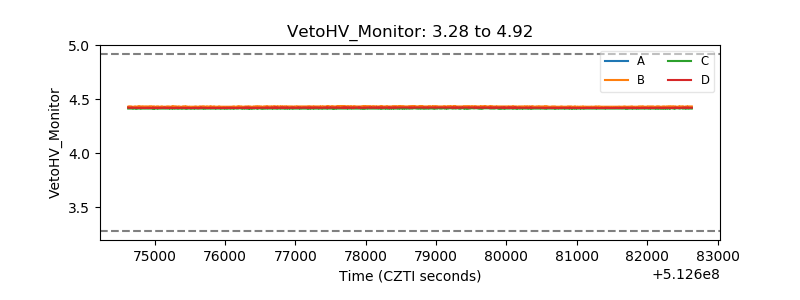 |
| Veto LLD | 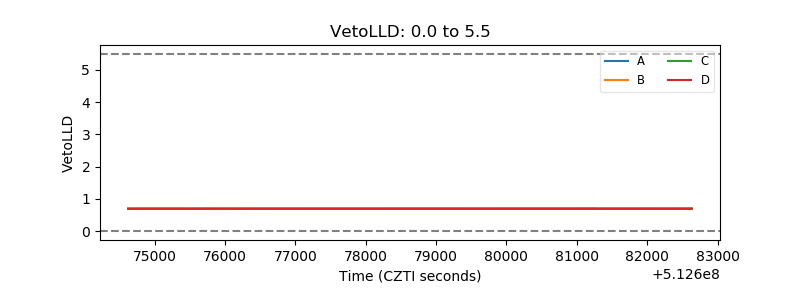 |
| Alpha Counter | 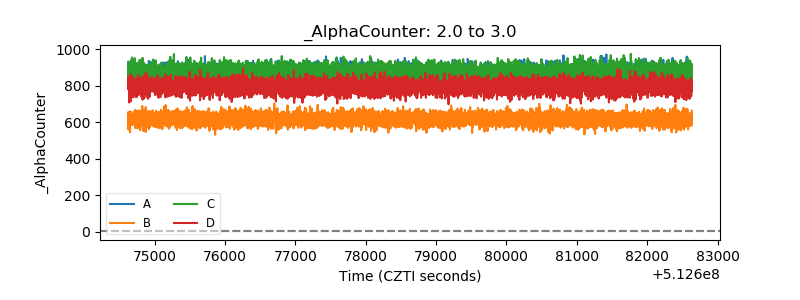 |
| _CPM_Rate | 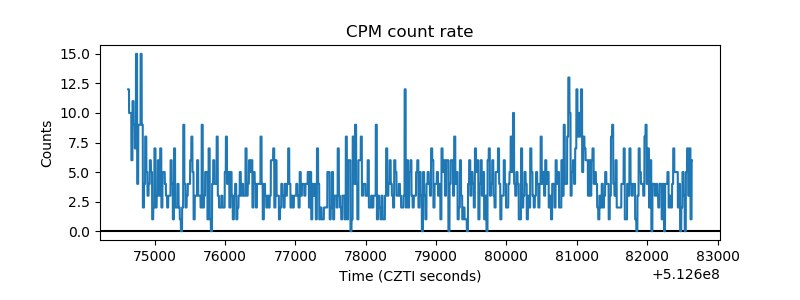 |
| CZT Counter | 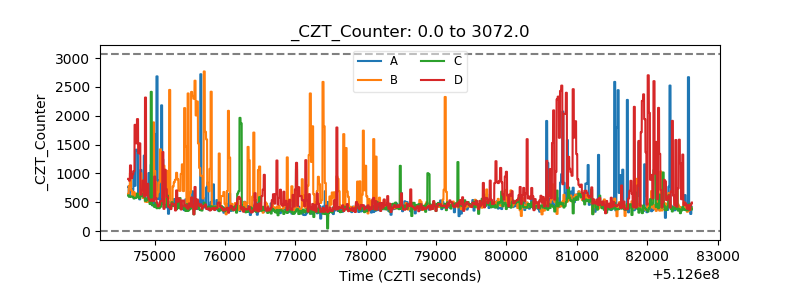 |
| +2.5 Volts monitor |  |
| +5 Volts monitor | 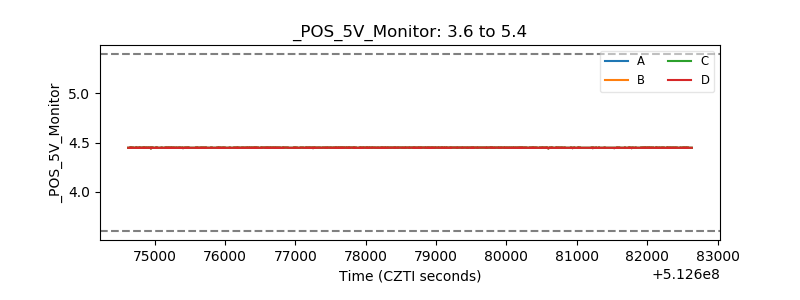 |
| _ROLL_ROT | 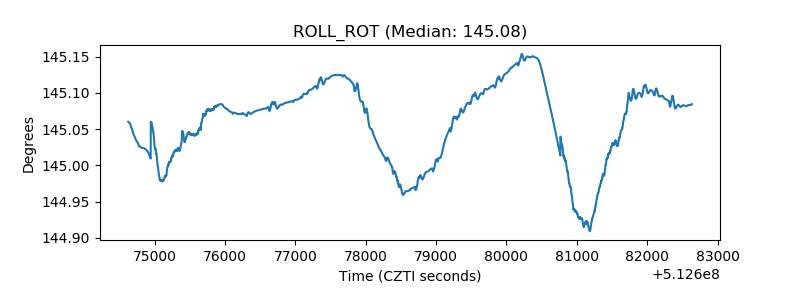 |
| _Roll_DEC | 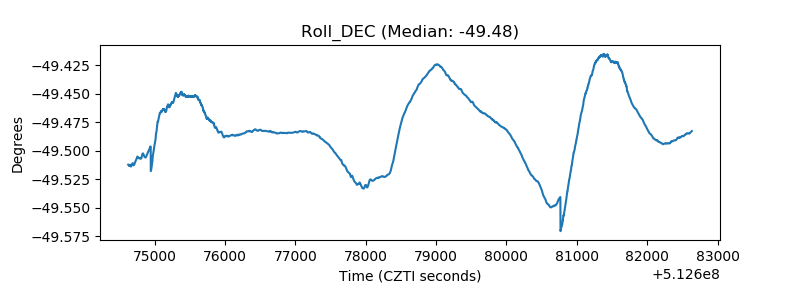 |
| _Roll_RA | 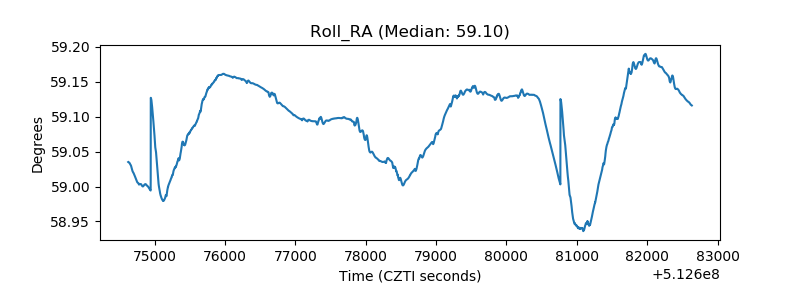 |
| Veto Counter | 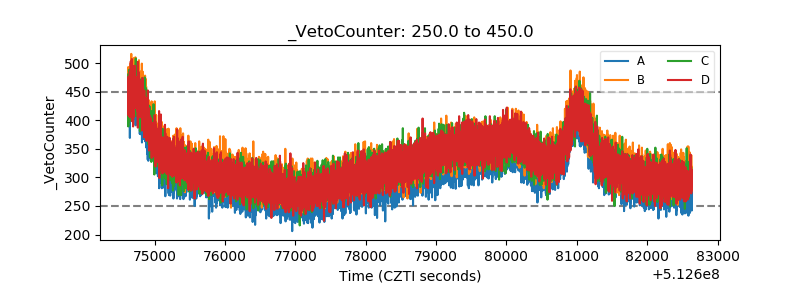 |