| Param | Original file | Final file |
|---|---|---|
| Filename | modeM0/AS1A14_083T03_9000006562_56847cztM0_level2.fits | modeM0/AS1A14_083T03_9000006562_56847cztM0_level2_quad_clean.evt |
| Size (bytes) | 531,688,320 | 118,874,880 |
| Size | 507.1 MB | 113.4 MB |
| Events in quadrant A | 4,766,197 | 763,891 |
| Events in quadrant B | 4,168,639 | 833,559 |
| Events in quadrant C | 3,876,421 | 746,772 |
| Events in quadrant D | 6,220,234 | 674,316 |
| Mode M9 | |||
|---|---|---|---|
| Quadrant | BADHDUFLAG | Total packets | Discarded packets |
| A | 0 | 1 | 0 |
| B | 0 | 1 | 0 |
| C | 0 | 1 | 0 |
| D | 0 | 1 | 0 |
| Mode SS | |||
|---|---|---|---|
| Quadrant | BADHDUFLAG | Total packets | Discarded packets |
| A | 0 | 168 | 0 |
| B | 0 | 168 | 0 |
| C | 0 | 168 | 0 |
| D | 0 | 168 | 0 |
| Mode M0 | |||
|---|---|---|---|
| Quadrant | BADHDUFLAG | Total packets | Discarded packets |
| A | 0 | 20450 | 1 |
| B | 0 | 18445 | 1 |
| C | 0 | 17814 | 1 |
| D | 0 | 24370 | 1 |
| Quadrant | Total seconds | Saturated seconds | Saturation percentage |
|---|---|---|---|
| A | 8363 | 329 | 3.933995% |
| B | 8364 | 171 | 2.044476% |
| C | 8364 | 57 | 0.681492% |
| D | 8363 | 542 | 6.480928% |
Noise dominated data is calculated using 1-second bins in cleaned event files. If a bin has >2000 counts, and if more than 50% of those come from <1% of pixels, then it is considered to be noise-dominated and hence unusable.
| Quadrant | # 1 sec bins | Bins with >0 counts | Bins with >2000 counts | High rate bins dominated by noise | Noise dominated (total time) | Noise dominated (detector-on time) | Marked lightcurve |
|---|---|---|---|---|---|---|---|
| A | 8378 | 8364 | 248 | 248 | 2.96% | 2.97% | 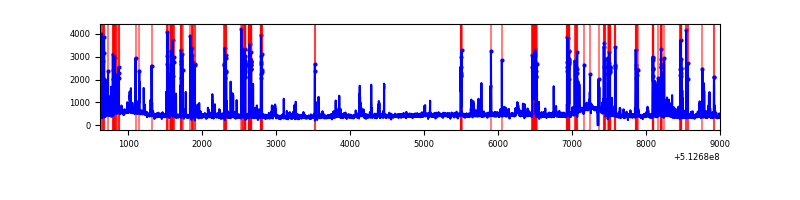 |
| B | 8379 | 8365 | 69 | 69 | 0.82% | 0.82% | 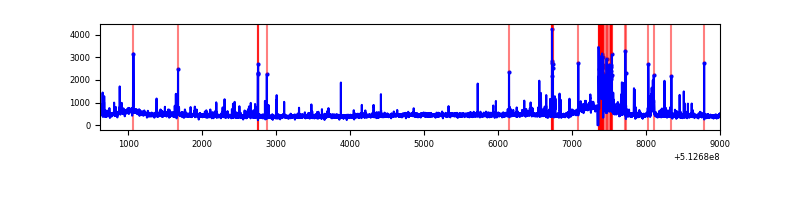 |
| C | 8379 | 8365 | 40 | 40 | 0.48% | 0.48% | 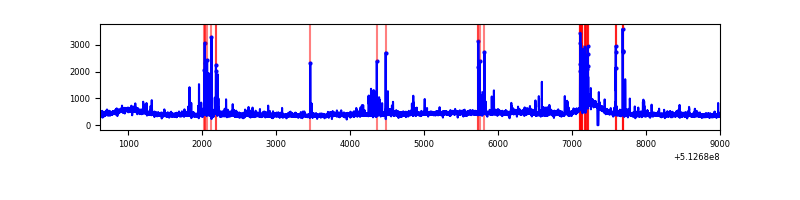 |
| D | 8378 | 8364 | 432 | 432 | 5.16% | 5.16% | 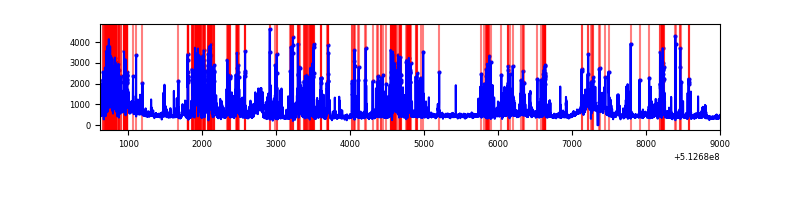 |
Top three noisy pixels from each quadrant. If the there are fewer than three noisy pixels in the level2.evt file, extra rows are filled as -1
| Pixel properties | Quadrant properties | ||||||
|---|---|---|---|---|---|---|---|
| Quadrant | DetID | PixID | Counts | Sigma | Mean | Median | Sigma |
| A | 3 | 62 | 810684 | 3643.84 | 897 | 877 | 222.2 |
| A | 10 | 251 | 200825 | 899.69 | 897 | 877 | 222.2 |
| A | 7 | 64 | 145251 | 649.63 | 897 | 877 | 222.2 |
| B | 10 | 16 | 172529 | 884.34 | 894 | 862 | 194.1 |
| B | 5 | 185 | 136907 | 700.83 | 894 | 862 | 194.1 |
| B | 0 | 245 | 68219 | 346.99 | 894 | 862 | 194.1 |
| C | 13 | 3 | 116104 | 477.36 | 877 | 867 | 241.4 |
| C | 14 | 254 | 109235 | 448.91 | 877 | 867 | 241.4 |
| C | 12 | 252 | 86666 | 355.42 | 877 | 867 | 241.4 |
| D | 8 | 240 | 1744457 | 7371.57 | 849 | 813 | 236.5 |
| D | 2 | 249 | 694095 | 2930.97 | 849 | 813 | 236.5 |
| D | 2 | 31 | 141386 | 594.3 | 849 | 813 | 236.5 |
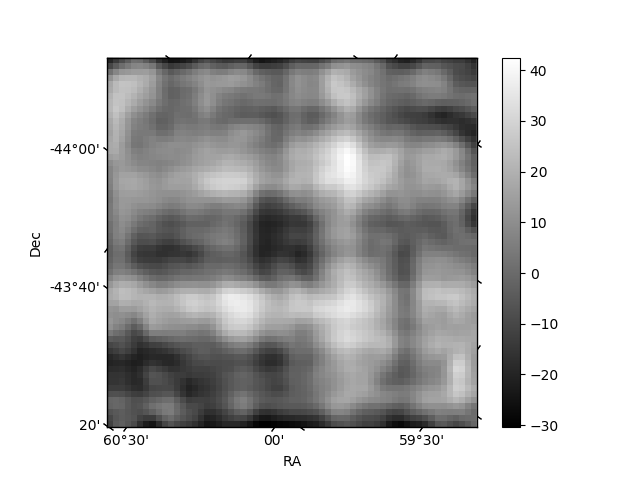
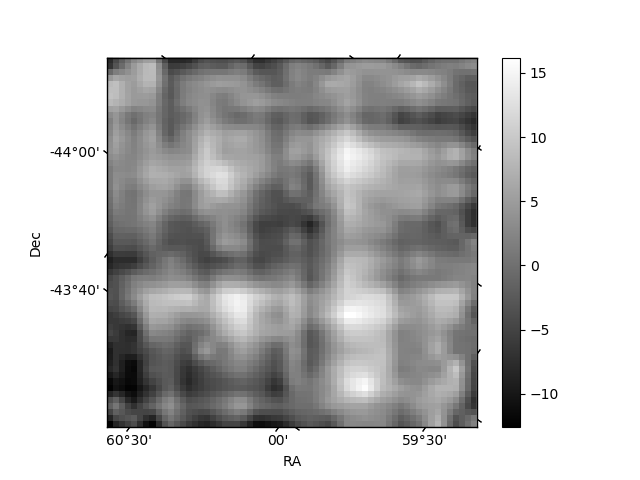
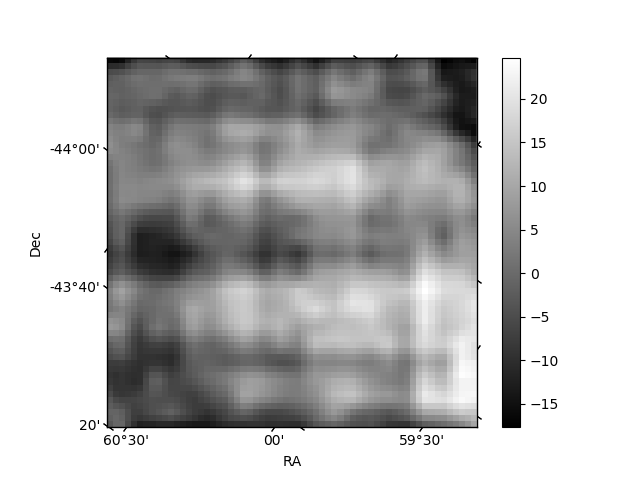
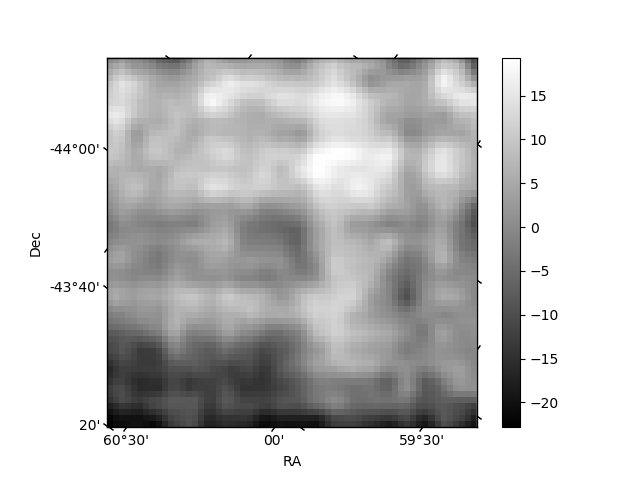
Histogram calculated using DETX and DETY for each event in the final _common_clean file
| Quadrant A | 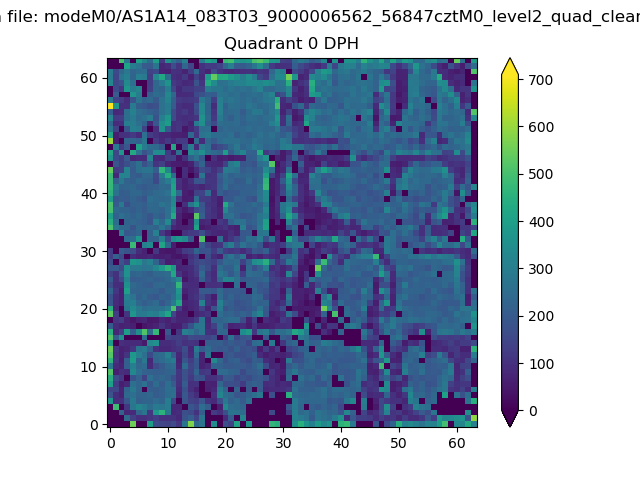 |
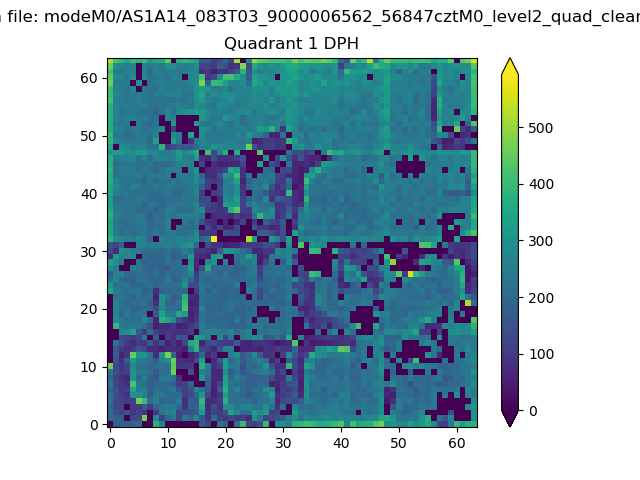 |
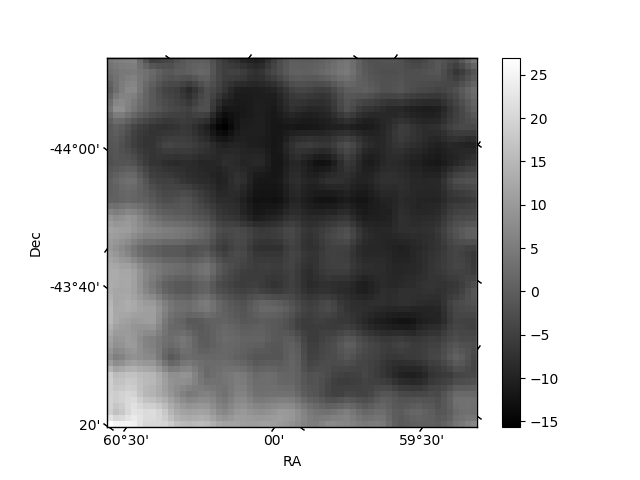
Quadrant B |
|---|---|---|---|
| Quadrant D | 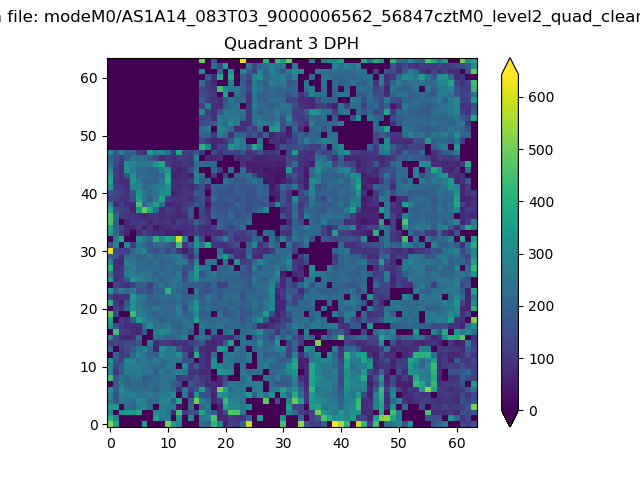 |
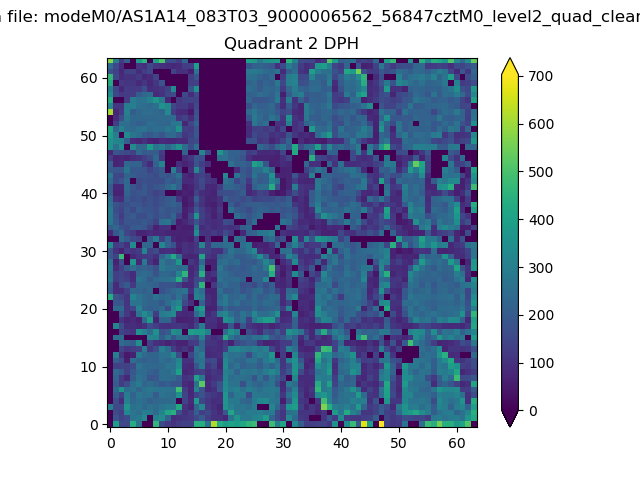 |
Quadrant C |
| Plot type | Count rate plots | Images |
|---|---|---|
| Comparison with Poisson distribution Blue bars denote a histogram of data divided into 1 sec bins. Red curve is a Poisson curve with rate = median count rate of data. |
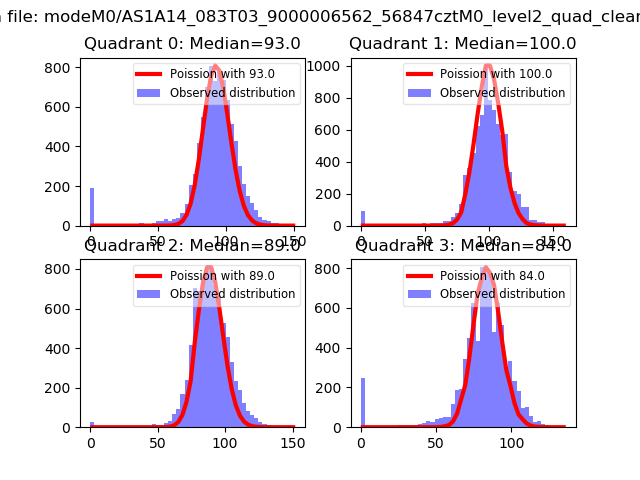 |
 |
| Quadrant-wise count rates Data is divided into 100 sec bins |
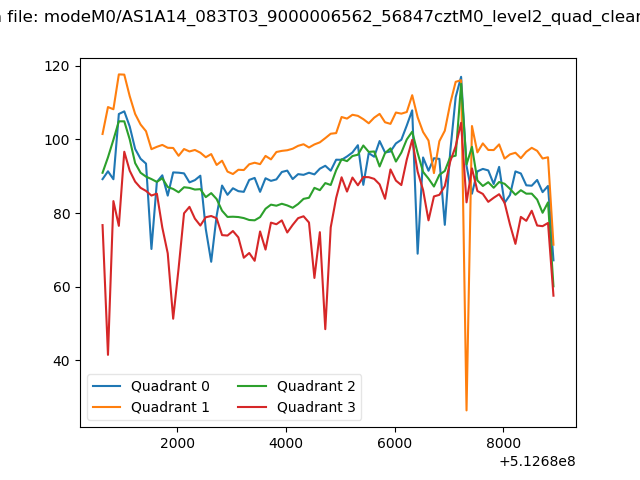 |
|
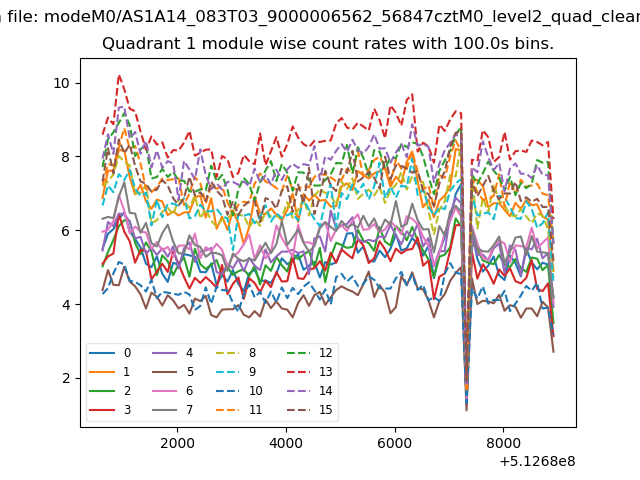
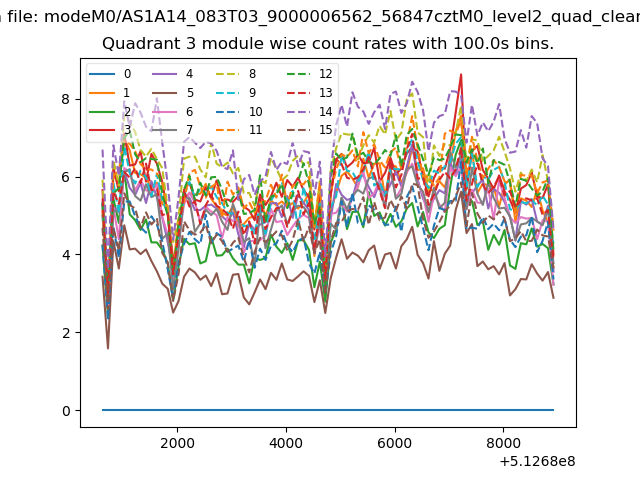
| Module-wise count rates for Quadrant A Data is divided into 100 sec bins |
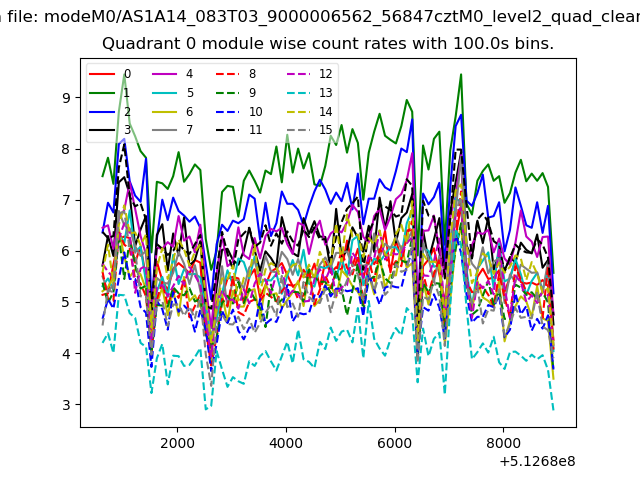 |
 |
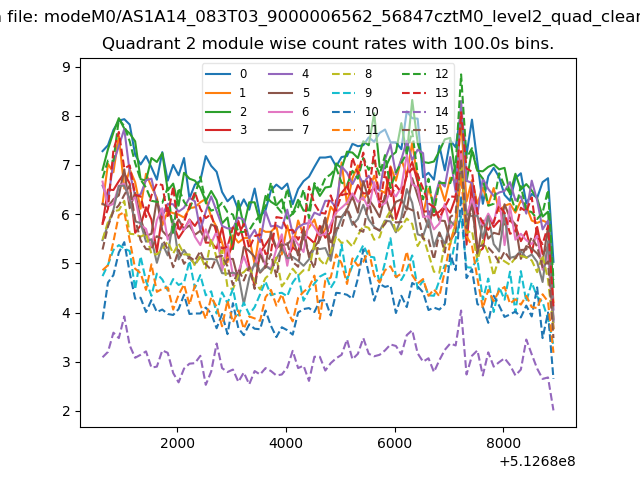
| Module-wise count rates for Quadrant B Data is divided into 100 sec bins |
 |
 |
| Module-wise count rates for Quadrant C Data is divided into 100 sec bins |
 |
 |
| Module-wise count rates for Quadrant D Data is divided into 100 sec bins |
 |
 |
| Parameter | Plot |
|---|---|
| CZT HV Monitor | 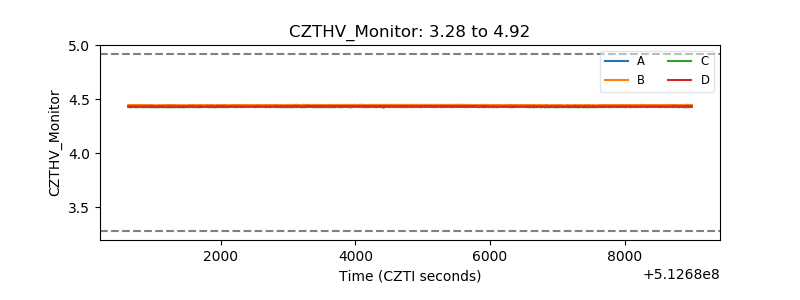 |
| D_VDD | 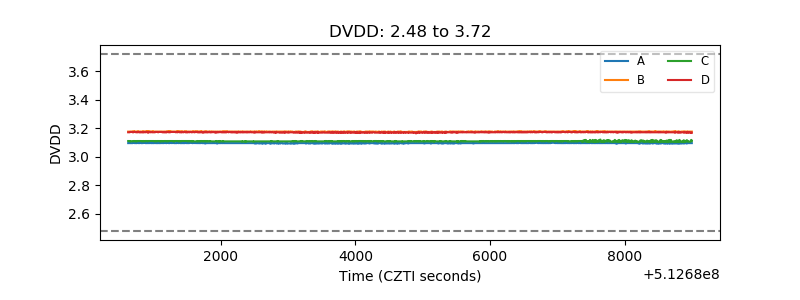 |
| Temperature 1 | 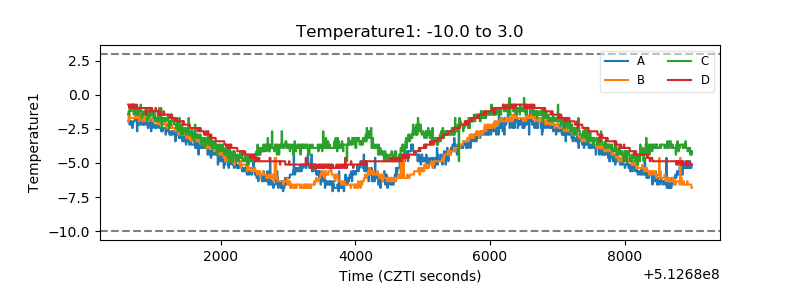 |
| Veto HV Monitor | 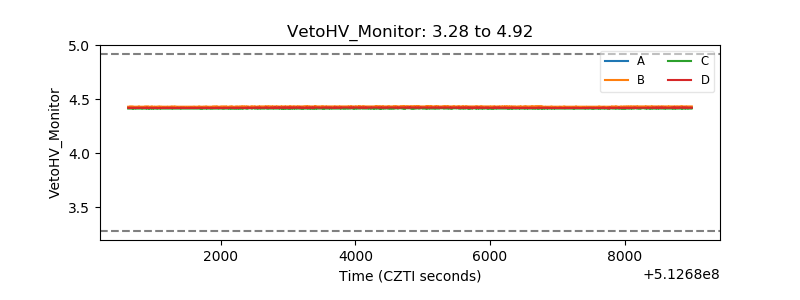 |
| Veto LLD | 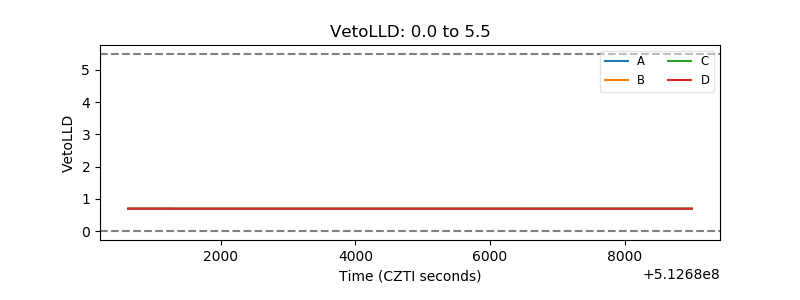 |
| Alpha Counter | 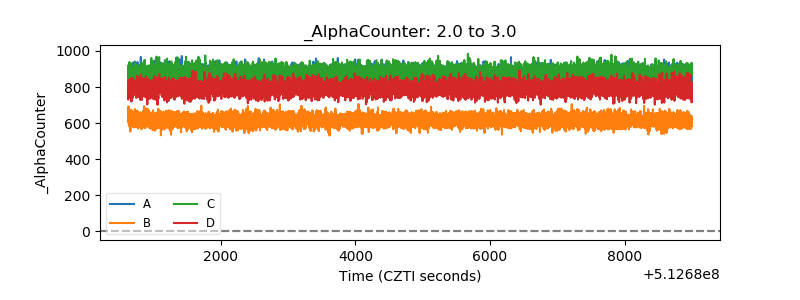 |
| _CPM_Rate | 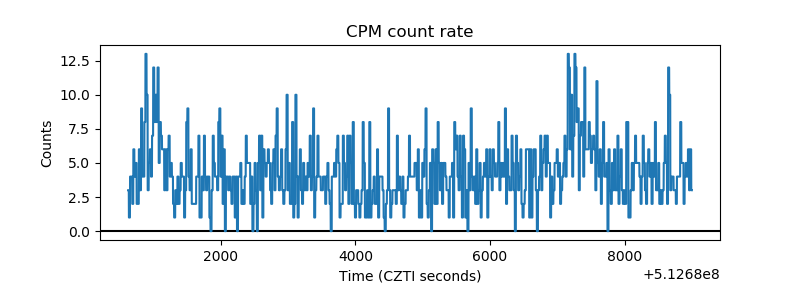 |
| CZT Counter | 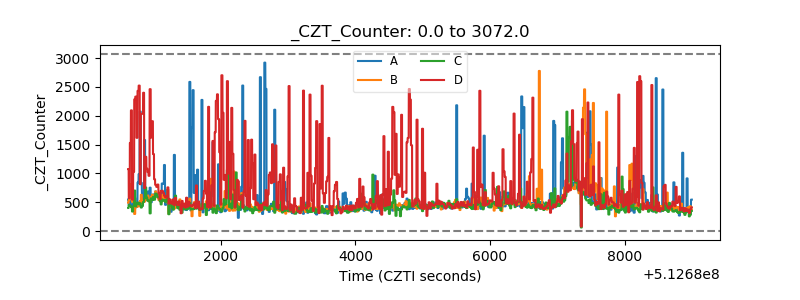 |
| +2.5 Volts monitor |  |
| +5 Volts monitor | 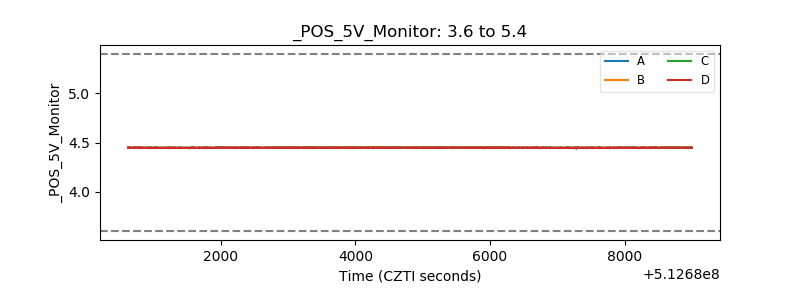 |
| _ROLL_ROT | 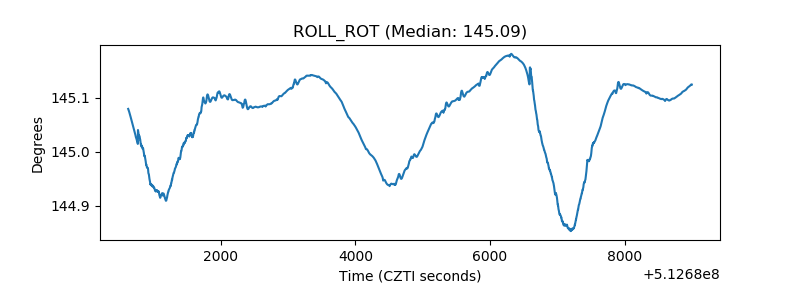 |
| _Roll_DEC | 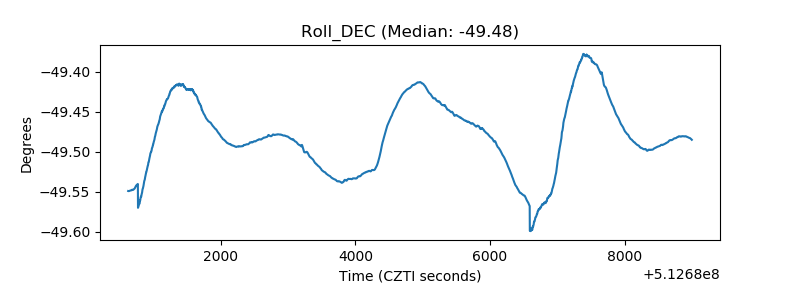 |
| _Roll_RA | 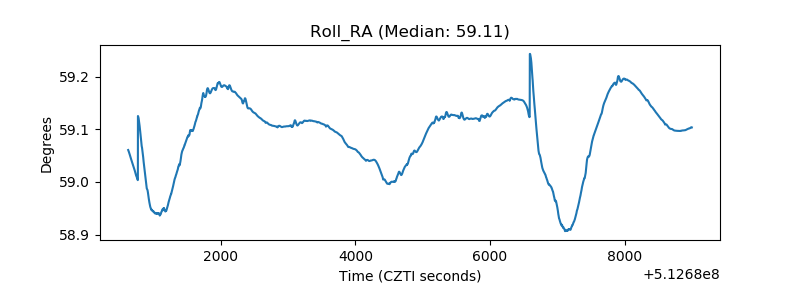 |
| Veto Counter | 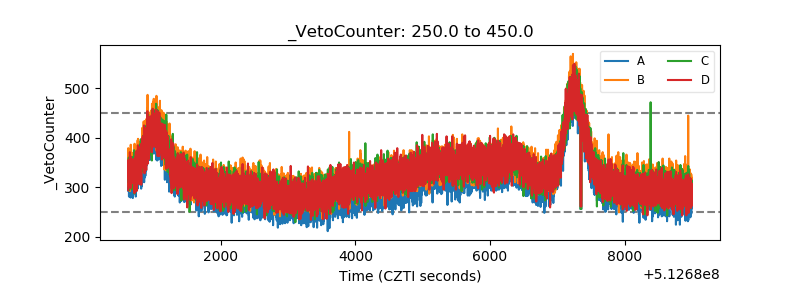 |