| Param | Original file | Final file |
|---|---|---|
| Filename | modeM0/AS1A14_083T03_9000006562_56850cztM0_level2.fits | modeM0/AS1A14_083T03_9000006562_56850cztM0_level2_quad_clean.evt |
| Size (bytes) | 1,129,440,960 | 262,972,800 |
| Size | 1.1 GB | 250.8 MB |
| Events in quadrant A | 9,827,223 | 1,712,212 |
| Events in quadrant B | 9,849,998 | 1,812,919 |
| Events in quadrant C | 8,616,759 | 1,640,266 |
| Events in quadrant D | 12,053,643 | 1,497,818 |
| Mode M9 | |||
|---|---|---|---|
| Quadrant | BADHDUFLAG | Total packets | Discarded packets |
| A | 0 | 16 | 0 |
| B | 0 | 16 | 0 |
| C | 0 | 16 | 0 |
| D | 0 | 16 | 0 |
| Mode SS | |||
|---|---|---|---|
| Quadrant | BADHDUFLAG | Total packets | Discarded packets |
| A | 0 | 386 | 0 |
| B | 0 | 386 | 0 |
| C | 0 | 386 | 0 |
| D | 0 | 386 | 0 |
| Mode M0 | |||
|---|---|---|---|
| Quadrant | BADHDUFLAG | Total packets | Discarded packets |
| A | 0 | 43438 | 4 |
| B | 0 | 43027 | 4 |
| C | 0 | 40006 | 4 |
| D | 0 | 49432 | 4 |
| Quadrant | Total seconds | Saturated seconds | Saturation percentage |
|---|---|---|---|
| A | 18843 | 479 | 2.542058% |
| B | 18844 | 642 | 3.406920% |
| C | 18844 | 180 | 0.955211% |
| D | 18844 | 917 | 4.866270% |
Noise dominated data is calculated using 1-second bins in cleaned event files. If a bin has >2000 counts, and if more than 50% of those come from <1% of pixels, then it is considered to be noise-dominated and hence unusable.
| Quadrant | # 1 sec bins | Bins with >0 counts | Bins with >2000 counts | High rate bins dominated by noise | Noise dominated (total time) | Noise dominated (detector-on time) | Marked lightcurve |
|---|---|---|---|---|---|---|---|
| A | 20518 | 18847 | 305 | 305 | 1.49% | 1.62% | 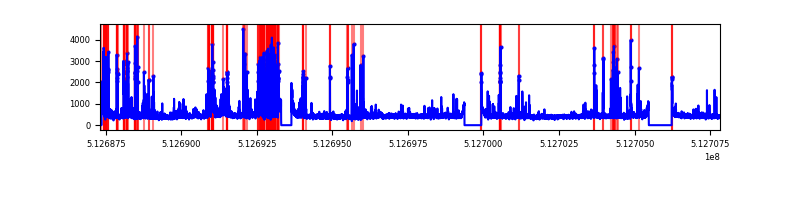 |
| B | 20519 | 18848 | 317 | 317 | 1.54% | 1.68% | 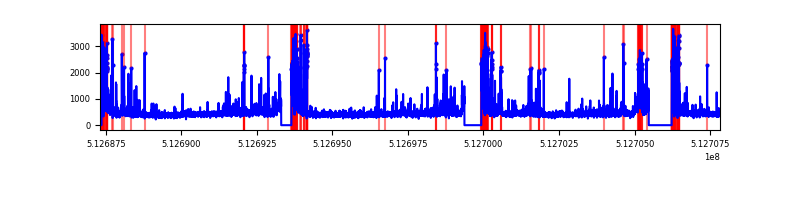 |
| C | 20519 | 18848 | 78 | 78 | 0.38% | 0.41% | 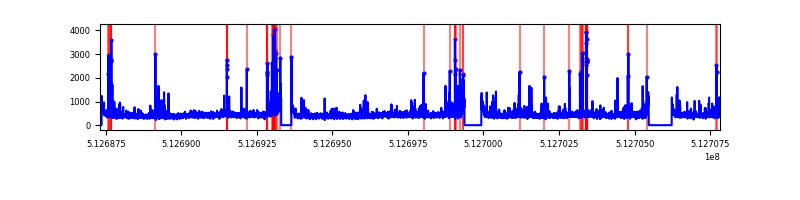 |
| D | 20519 | 18848 | 717 | 717 | 3.49% | 3.80% | 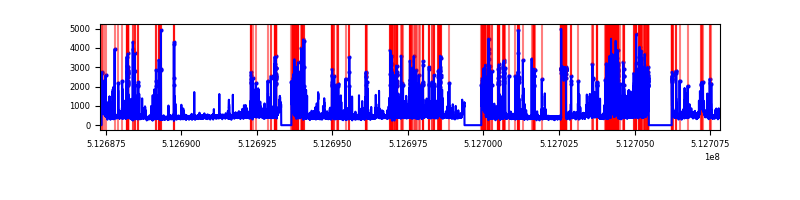 |
Top three noisy pixels from each quadrant. If the there are fewer than three noisy pixels in the level2.evt file, extra rows are filled as -1
| Pixel properties | Quadrant properties | ||||||
|---|---|---|---|---|---|---|---|
| Quadrant | DetID | PixID | Counts | Sigma | Mean | Median | Sigma |
| A | 7 | 64 | 902261 | 1834.49 | 1993 | 1942 | 490.8 |
| A | 12 | 3 | 344490 | 697.97 | 1993 | 1942 | 490.8 |
| A | 3 | 62 | 341186 | 691.24 | 1993 | 1942 | 490.8 |
| B | 10 | 16 | 930460 | 2213.52 | 1953 | 1877 | 419.5 |
| B | 5 | 185 | 444395 | 1054.86 | 1953 | 1877 | 419.5 |
| B | 10 | 32 | 166460 | 392.33 | 1953 | 1877 | 419.5 |
| C | 13 | 3 | 308808 | 573.4 | 1955 | 1935 | 535.2 |
| C | 14 | 254 | 182767 | 337.89 | 1955 | 1935 | 535.2 |
| C | 12 | 252 | 135104 | 248.83 | 1955 | 1935 | 535.2 |
| D | 8 | 240 | 2171783 | 4084.7 | 1899 | 1816 | 531.2 |
| D | 2 | 249 | 1343518 | 2525.59 | 1899 | 1816 | 531.2 |
| D | 0 | 160 | 214036 | 399.48 | 1899 | 1816 | 531.2 |
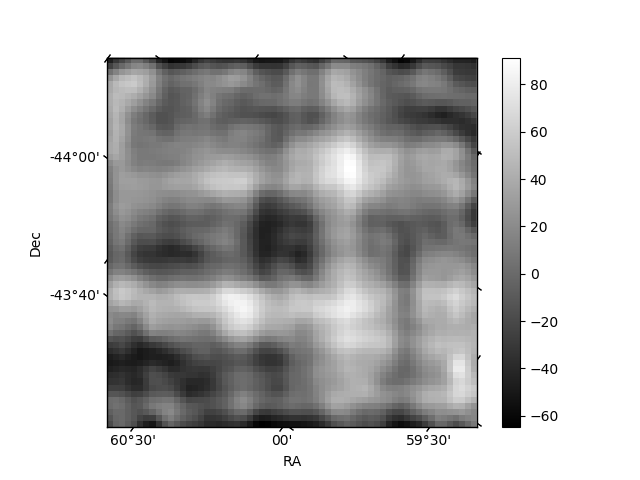
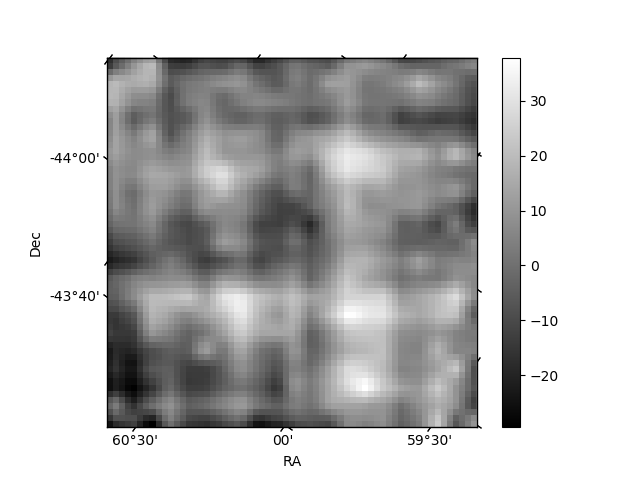
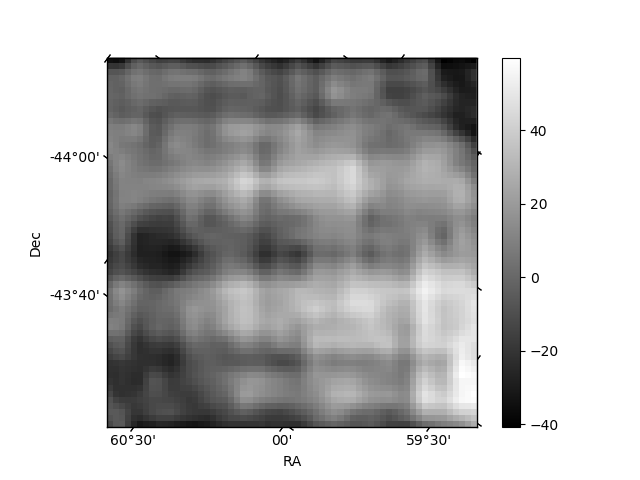
Histogram calculated using DETX and DETY for each event in the final _common_clean file
| Quadrant A | 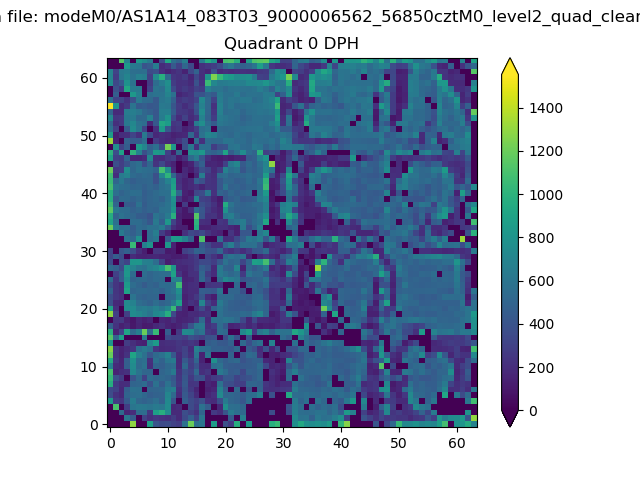 |
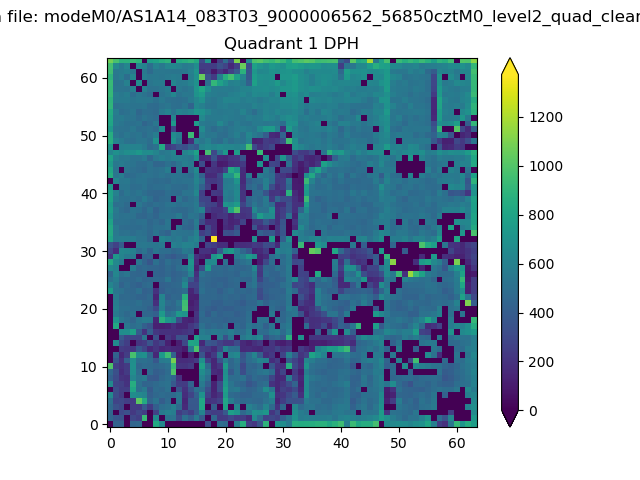 |
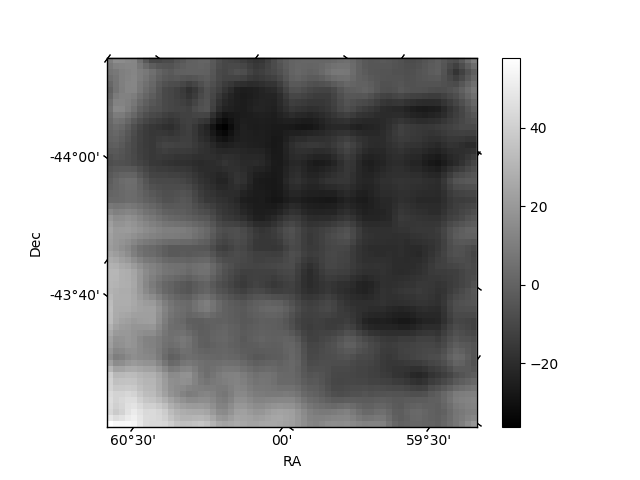
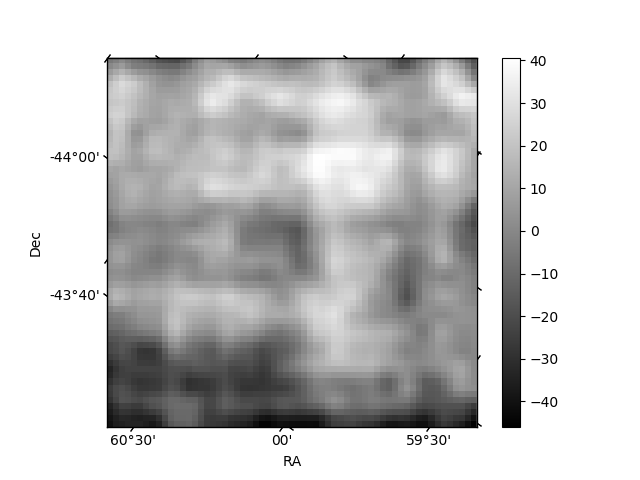
Quadrant B |
|---|---|---|---|
| Quadrant D | 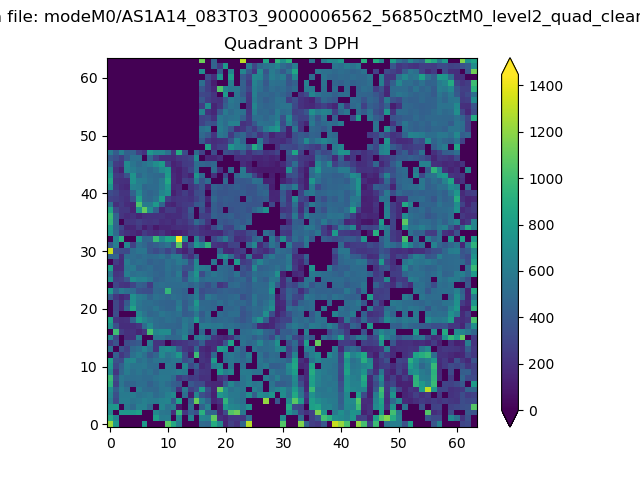 |
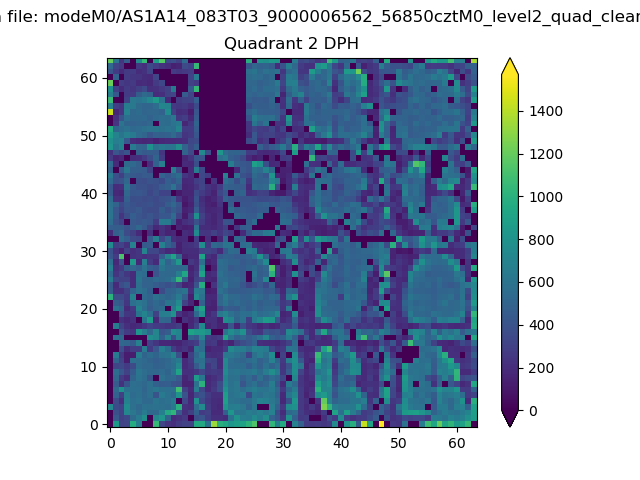 |
Quadrant C |
| Plot type | Count rate plots | Images |
|---|---|---|
| Comparison with Poisson distribution Blue bars denote a histogram of data divided into 1 sec bins. Red curve is a Poisson curve with rate = median count rate of data. |
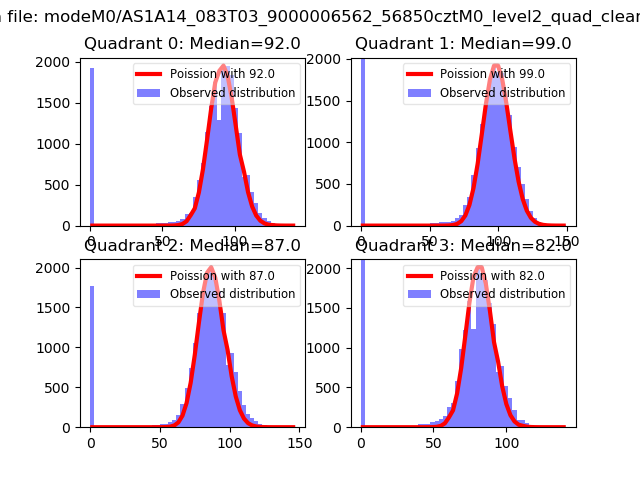 |
 |
| Quadrant-wise count rates Data is divided into 100 sec bins |
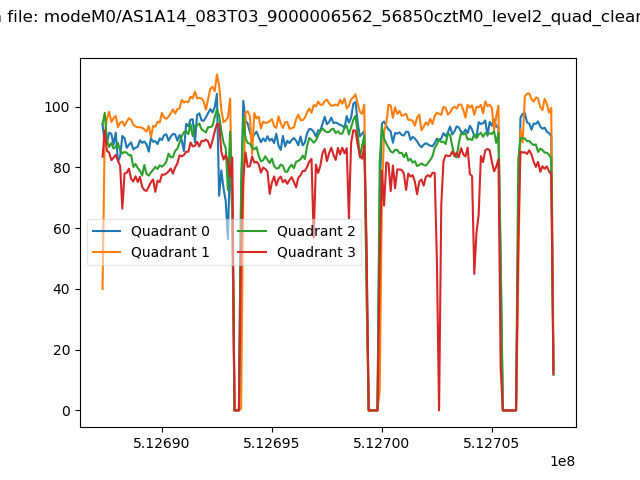 |
|
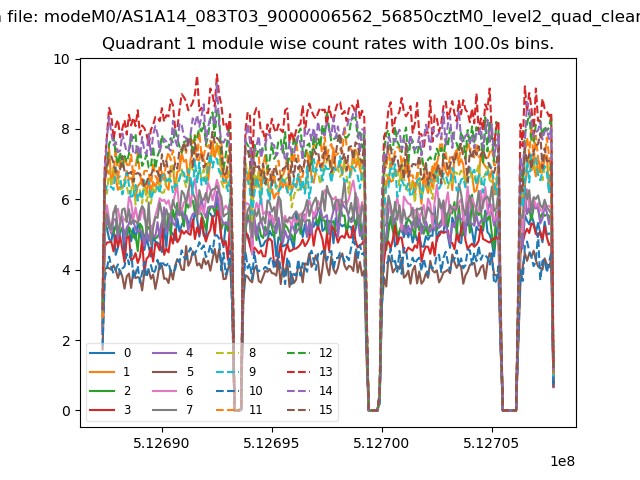
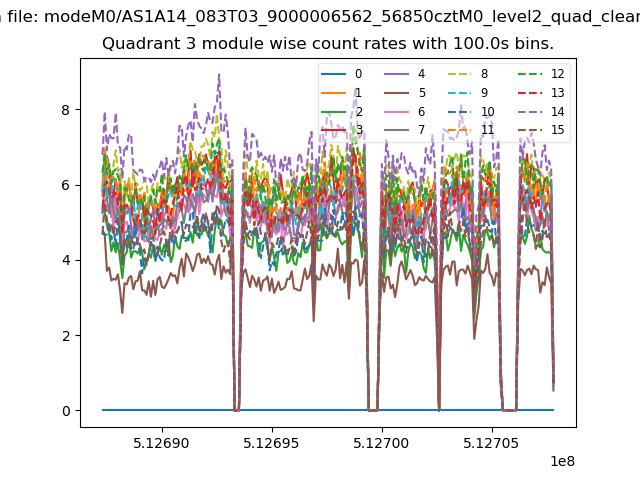
| Module-wise count rates for Quadrant A Data is divided into 100 sec bins |
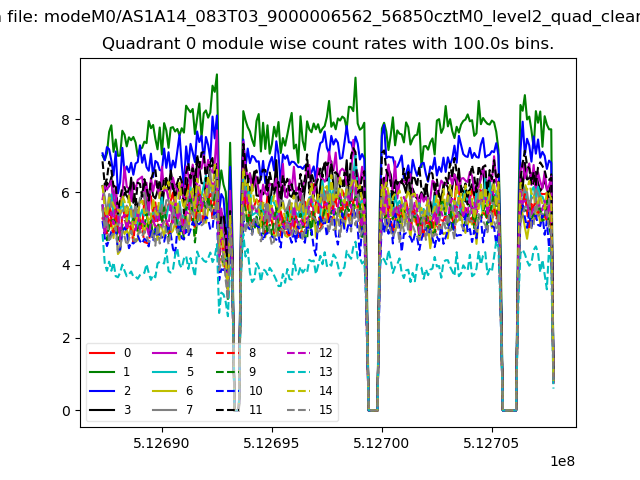 |
 |
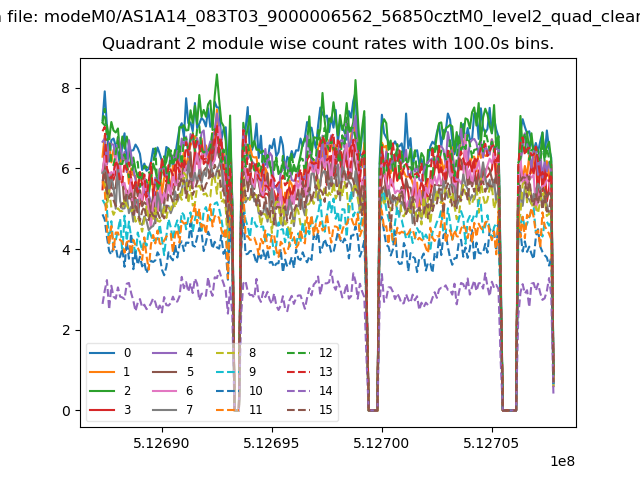
| Module-wise count rates for Quadrant B Data is divided into 100 sec bins |
 |
 |
| Module-wise count rates for Quadrant C Data is divided into 100 sec bins |
 |
 |
| Module-wise count rates for Quadrant D Data is divided into 100 sec bins |
 |
 |
| Parameter | Plot |
|---|---|
| CZT HV Monitor | 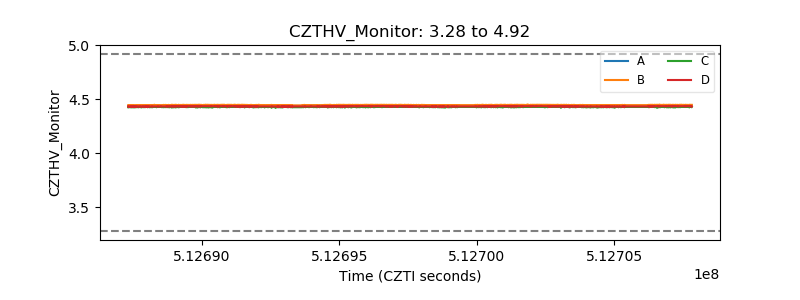 |
| D_VDD | 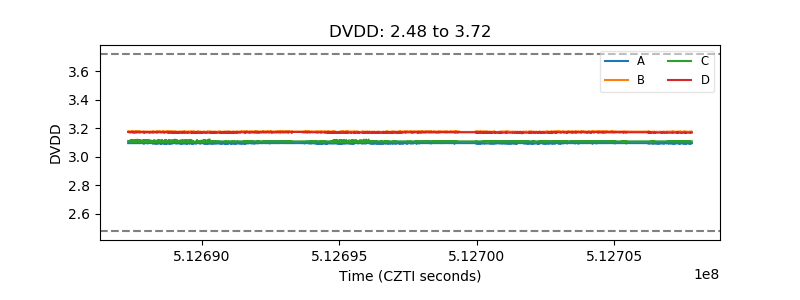 |
| Temperature 1 | 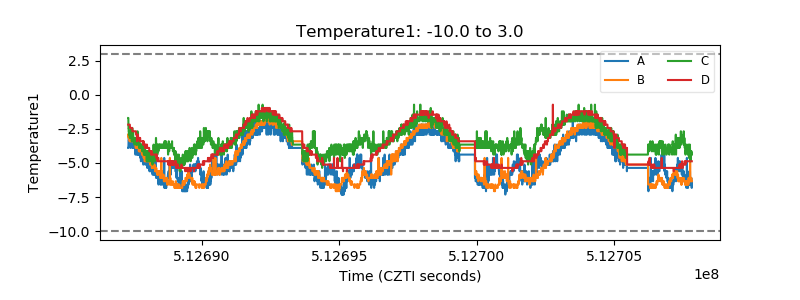 |
| Veto HV Monitor | 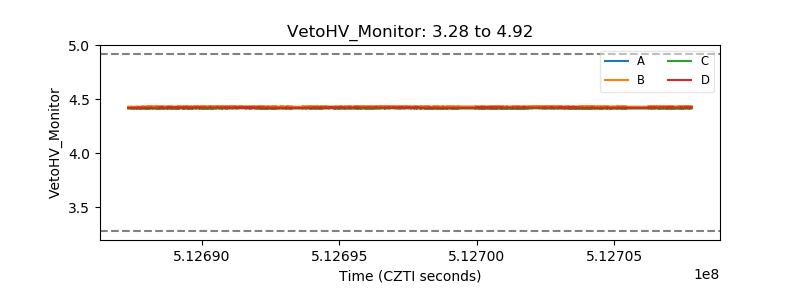 |
| Veto LLD | 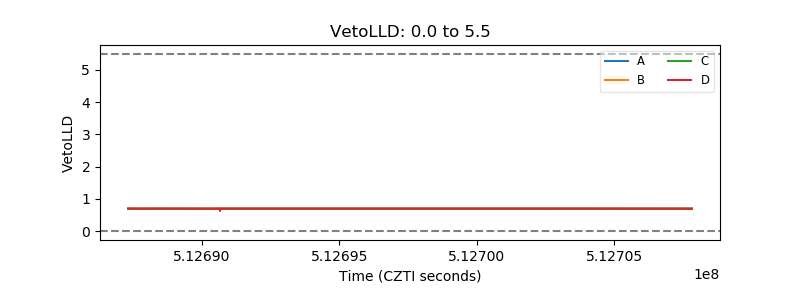 |
| Alpha Counter | 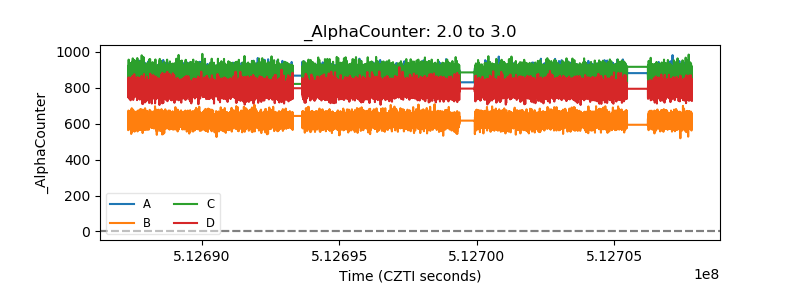 |
| _CPM_Rate | 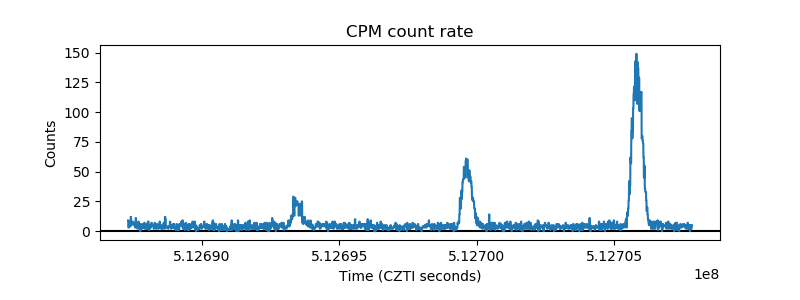 |
| CZT Counter | 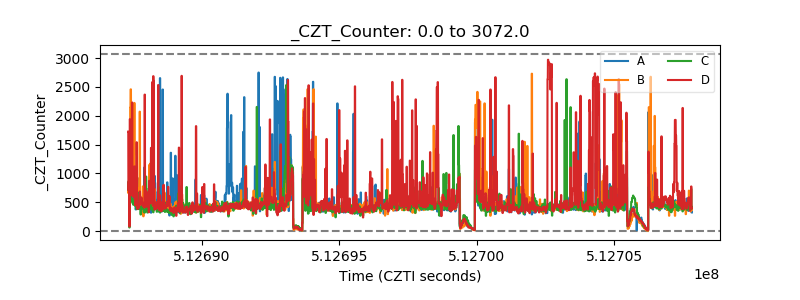 |
| +2.5 Volts monitor |  |
| +5 Volts monitor |  |
| _ROLL_ROT | 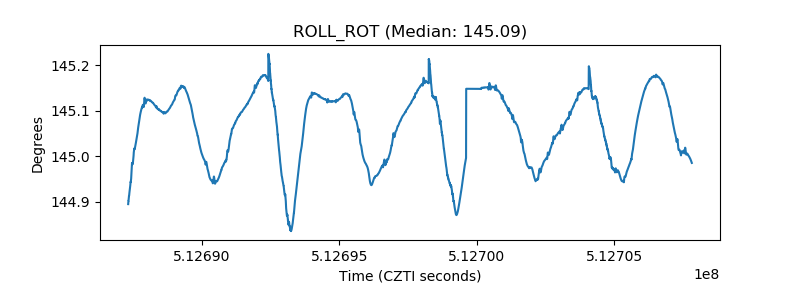 |
| _Roll_DEC | 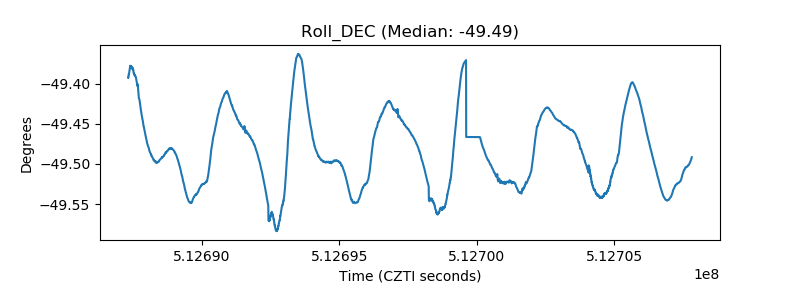 |
| _Roll_RA | 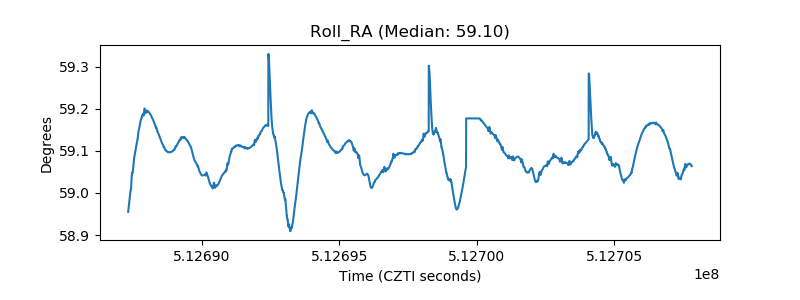 |
| Veto Counter | 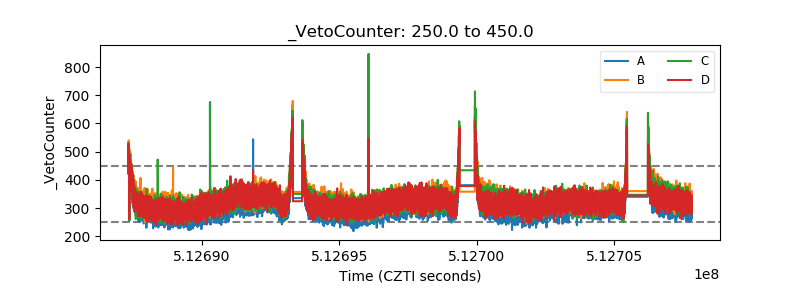 |