| Param | Original file | Final file |
|---|---|---|
| Filename | modeM0/AS1A14_083T03_9000006562_56851cztM0_level2.fits | modeM0/AS1A14_083T03_9000006562_56851cztM0_level2_quad_clean.evt |
| Size (bytes) | 411,226,560 | 93,041,280 |
| Size | 392.2 MB | 88.7 MB |
| Events in quadrant A | 3,677,983 | 605,658 |
| Events in quadrant B | 4,162,327 | 620,144 |
| Events in quadrant C | 2,887,670 | 587,847 |
| Events in quadrant D | 3,986,543 | 548,294 |
| Mode M9 | |||
|---|---|---|---|
| Quadrant | BADHDUFLAG | Total packets | Discarded packets |
| A | 0 | 9 | 0 |
| B | 0 | 9 | 0 |
| C | 0 | 9 | 0 |
| D | 0 | 9 | 0 |
| Mode SS | |||
|---|---|---|---|
| Quadrant | BADHDUFLAG | Total packets | Discarded packets |
| A | 0 | 134 | 0 |
| B | 0 | 134 | 0 |
| C | 0 | 134 | 0 |
| D | 0 | 134 | 0 |
| Mode M0 | |||
|---|---|---|---|
| Quadrant | BADHDUFLAG | Total packets | Discarded packets |
| A | 0 | 15739 | 1 |
| B | 0 | 17062 | 2 |
| C | 0 | 13509 | 1 |
| D | 0 | 16388 | 1 |
| Quadrant | Total seconds | Saturated seconds | Saturation percentage |
|---|---|---|---|
| A | 6523 | 187 | 2.866779% |
| B | 6523 | 524 | 8.033114% |
| C | 6523 | 32 | 0.490572% |
| D | 6523 | 173 | 2.652154% |
Noise dominated data is calculated using 1-second bins in cleaned event files. If a bin has >2000 counts, and if more than 50% of those come from <1% of pixels, then it is considered to be noise-dominated and hence unusable.
| Quadrant | # 1 sec bins | Bins with >0 counts | Bins with >2000 counts | High rate bins dominated by noise | Noise dominated (total time) | Noise dominated (detector-on time) | Marked lightcurve |
|---|---|---|---|---|---|---|---|
| A | 7438 | 6524 | 110 | 110 | 1.48% | 1.69% | 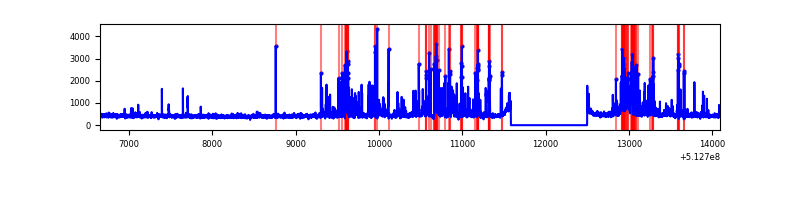 |
| B | 7438 | 6523 | 329 | 329 | 4.42% | 5.04% | 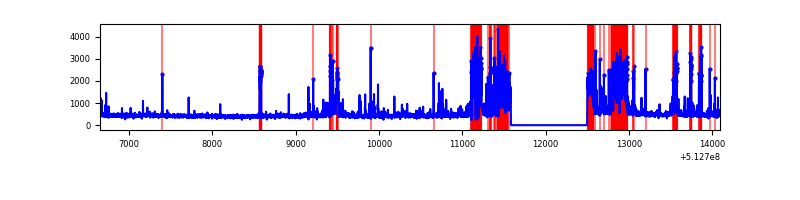 |
| C | 7438 | 6524 | 4 | 4 | 0.05% | 0.06% | 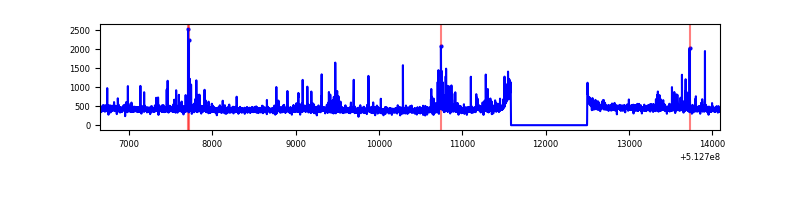 |
| D | 7438 | 6524 | 132 | 132 | 1.77% | 2.02% | 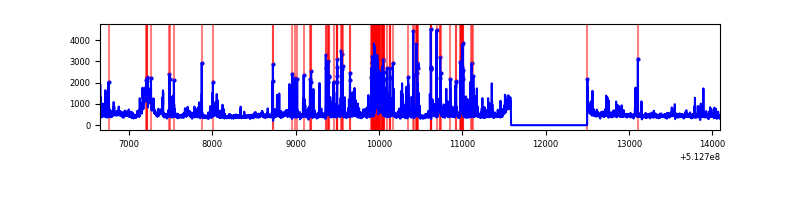 |
Top three noisy pixels from each quadrant. If the there are fewer than three noisy pixels in the level2.evt file, extra rows are filled as -1
| Pixel properties | Quadrant properties | ||||||
|---|---|---|---|---|---|---|---|
| Quadrant | DetID | PixID | Counts | Sigma | Mean | Median | Sigma |
| A | 7 | 64 | 636054 | 3720.79 | 692 | 674 | 170.8 |
| A | 10 | 251 | 295207 | 1724.79 | 692 | 674 | 170.8 |
| A | 3 | 14 | 26870 | 153.4 | 692 | 674 | 170.8 |
| B | 5 | 185 | 937610 | 6492.82 | 666 | 642 | 144.3 |
| B | 10 | 16 | 197794 | 1366.19 | 666 | 642 | 144.3 |
| B | 4 | 141 | 157378 | 1086.12 | 666 | 642 | 144.3 |
| C | 12 | 250 | 73583 | 389.88 | 685 | 676 | 187.0 |
| C | 14 | 254 | 56299 | 297.45 | 685 | 676 | 187.0 |
| C | 12 | 252 | 14396 | 73.37 | 685 | 676 | 187.0 |
| D | 8 | 240 | 742730 | 3953.02 | 671 | 641 | 187.7 |
| D | 2 | 249 | 354731 | 1886.2 | 671 | 641 | 187.7 |
| D | 3 | 176 | 57669 | 303.78 | 671 | 641 | 187.7 |
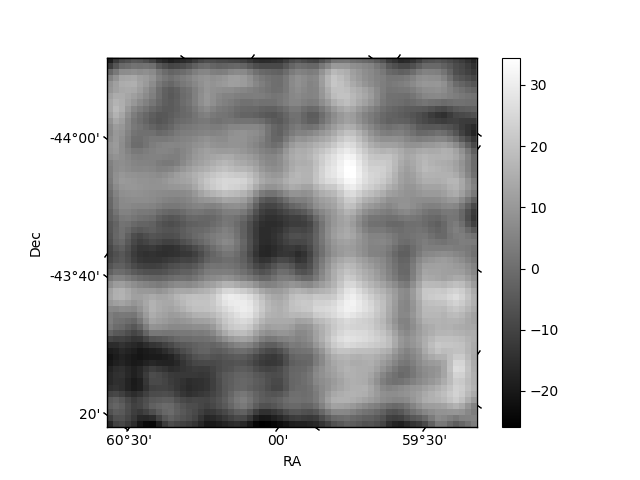
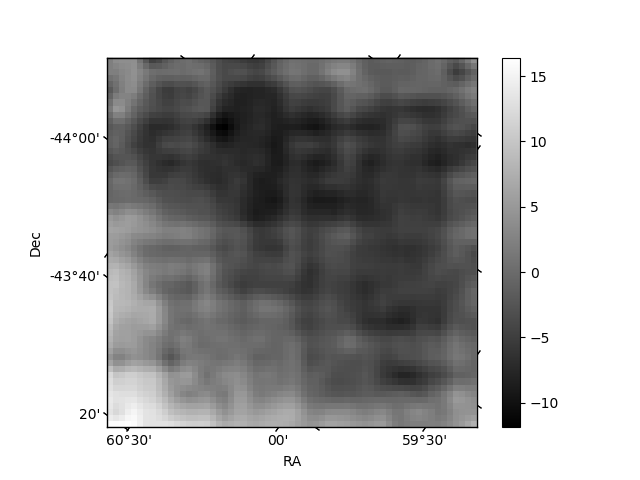
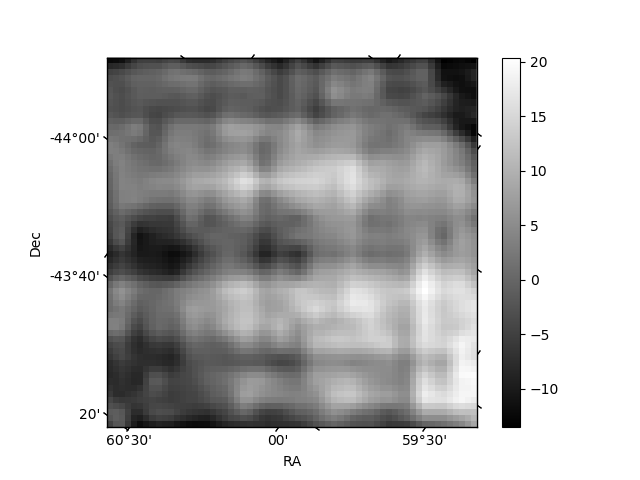
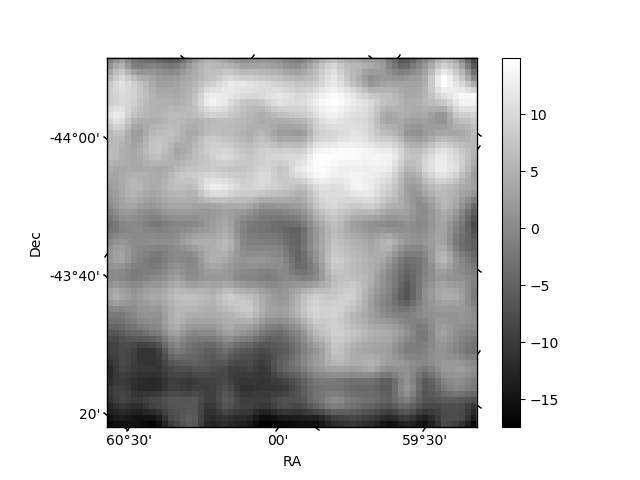
Histogram calculated using DETX and DETY for each event in the final _common_clean file
| Quadrant A | 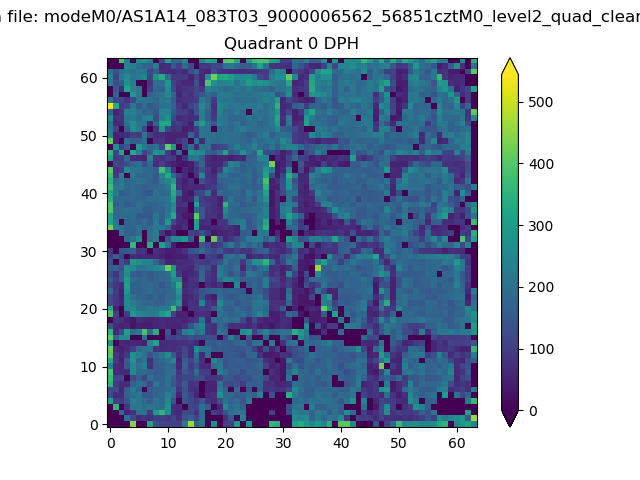 |
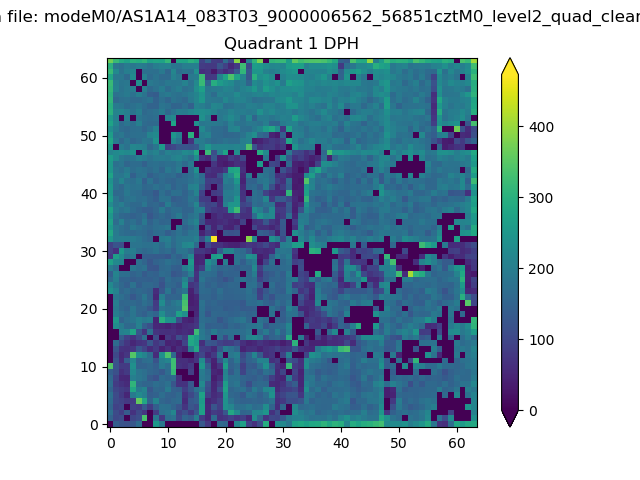 |
Quadrant B |
|---|---|---|---|
| Quadrant D | 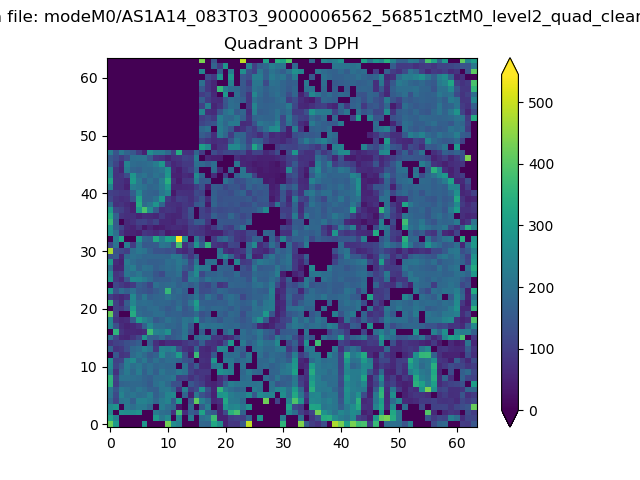 |
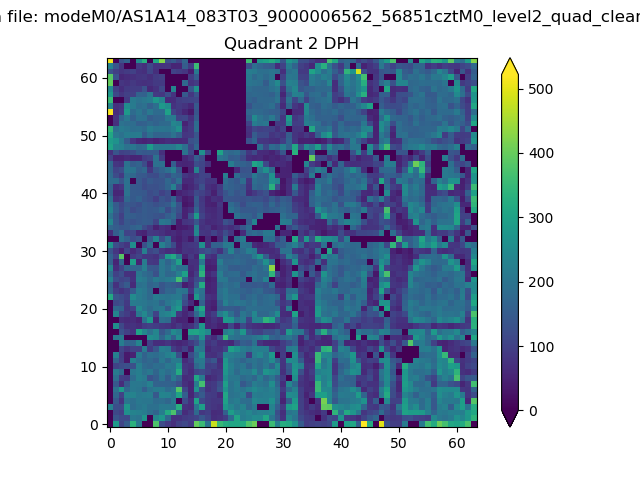 |
Quadrant C |
| Plot type | Count rate plots | Images |
|---|---|---|
| Comparison with Poisson distribution Blue bars denote a histogram of data divided into 1 sec bins. Red curve is a Poisson curve with rate = median count rate of data. |
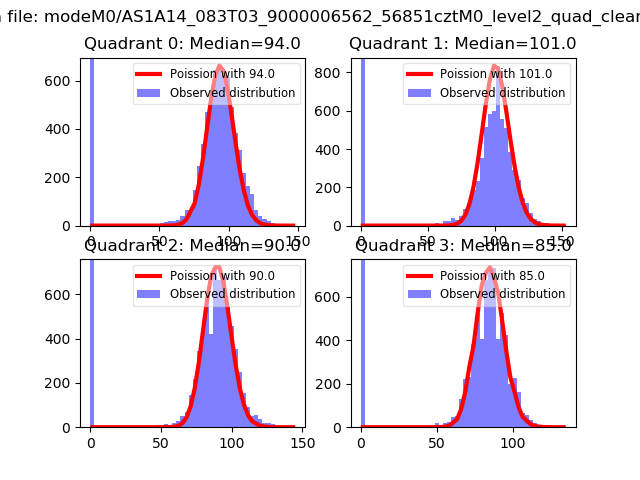 |
 |
| Quadrant-wise count rates Data is divided into 100 sec bins |
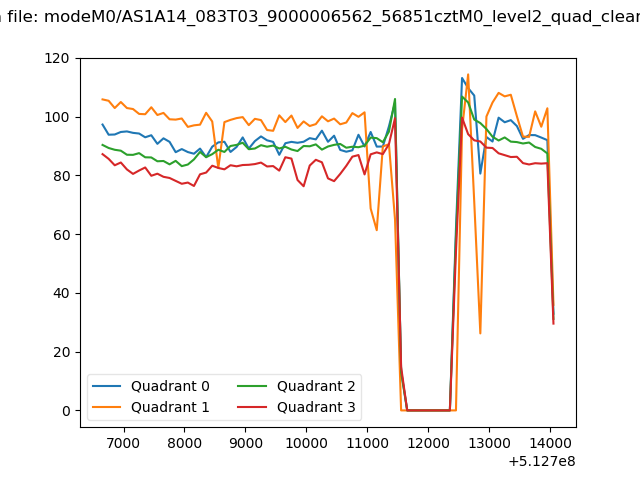 |
|
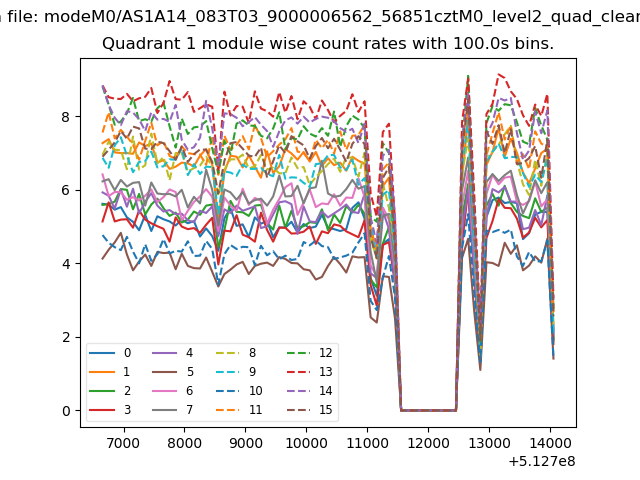
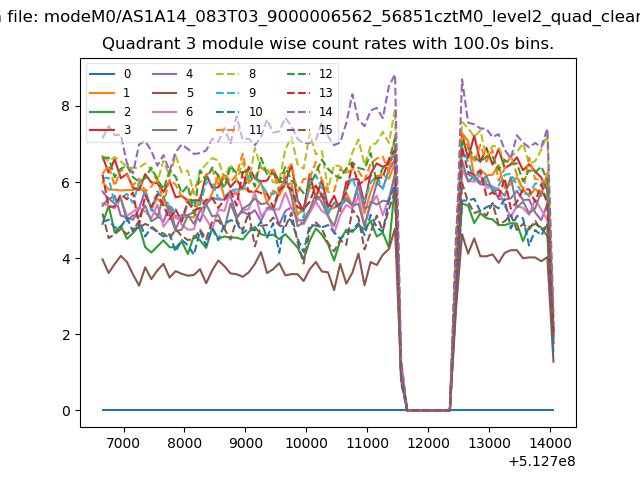
| Module-wise count rates for Quadrant A Data is divided into 100 sec bins |
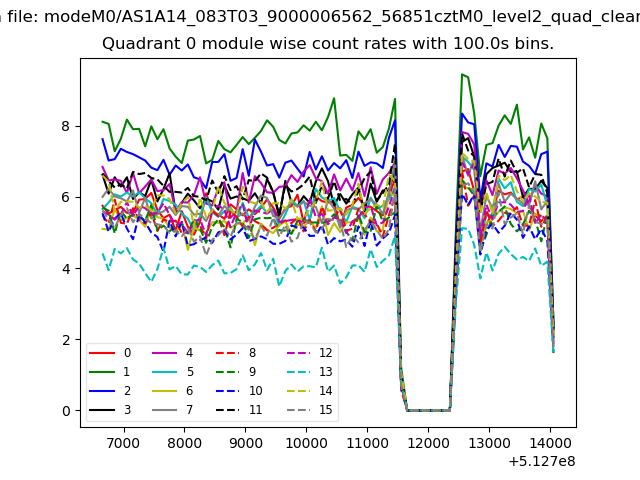 |
 |
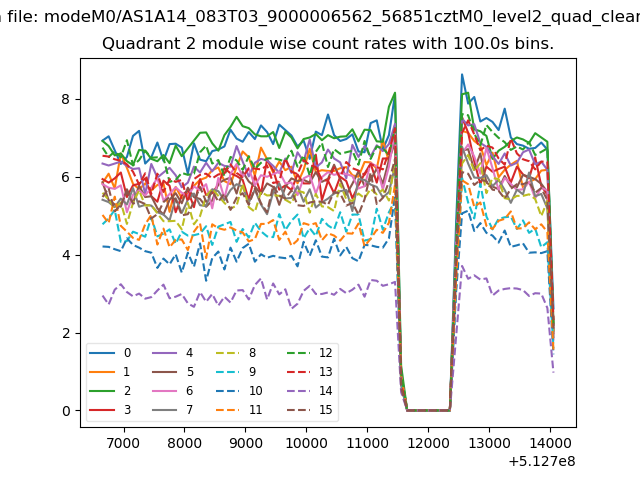
| Module-wise count rates for Quadrant B Data is divided into 100 sec bins |
 |
 |
| Module-wise count rates for Quadrant C Data is divided into 100 sec bins |
 |
 |
| Module-wise count rates for Quadrant D Data is divided into 100 sec bins |
 |
 |
| Parameter | Plot |
|---|---|
| CZT HV Monitor | 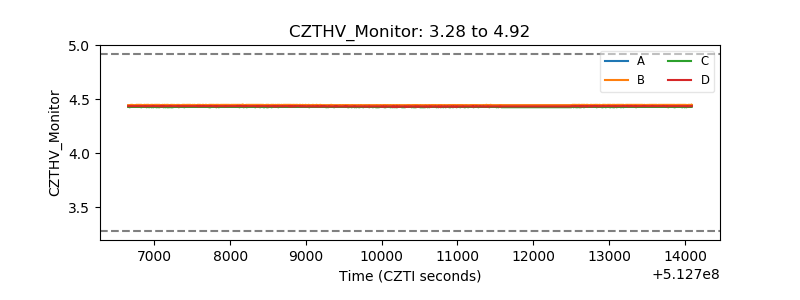 |
| D_VDD | 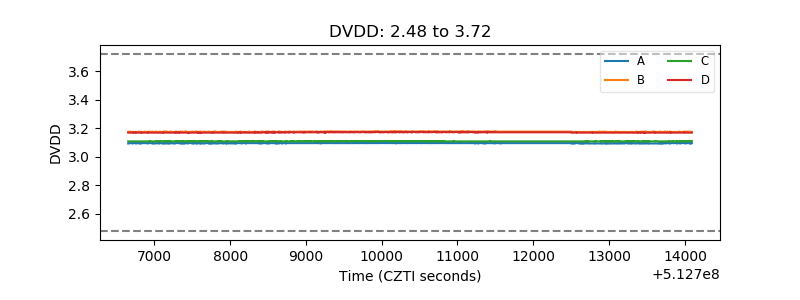 |
| Temperature 1 | 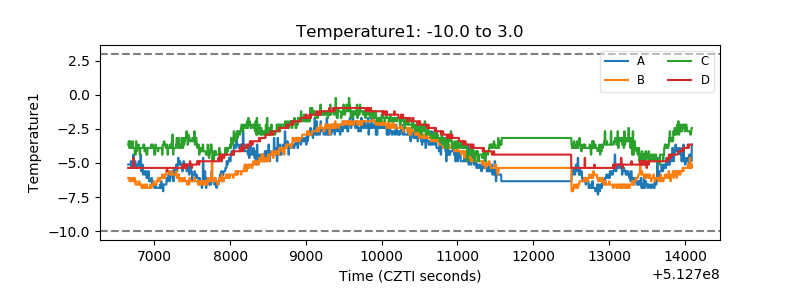 |
| Veto HV Monitor |  |
| Veto LLD | 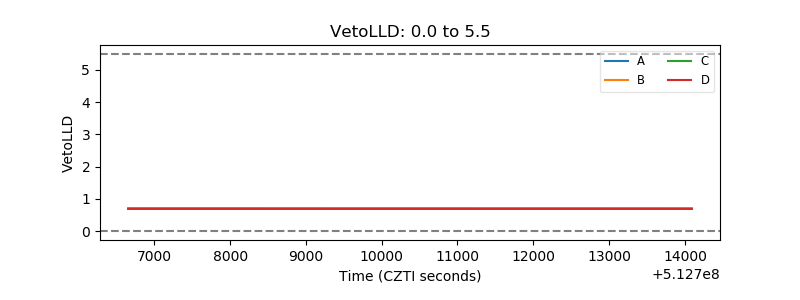 |
| Alpha Counter | 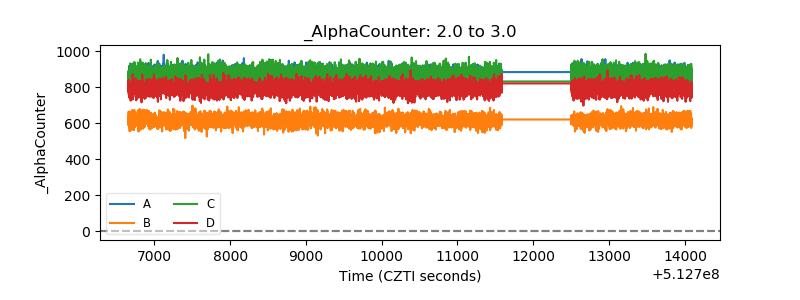 |
| _CPM_Rate | 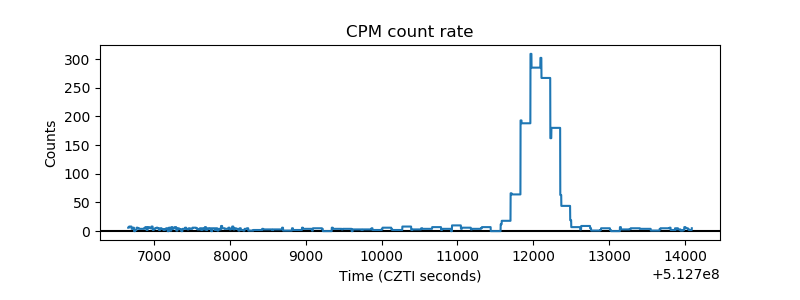 |
| CZT Counter | 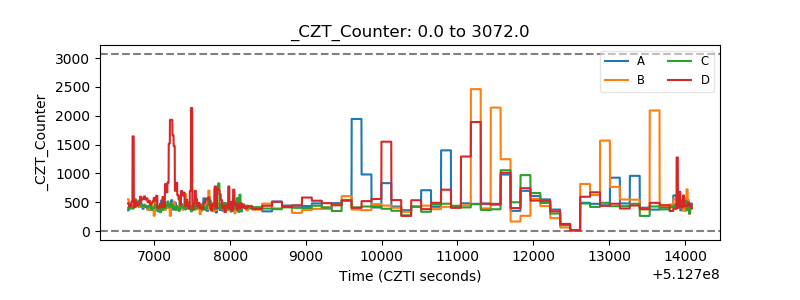 |
| +2.5 Volts monitor |  |
| +5 Volts monitor |  |
| _ROLL_ROT | 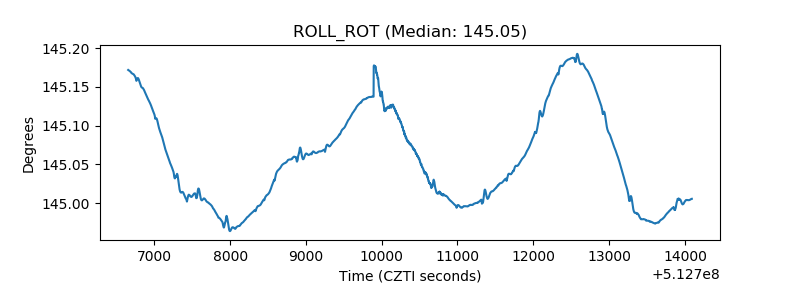 |
| _Roll_DEC | 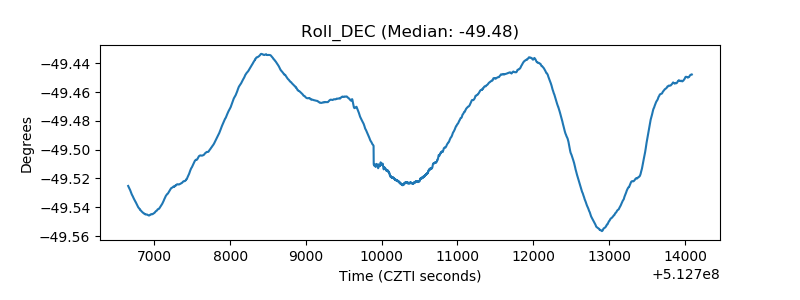 |
| _Roll_RA | 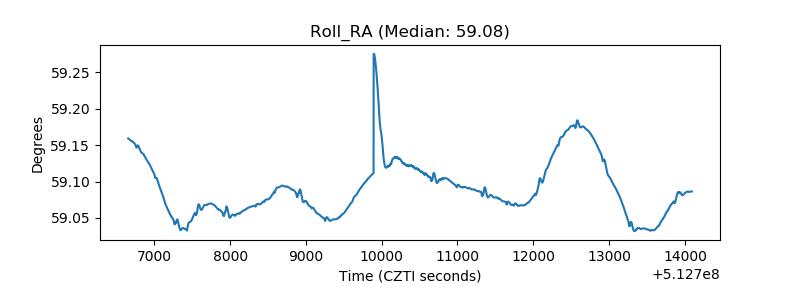 |
| Veto Counter | 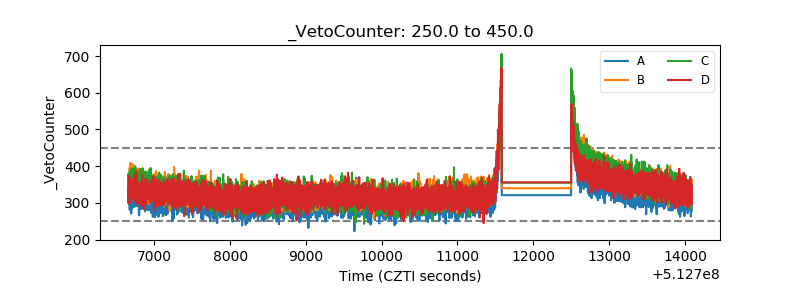 |