| Param | Original file | Final file |
|---|---|---|
| Filename | modeM0/AS1A14_083T03_9000006562_56853cztM0_level2.fits | modeM0/AS1A14_083T03_9000006562_56853cztM0_level2_quad_clean.evt |
| Size (bytes) | 493,698,240 | 92,851,200 |
| Size | 470.8 MB | 88.5 MB |
| Events in quadrant A | 4,785,274 | 586,014 |
| Events in quadrant B | 5,139,576 | 623,904 |
| Events in quadrant C | 3,265,060 | 601,898 |
| Events in quadrant D | 4,579,327 | 545,719 |
| Mode M9 | |||
|---|---|---|---|
| Quadrant | BADHDUFLAG | Total packets | Discarded packets |
| A | 0 | 10 | 0 |
| B | 0 | 10 | 0 |
| C | 0 | 10 | 0 |
| D | 0 | 10 | 0 |
| Mode SS | |||
|---|---|---|---|
| Quadrant | BADHDUFLAG | Total packets | Discarded packets |
| A | 0 | 132 | 0 |
| B | 0 | 132 | 0 |
| C | 0 | 132 | 0 |
| D | 0 | 132 | 0 |
| Mode M0 | |||
|---|---|---|---|
| Quadrant | BADHDUFLAG | Total packets | Discarded packets |
| A | 0 | 18724 | 1 |
| B | 0 | 19603 | 1 |
| C | 0 | 14422 | 1 |
| D | 0 | 18084 | 1 |
| Quadrant | Total seconds | Saturated seconds | Saturation percentage |
|---|---|---|---|
| A | 6508 | 617 | 9.480639% |
| B | 6508 | 708 | 10.878918% |
| C | 6509 | 142 | 2.181595% |
| D | 6509 | 425 | 6.529421% |
Noise dominated data is calculated using 1-second bins in cleaned event files. If a bin has >2000 counts, and if more than 50% of those come from <1% of pixels, then it is considered to be noise-dominated and hence unusable.
| Quadrant | # 1 sec bins | Bins with >0 counts | Bins with >2000 counts | High rate bins dominated by noise | Noise dominated (total time) | Noise dominated (detector-on time) | Marked lightcurve |
|---|---|---|---|---|---|---|---|
| A | 7533 | 6509 | 495 | 495 | 6.57% | 7.60% | 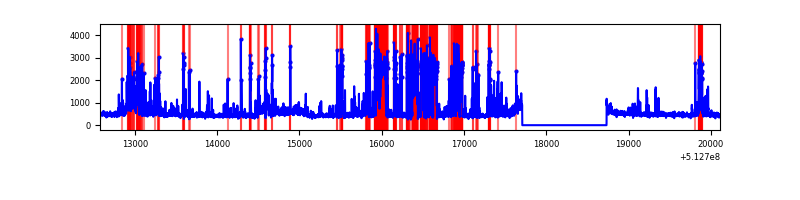 |
| B | 7533 | 6508 | 469 | 469 | 6.23% | 7.21% | 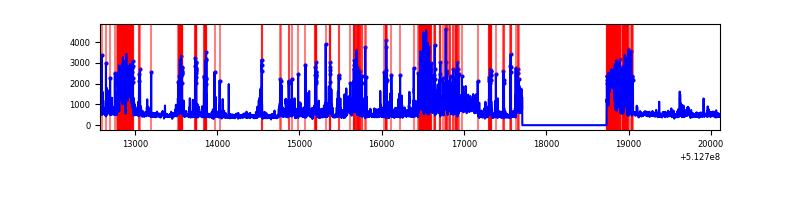 |
| C | 7534 | 6509 | 102 | 102 | 1.35% | 1.57% | 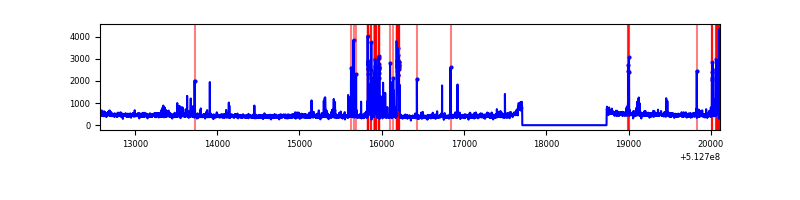 |
| D | 7534 | 6509 | 377 | 377 | 5.00% | 5.79% | 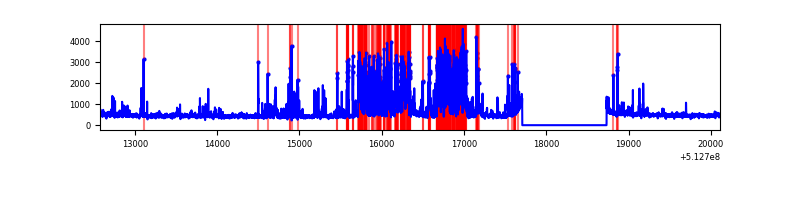 |
Top three noisy pixels from each quadrant. If the there are fewer than three noisy pixels in the level2.evt file, extra rows are filled as -1
| Pixel properties | Quadrant properties | ||||||
|---|---|---|---|---|---|---|---|
| Quadrant | DetID | PixID | Counts | Sigma | Mean | Median | Sigma |
| A | 3 | 62 | 1200160 | 7132.53 | 684 | 666 | 168.2 |
| A | 7 | 64 | 394139 | 2339.7 | 684 | 666 | 168.2 |
| A | 10 | 251 | 284957 | 1690.48 | 684 | 666 | 168.2 |
| B | 5 | 185 | 1682419 | 11800.06 | 668 | 645 | 142.5 |
| B | 10 | 16 | 462059 | 3237.48 | 668 | 645 | 142.5 |
| B | 5 | 172 | 52015 | 360.43 | 668 | 645 | 142.5 |
| C | 12 | 250 | 318020 | 1679.04 | 694 | 686 | 189.0 |
| C | 14 | 246 | 106059 | 557.54 | 694 | 686 | 189.0 |
| C | 14 | 254 | 38787 | 201.6 | 694 | 686 | 189.0 |
| D | 2 | 249 | 1323177 | 6967.11 | 680 | 651 | 189.8 |
| D | 8 | 240 | 398854 | 2097.75 | 680 | 651 | 189.8 |
| D | 3 | 176 | 51426 | 267.48 | 680 | 651 | 189.8 |
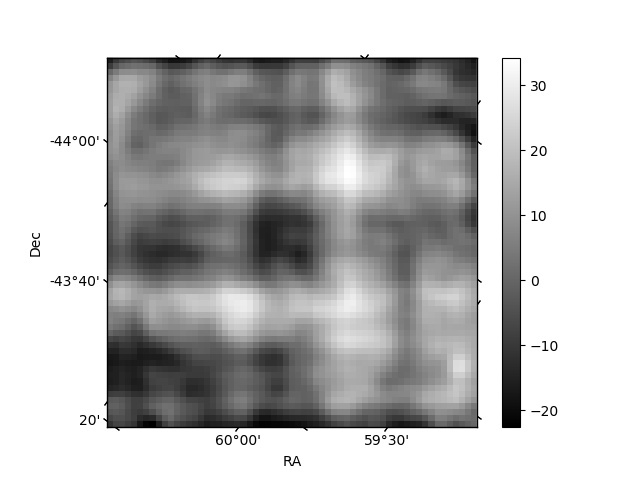
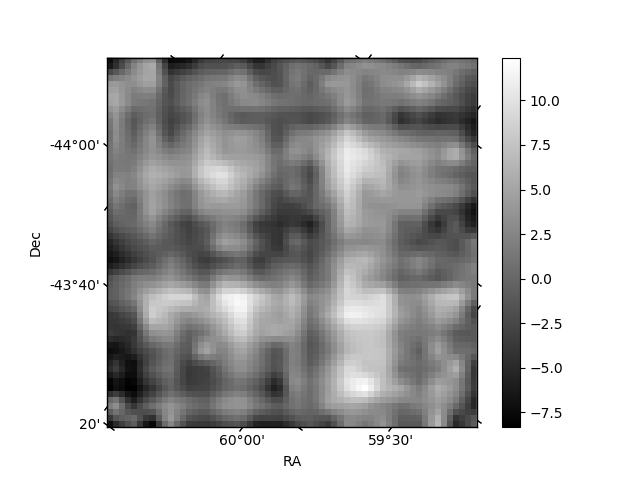
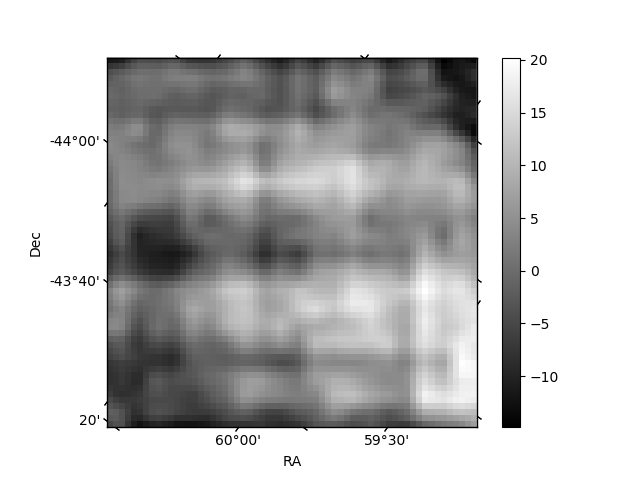
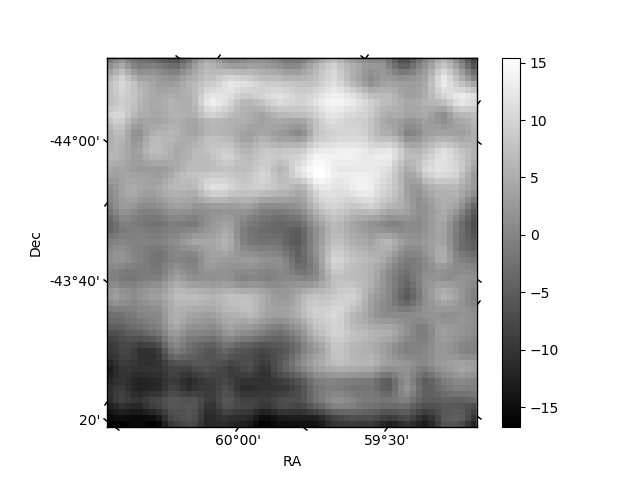
Histogram calculated using DETX and DETY for each event in the final _common_clean file
| Quadrant A | 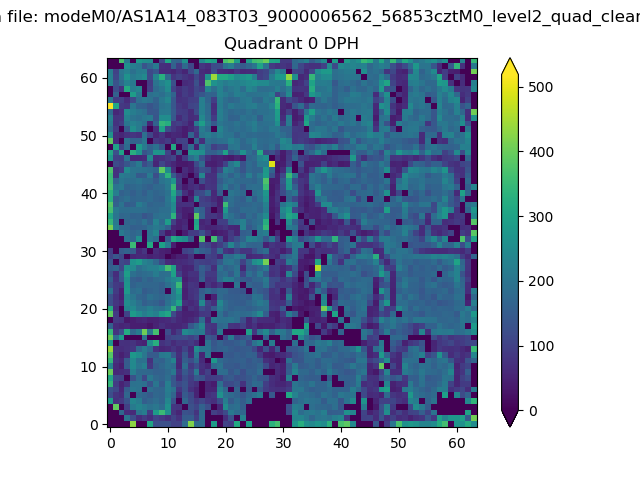 |
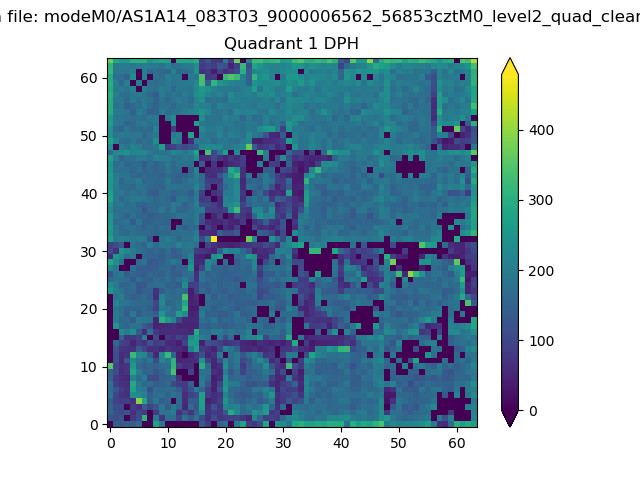 |
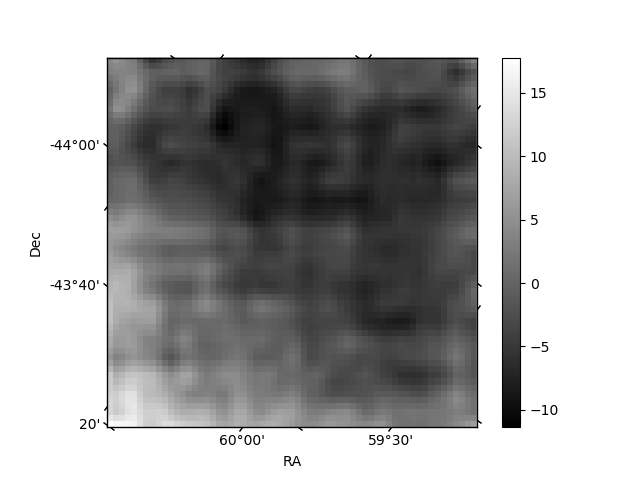
Quadrant B |
|---|---|---|---|
| Quadrant D | 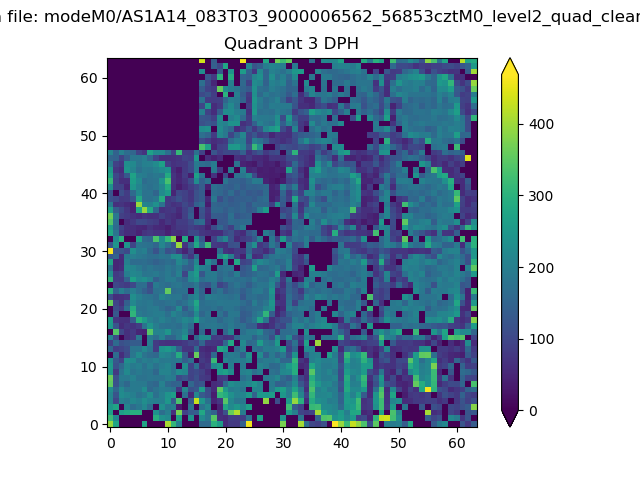 |
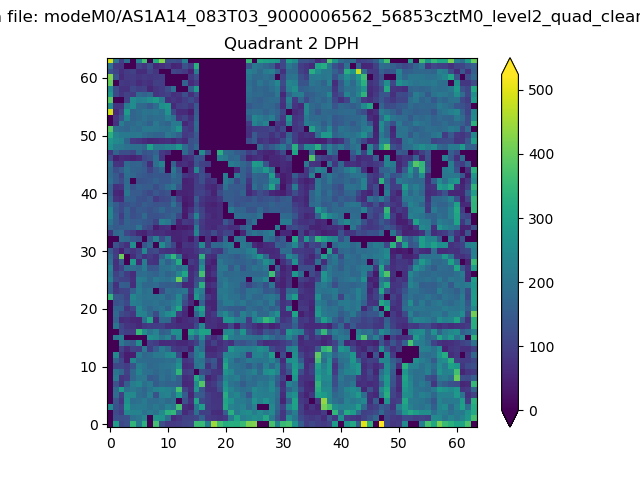 |
Quadrant C |
| Plot type | Count rate plots | Images |
|---|---|---|
| Comparison with Poisson distribution Blue bars denote a histogram of data divided into 1 sec bins. Red curve is a Poisson curve with rate = median count rate of data. |
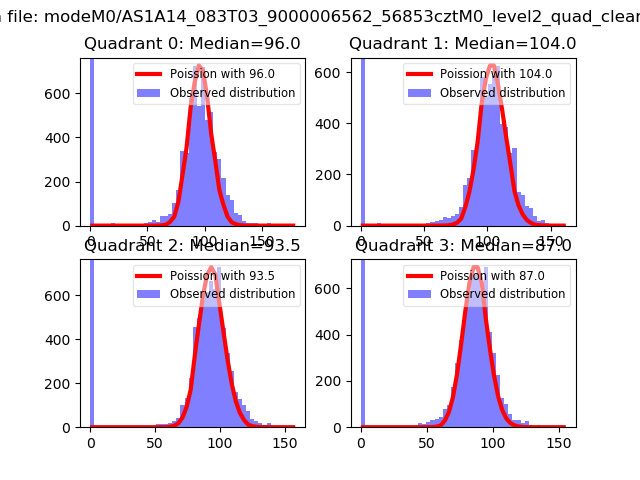 |
 |
| Quadrant-wise count rates Data is divided into 100 sec bins |
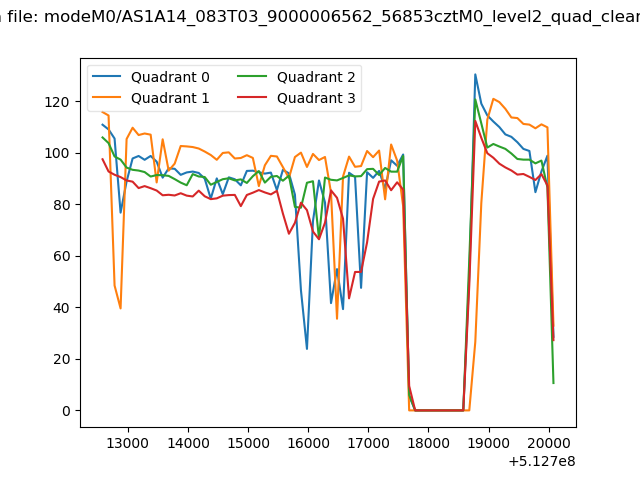 |
|
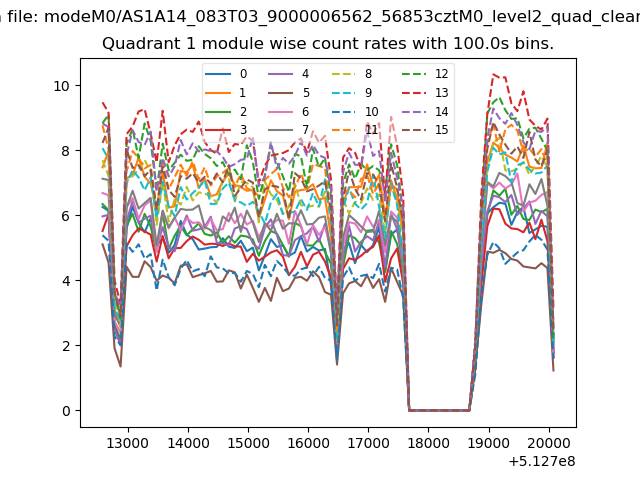
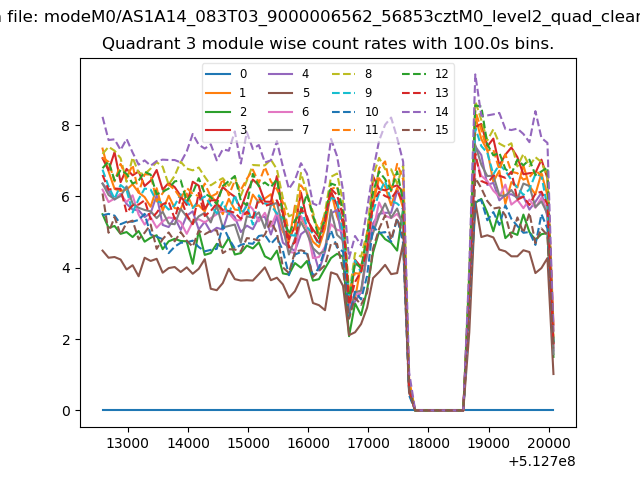
| Module-wise count rates for Quadrant A Data is divided into 100 sec bins |
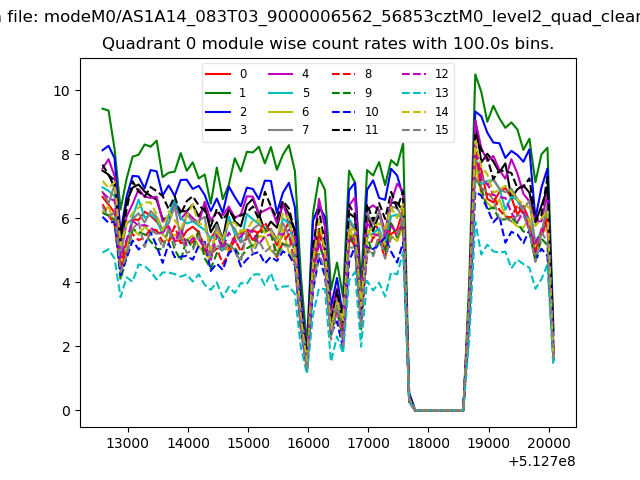 |
 |
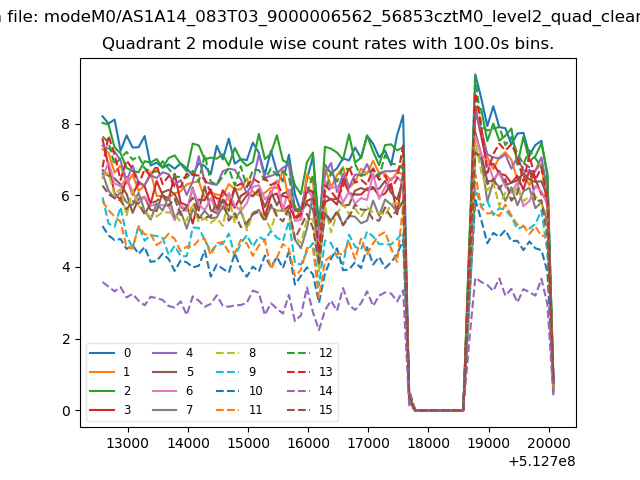
| Module-wise count rates for Quadrant B Data is divided into 100 sec bins |
 |
 |
| Module-wise count rates for Quadrant C Data is divided into 100 sec bins |
 |
 |
| Module-wise count rates for Quadrant D Data is divided into 100 sec bins |
 |
 |
| Parameter | Plot |
|---|---|
| CZT HV Monitor | 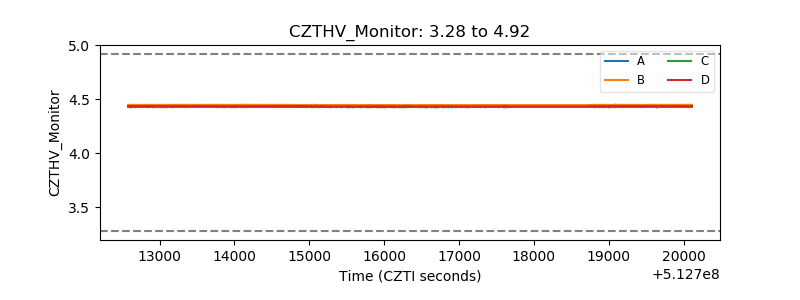 |
| D_VDD | 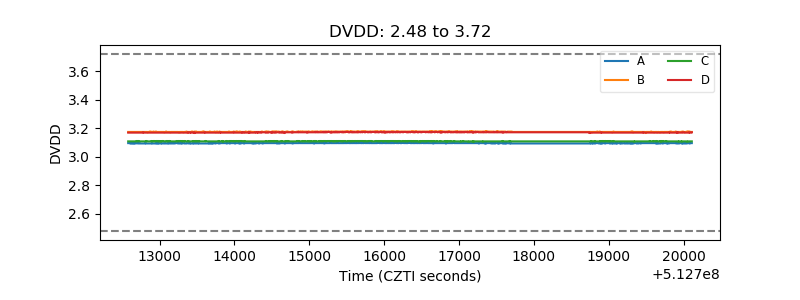 |
| Temperature 1 | 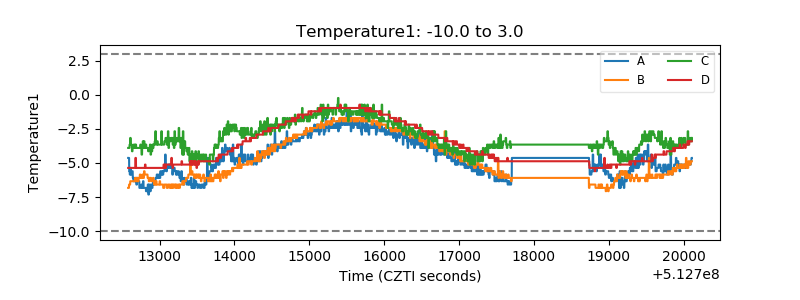 |
| Veto HV Monitor | 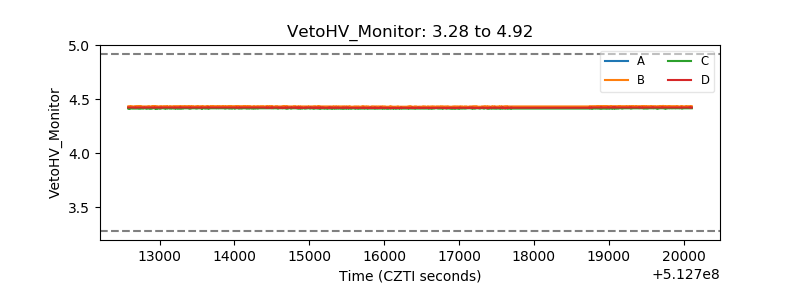 |
| Veto LLD | 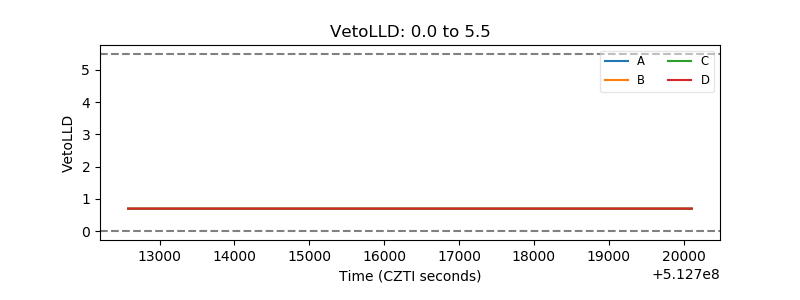 |
| Alpha Counter | 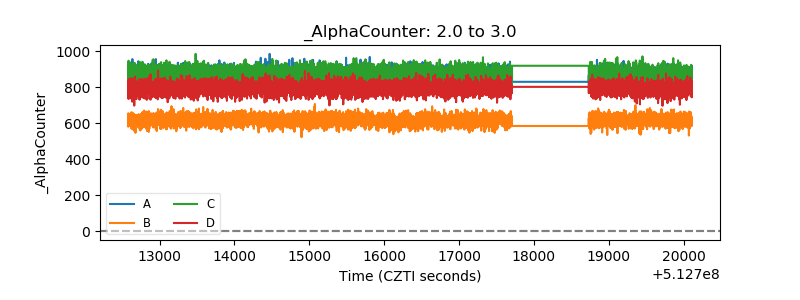 |
| _CPM_Rate | 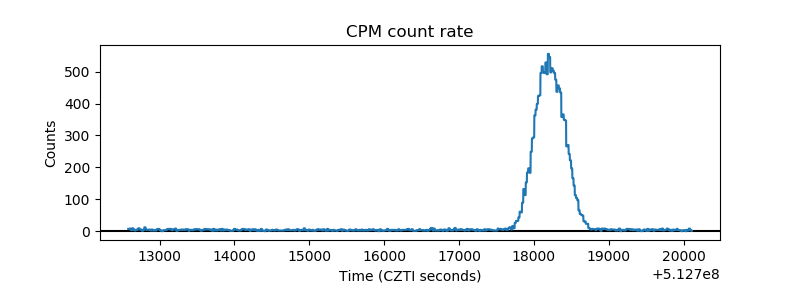 |
| CZT Counter | 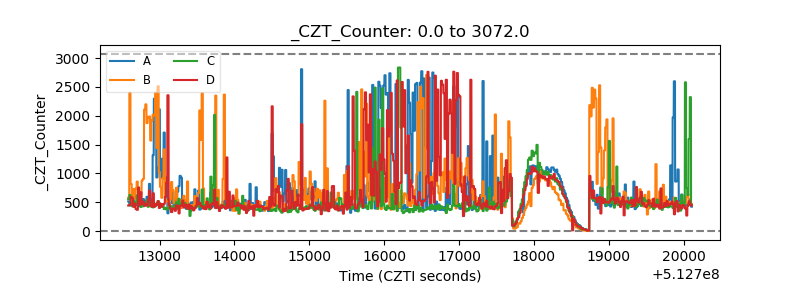 |
| +2.5 Volts monitor |  |
| +5 Volts monitor | 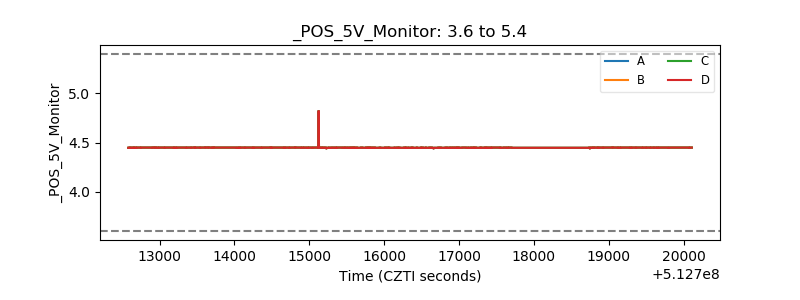 |
| _ROLL_ROT | 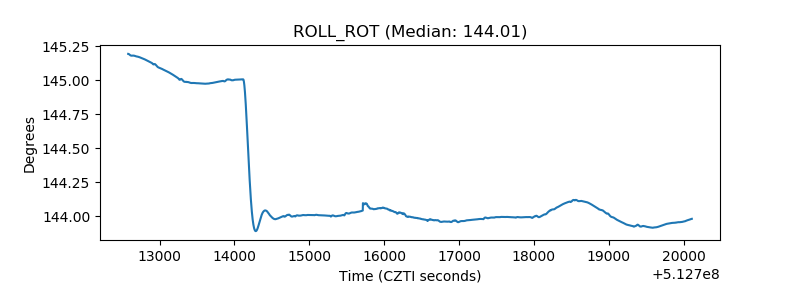 |
| _Roll_DEC | 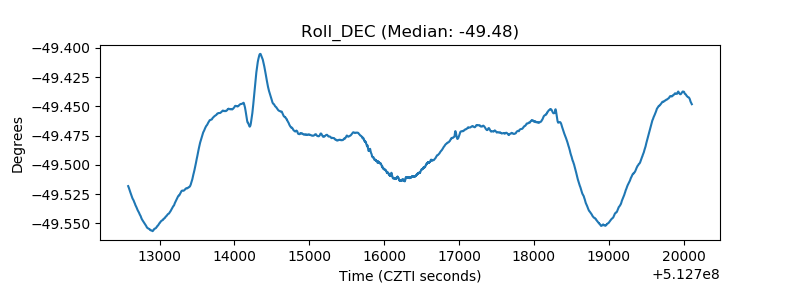 |
| _Roll_RA | 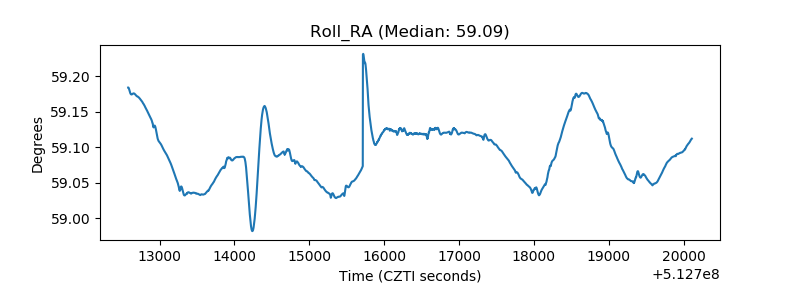 |
| Veto Counter | 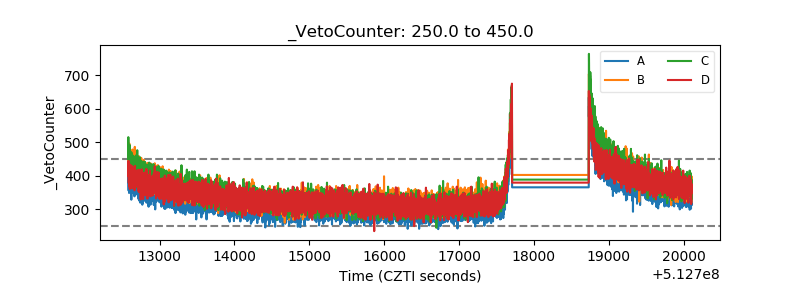 |