| Param | Original file | Final file |
|---|---|---|
| Filename | modeM0/AS1A14_083T03_9000006562_56854cztM0_level2.fits | modeM0/AS1A14_083T03_9000006562_56854cztM0_level2_quad_clean.evt |
| Size (bytes) | 469,434,240 | 85,222,080 |
| Size | 447.7 MB | 81.3 MB |
| Events in quadrant A | 3,342,500 | 575,777 |
| Events in quadrant B | 5,482,204 | 539,851 |
| Events in quadrant C | 3,041,861 | 562,108 |
| Events in quadrant D | 5,049,502 | 488,979 |
| Mode M9 | |||
|---|---|---|---|
| Quadrant | BADHDUFLAG | Total packets | Discarded packets |
| A | 0 | 11 | 0 |
| B | 0 | 11 | 0 |
| C | 0 | 11 | 0 |
| D | 0 | 11 | 0 |
| Mode SS | |||
|---|---|---|---|
| Quadrant | BADHDUFLAG | Total packets | Discarded packets |
| A | 0 | 120 | 0 |
| B | 0 | 120 | 0 |
| C | 0 | 120 | 0 |
| D | 0 | 120 | 0 |
| Mode M0 | |||
|---|---|---|---|
| Quadrant | BADHDUFLAG | Total packets | Discarded packets |
| A | 0 | 14200 | 1 |
| B | 0 | 20237 | 1 |
| C | 0 | 13271 | 1 |
| D | 0 | 18940 | 1 |
| Quadrant | Total seconds | Saturated seconds | Saturation percentage |
|---|---|---|---|
| A | 5923 | 244 | 4.119534% |
| B | 5923 | 1079 | 18.217120% |
| C | 5924 | 136 | 2.295746% |
| D | 5924 | 631 | 10.651587% |
Noise dominated data is calculated using 1-second bins in cleaned event files. If a bin has >2000 counts, and if more than 50% of those come from <1% of pixels, then it is considered to be noise-dominated and hence unusable.
| Quadrant | # 1 sec bins | Bins with >0 counts | Bins with >2000 counts | High rate bins dominated by noise | Noise dominated (total time) | Noise dominated (detector-on time) | Marked lightcurve |
|---|---|---|---|---|---|---|---|
| A | 7033 | 5923 | 164 | 164 | 2.33% | 2.77% | 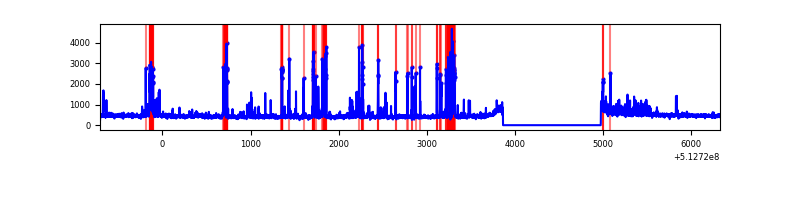 |
| B | 7033 | 5923 | 824 | 824 | 11.72% | 13.91% | 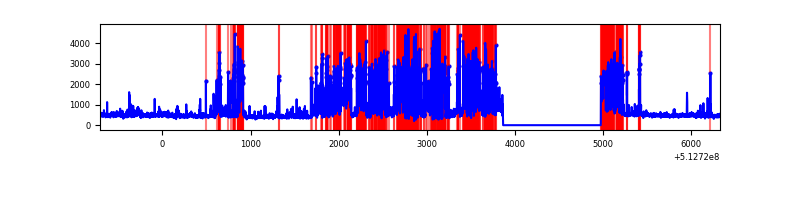 |
| C | 7034 | 5924 | 68 | 68 | 0.97% | 1.15% | 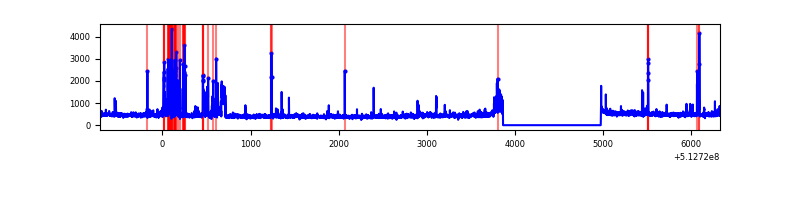 |
| D | 7034 | 5925 | 575 | 575 | 8.17% | 9.70% | 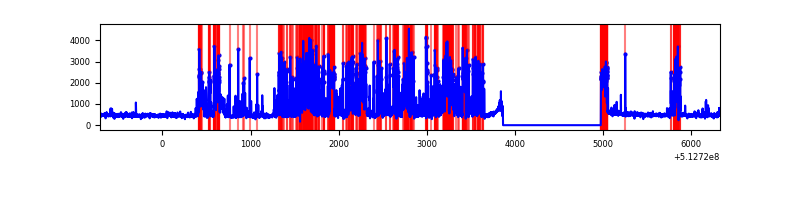 |
Top three noisy pixels from each quadrant. If the there are fewer than three noisy pixels in the level2.evt file, extra rows are filled as -1
| Pixel properties | Quadrant properties | ||||||
|---|---|---|---|---|---|---|---|
| Quadrant | DetID | PixID | Counts | Sigma | Mean | Median | Sigma |
| A | 3 | 62 | 593487 | 3708.1 | 649 | 632 | 159.9 |
| A | 3 | 14 | 98975 | 615.1 | 649 | 632 | 159.9 |
| A | 10 | 251 | 74269 | 460.57 | 649 | 632 | 159.9 |
| B | 5 | 185 | 2660823 | 21148.27 | 588 | 567 | 125.8 |
| B | 10 | 16 | 302811 | 2402.75 | 588 | 567 | 125.8 |
| B | 0 | 245 | 33948 | 265.37 | 588 | 567 | 125.8 |
| C | 14 | 246 | 186591 | 1082.1 | 634 | 629 | 171.9 |
| C | 8 | 208 | 145386 | 842.33 | 634 | 629 | 171.9 |
| C | 13 | 3 | 86315 | 498.6 | 634 | 629 | 171.9 |
| D | 2 | 249 | 1138963 | 6683.1 | 610 | 582 | 170.3 |
| D | 8 | 240 | 1027292 | 6027.51 | 610 | 582 | 170.3 |
| D | 5 | 113 | 337324 | 1976.91 | 610 | 582 | 170.3 |
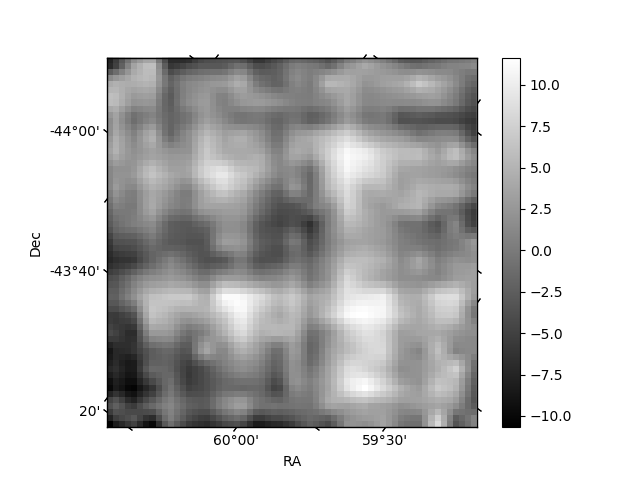
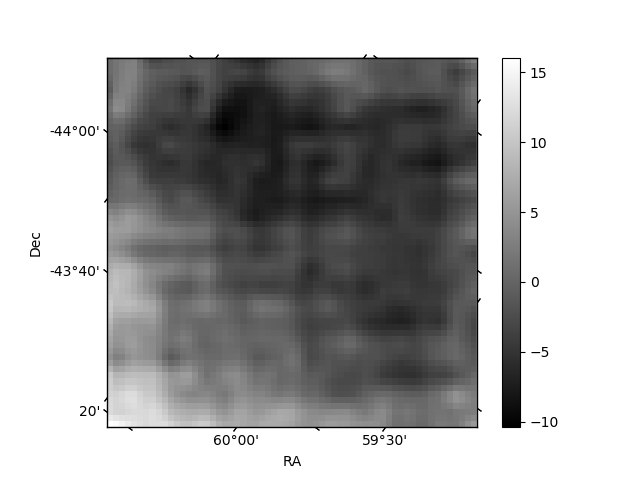
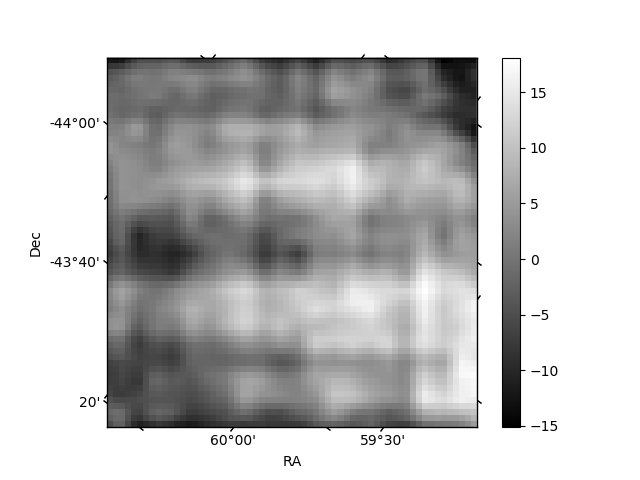
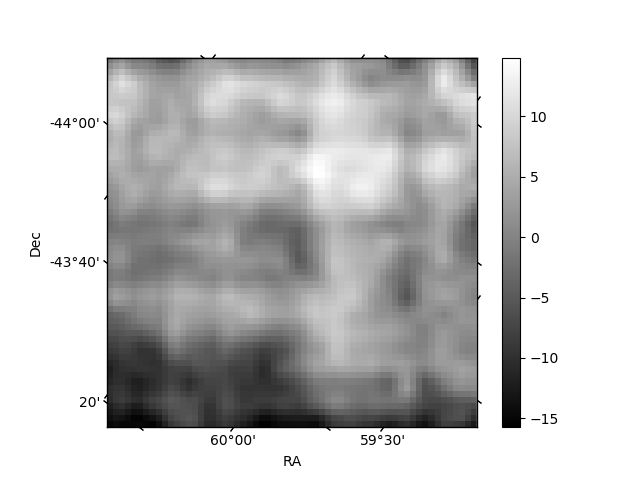
Histogram calculated using DETX and DETY for each event in the final _common_clean file
| Quadrant A | 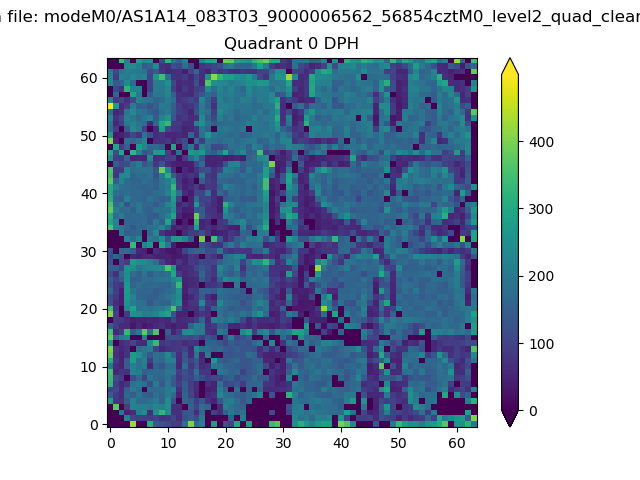 |
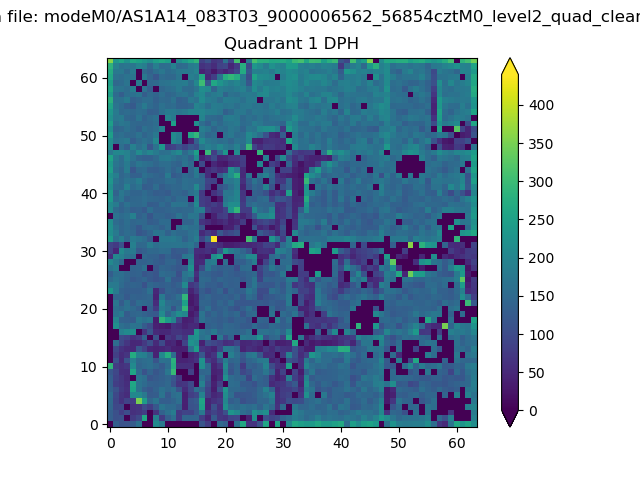 |
Quadrant B |
|---|---|---|---|
| Quadrant D | 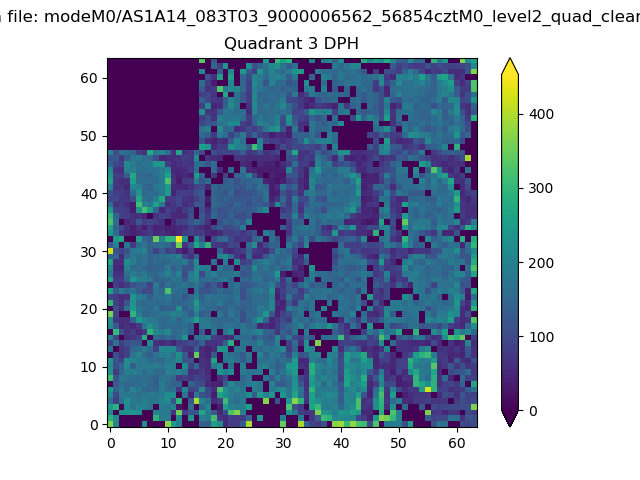 |
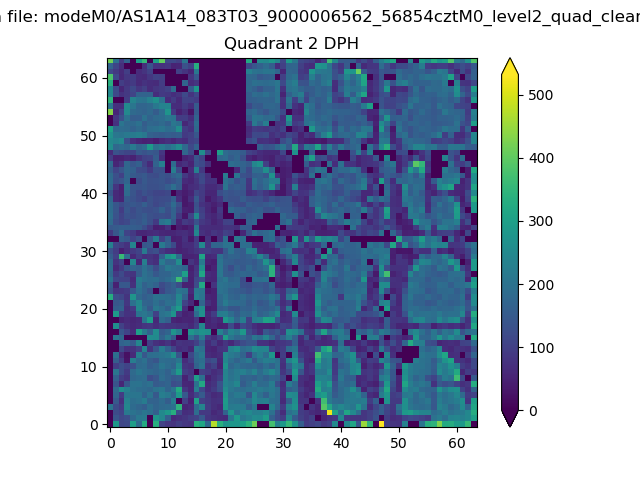 |
Quadrant C |
| Plot type | Count rate plots | Images |
|---|---|---|
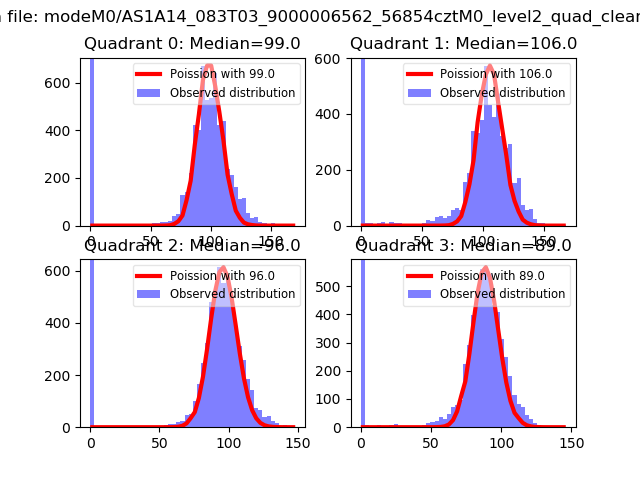
| Comparison with Poisson distribution Blue bars denote a histogram of data divided into 1 sec bins. Red curve is a Poisson curve with rate = median count rate of data. |
 |
 |
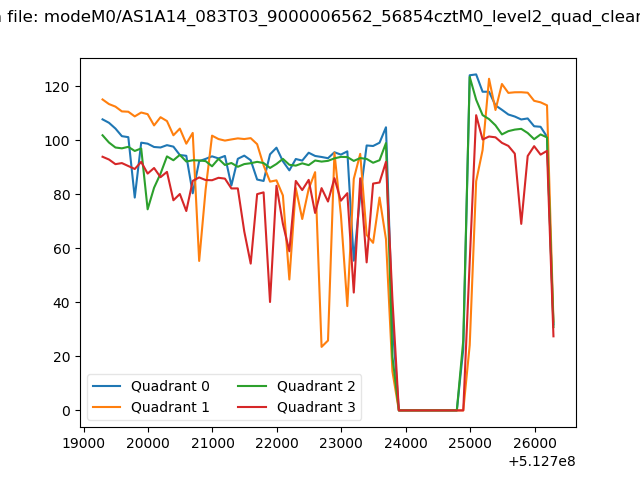
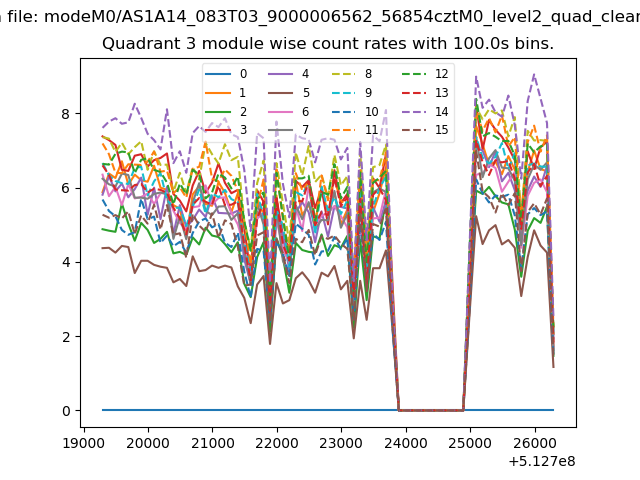
| Quadrant-wise count rates Data is divided into 100 sec bins |
 |
|
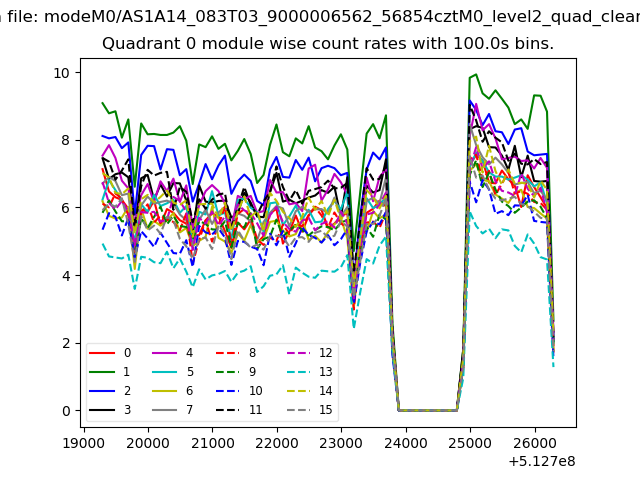
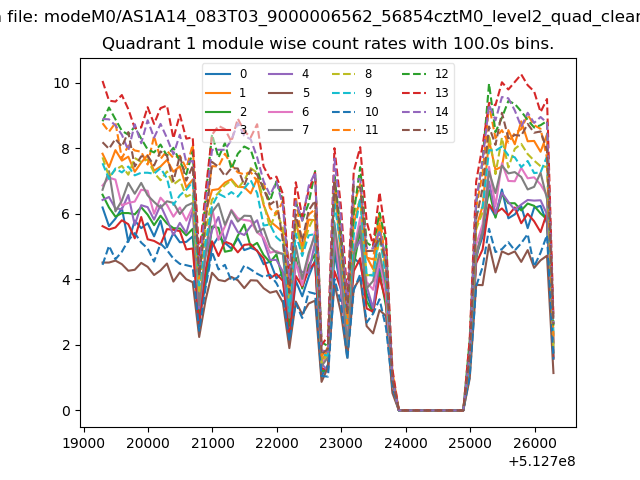
| Module-wise count rates for Quadrant A Data is divided into 100 sec bins |
 |
 |
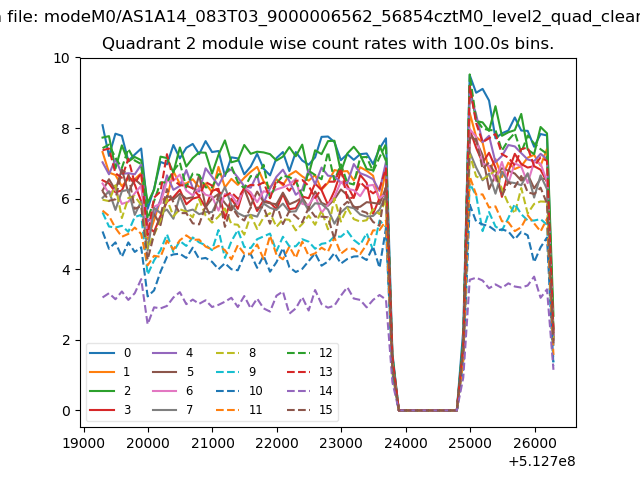
| Module-wise count rates for Quadrant B Data is divided into 100 sec bins |
 |
 |
| Module-wise count rates for Quadrant C Data is divided into 100 sec bins |
 |
 |
| Module-wise count rates for Quadrant D Data is divided into 100 sec bins |
 |
 |
| Parameter | Plot |
|---|---|
| CZT HV Monitor | 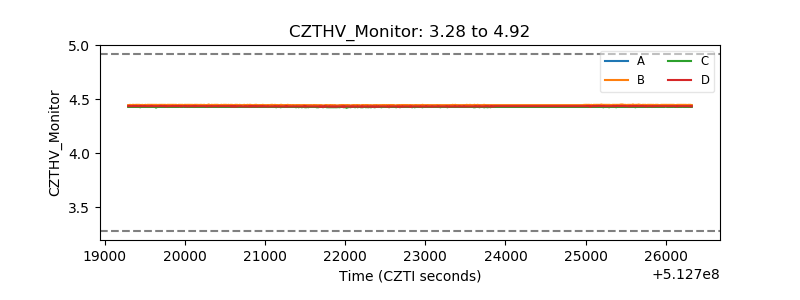 |
| D_VDD | 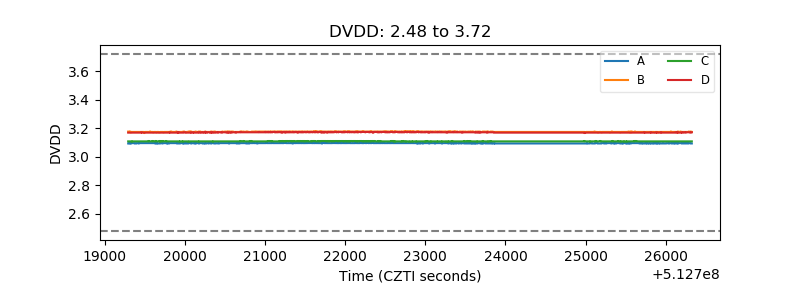 |
| Temperature 1 | 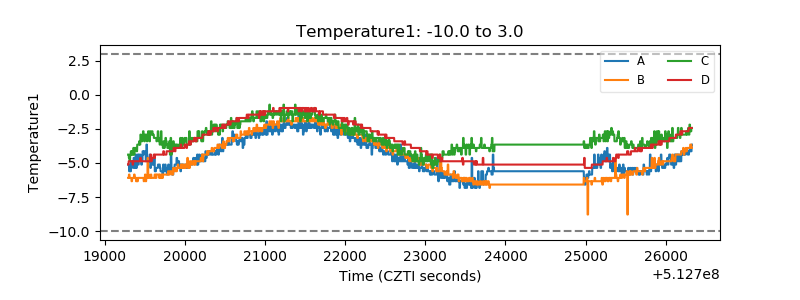 |
| Veto HV Monitor | 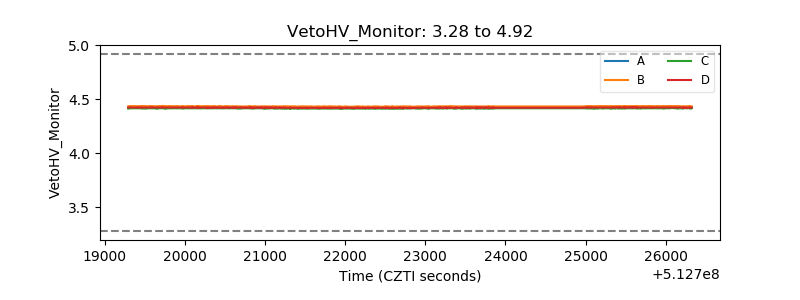 |
| Veto LLD | 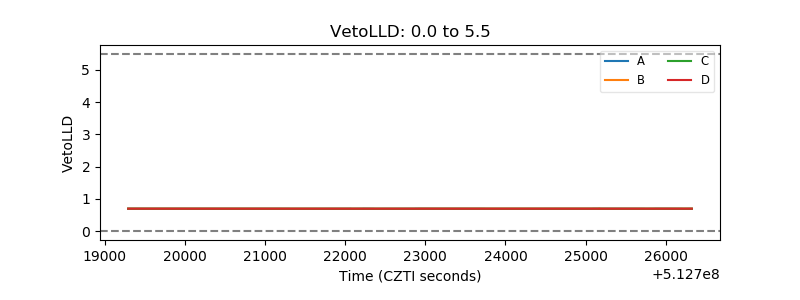 |
| Alpha Counter | 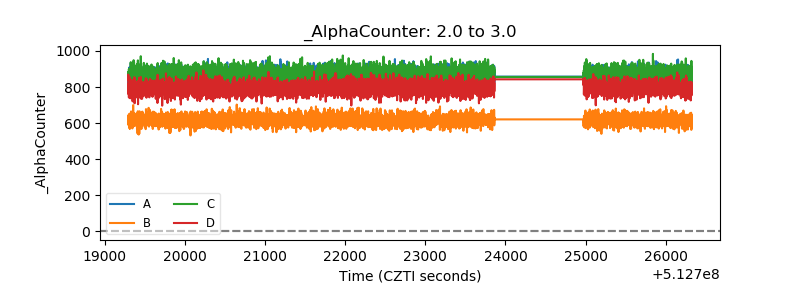 |
| _CPM_Rate | 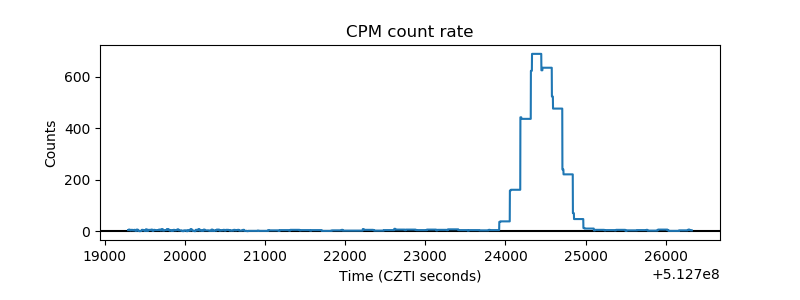 |
| CZT Counter | 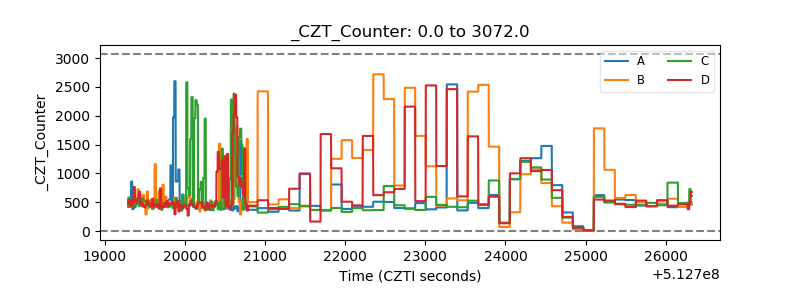 |
| +2.5 Volts monitor |  |
| +5 Volts monitor |  |
| _ROLL_ROT | 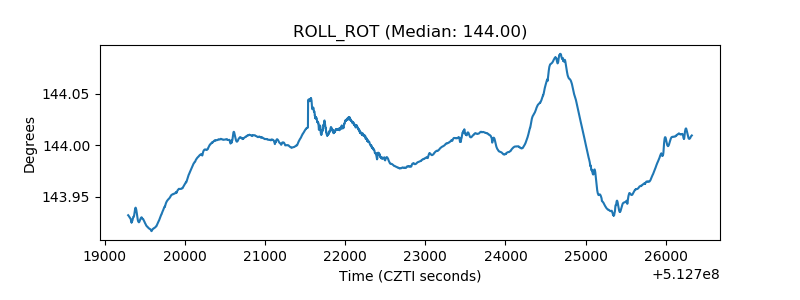 |
| _Roll_DEC | 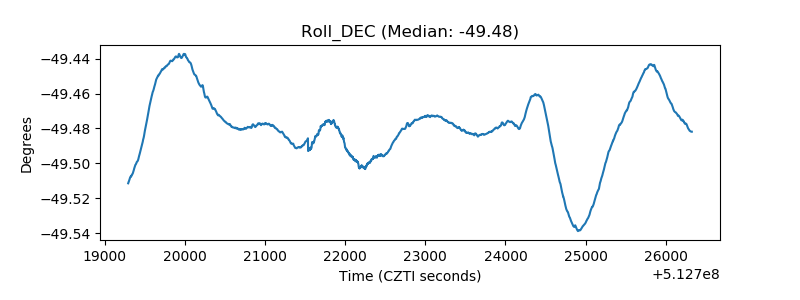 |
| _Roll_RA | 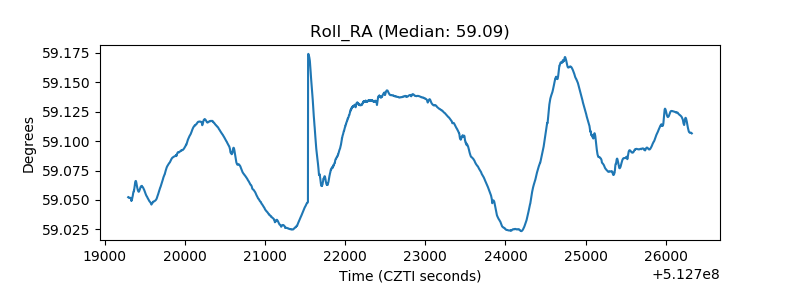 |
| Veto Counter | 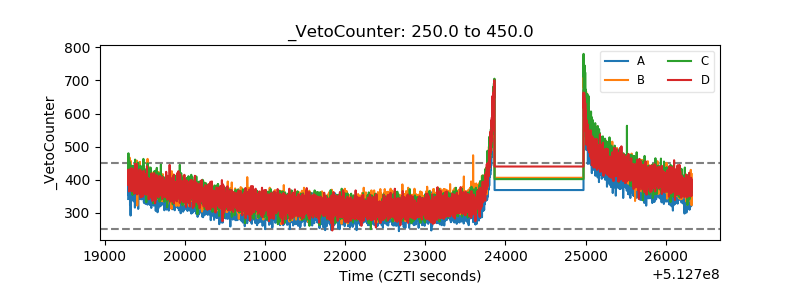 |