| Param | Original file | Final file |
|---|---|---|
| Filename | modeM0/AS1A14_083T03_9000006562_56855cztM0_level2.fits | modeM0/AS1A14_083T03_9000006562_56855cztM0_level2_quad_clean.evt |
| Size (bytes) | 471,214,080 | 101,148,480 |
| Size | 449.4 MB | 96.5 MB |
| Events in quadrant A | 3,650,387 | 676,958 |
| Events in quadrant B | 3,921,371 | 709,975 |
| Events in quadrant C | 3,267,627 | 660,160 |
| Events in quadrant D | 6,081,114 | 547,793 |
| Mode M9 | |||
|---|---|---|---|
| Quadrant | BADHDUFLAG | Total packets | Discarded packets |
| A | 0 | 12 | 0 |
| B | 0 | 12 | 0 |
| C | 0 | 12 | 0 |
| D | 0 | 12 | 0 |
| Mode SS | |||
|---|---|---|---|
| Quadrant | BADHDUFLAG | Total packets | Discarded packets |
| A | 0 | 136 | 0 |
| B | 0 | 136 | 0 |
| C | 0 | 135 | 1 |
| D | 0 | 136 | 0 |
| Mode M0 | |||
|---|---|---|---|
| Quadrant | BADHDUFLAG | Total packets | Discarded packets |
| A | 0 | 15595 | 6 |
| B | 0 | 16308 | 2 |
| C | 0 | 14349 | 7 |
| D | 0 | 22500 | 5 |
| Quadrant | Total seconds | Saturated seconds | Saturation percentage |
|---|---|---|---|
| A | 6714 | 212 | 3.157581% |
| B | 6717 | 359 | 5.344648% |
| C | 6713 | 64 | 0.953374% |
| D | 6716 | 925 | 13.773079% |
Noise dominated data is calculated using 1-second bins in cleaned event files. If a bin has >2000 counts, and if more than 50% of those come from <1% of pixels, then it is considered to be noise-dominated and hence unusable.
| Quadrant | # 1 sec bins | Bins with >0 counts | Bins with >2000 counts | High rate bins dominated by noise | Noise dominated (total time) | Noise dominated (detector-on time) | Marked lightcurve |
|---|---|---|---|---|---|---|---|
| A | 7872 | 6717 | 151 | 151 | 1.92% | 2.25% | 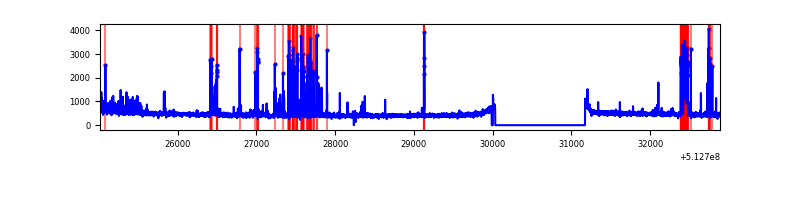 |
| B | 7872 | 6718 | 234 | 234 | 2.97% | 3.48% | 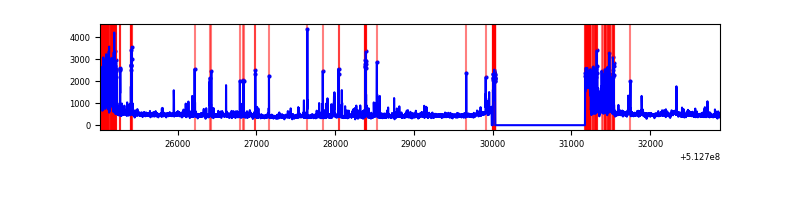 |
| C | 7872 | 6718 | 26 | 26 | 0.33% | 0.39% | 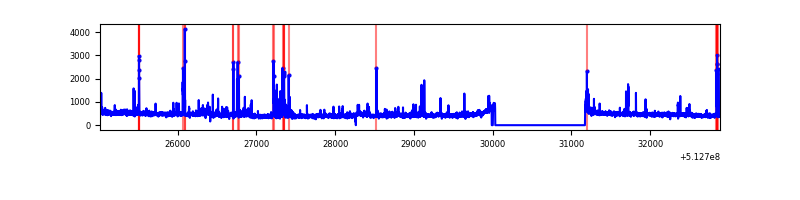 |
| D | 7872 | 6718 | 935 | 935 | 11.88% | 13.92% | 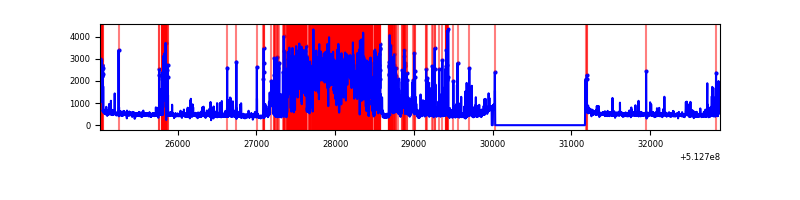 |
Top three noisy pixels from each quadrant. If the there are fewer than three noisy pixels in the level2.evt file, extra rows are filled as -1
| Pixel properties | Quadrant properties | ||||||
|---|---|---|---|---|---|---|---|
| Quadrant | DetID | PixID | Counts | Sigma | Mean | Median | Sigma |
| A | 3 | 62 | 487885 | 2626.89 | 754 | 735 | 185.4 |
| A | 3 | 14 | 152952 | 820.81 | 754 | 735 | 185.4 |
| A | 10 | 251 | 30635 | 161.23 | 754 | 735 | 185.4 |
| B | 10 | 16 | 549218 | 3589.18 | 717 | 691 | 152.8 |
| B | 5 | 185 | 208247 | 1358.1 | 717 | 691 | 152.8 |
| B | 10 | 32 | 73511 | 476.48 | 717 | 691 | 152.8 |
| C | 13 | 3 | 206681 | 1026.49 | 735 | 726 | 200.6 |
| C | 14 | 254 | 45428 | 222.8 | 735 | 726 | 200.6 |
| C | 1 | 16 | 39009 | 190.8 | 735 | 726 | 200.6 |
| D | 2 | 249 | 2463281 | 12339.99 | 707 | 675 | 199.6 |
| D | 8 | 240 | 579582 | 2900.87 | 707 | 675 | 199.6 |
| D | 5 | 113 | 98519 | 490.29 | 707 | 675 | 199.6 |
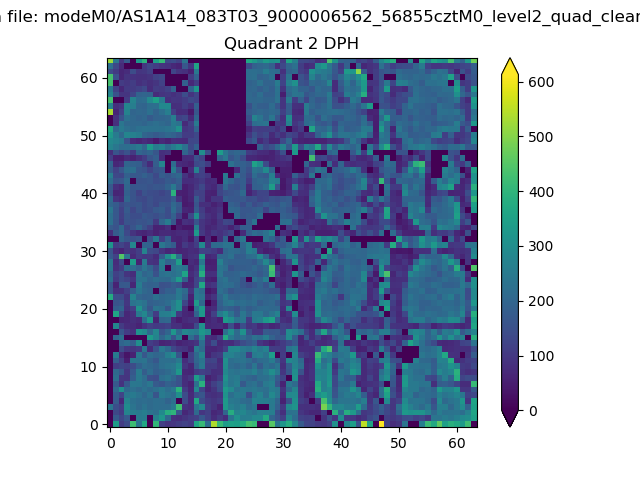
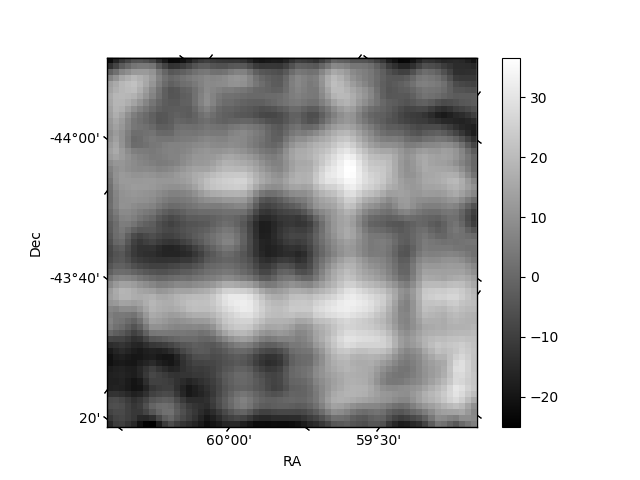
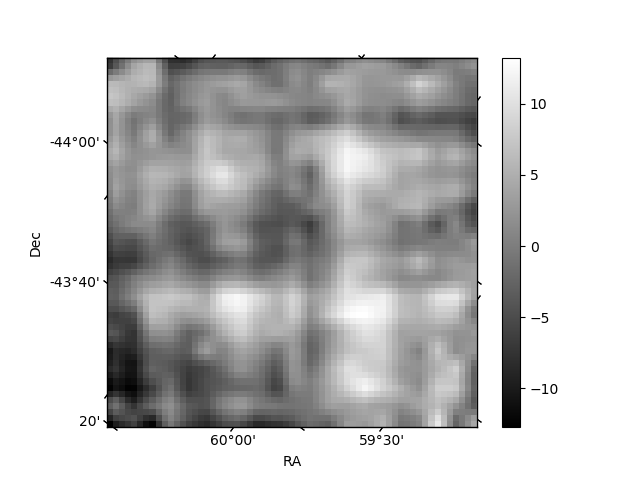
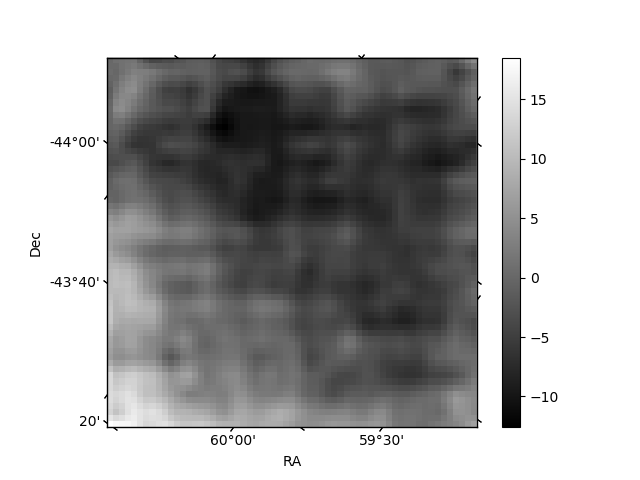
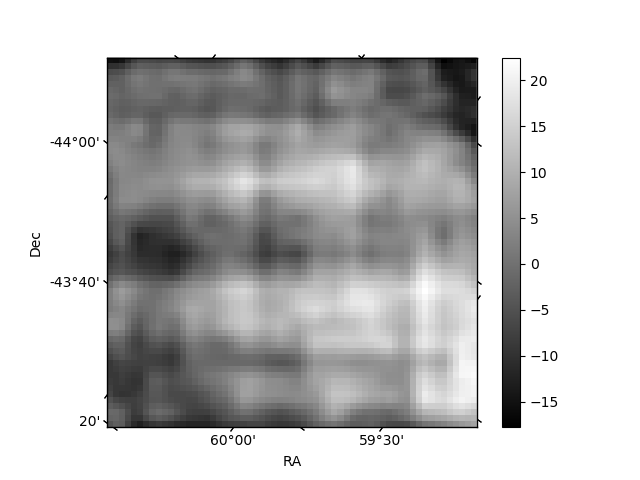
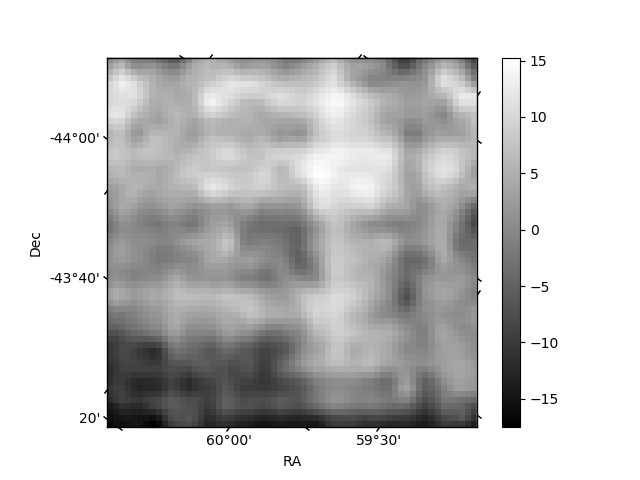
Histogram calculated using DETX and DETY for each event in the final _common_clean file
| Quadrant A | 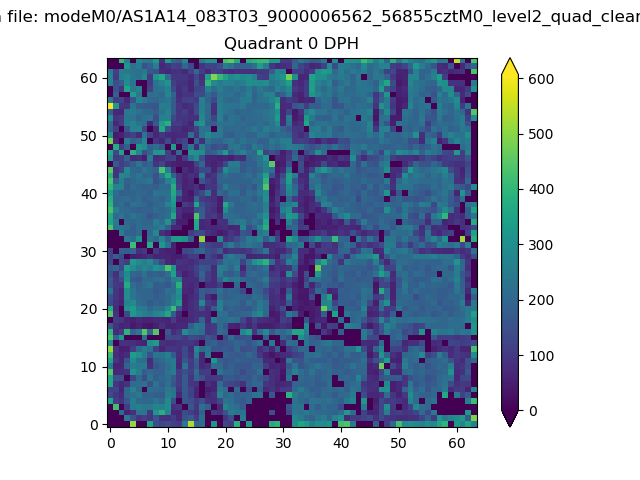 |
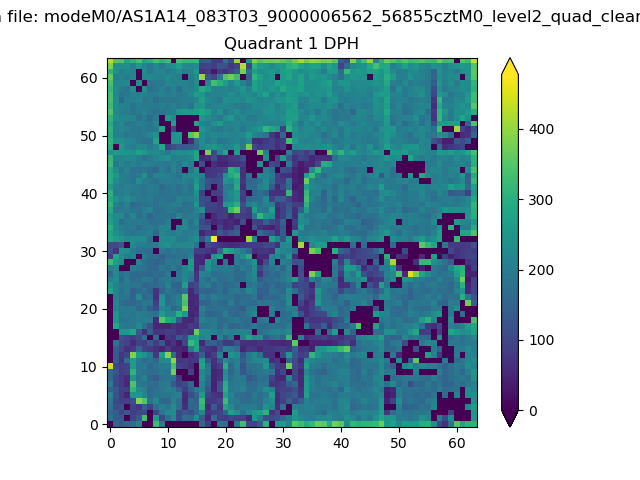 |
Quadrant B |
|---|---|---|---|
| Quadrant D | 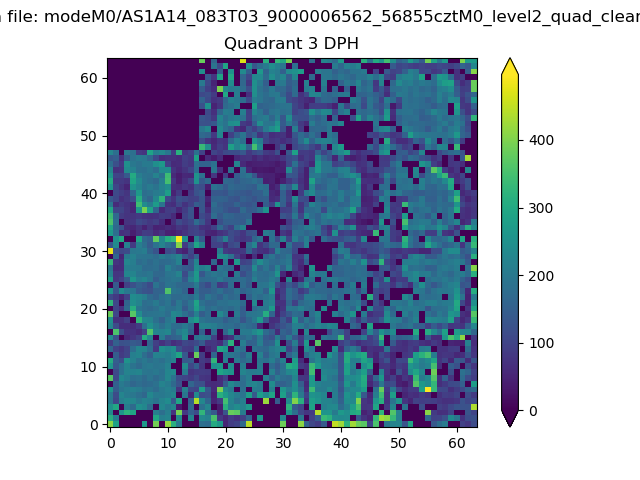 |
 |
Quadrant C |
| Plot type | Count rate plots | Images |
|---|---|---|
| Comparison with Poisson distribution Blue bars denote a histogram of data divided into 1 sec bins. Red curve is a Poisson curve with rate = median count rate of data. |
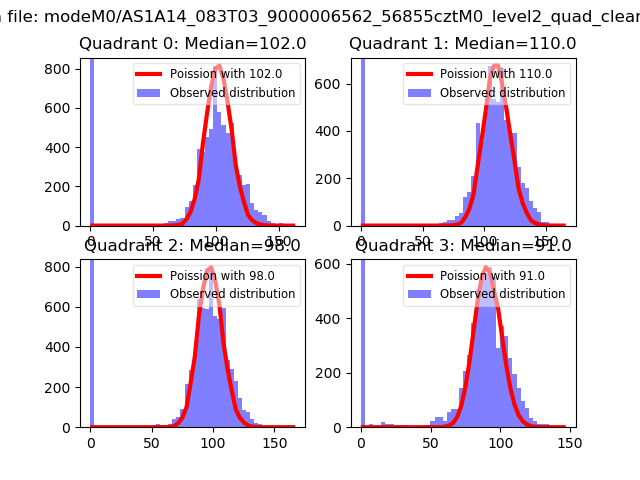 |
 |
| Quadrant-wise count rates Data is divided into 100 sec bins |
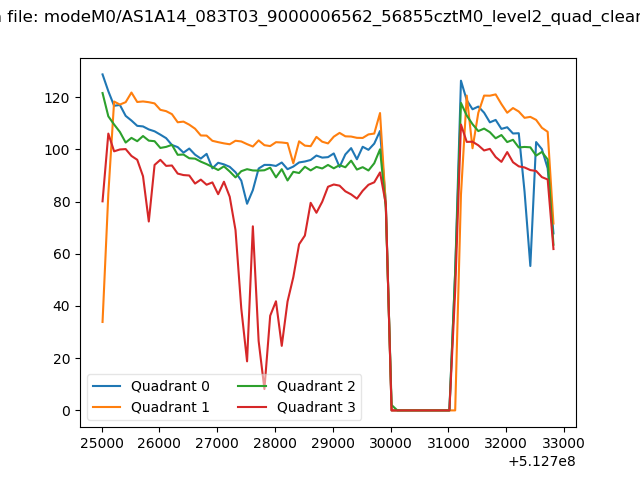 |
|
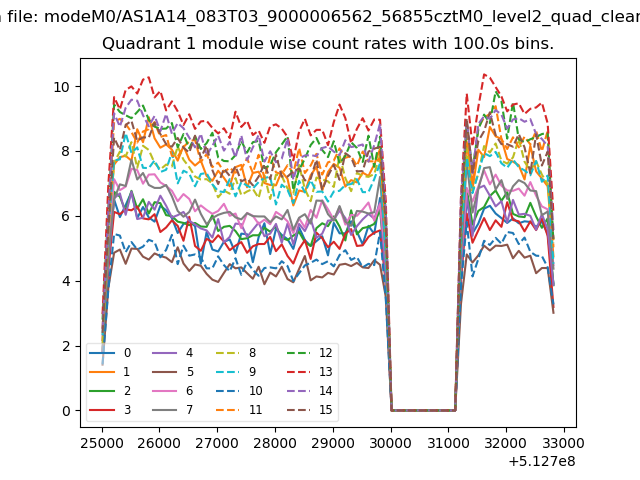
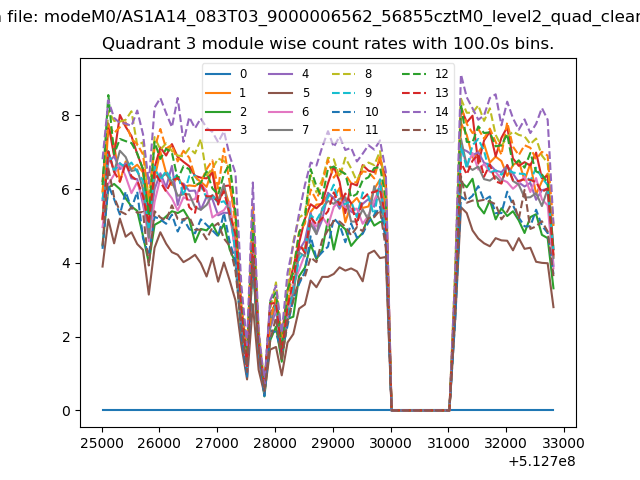
| Module-wise count rates for Quadrant A Data is divided into 100 sec bins |
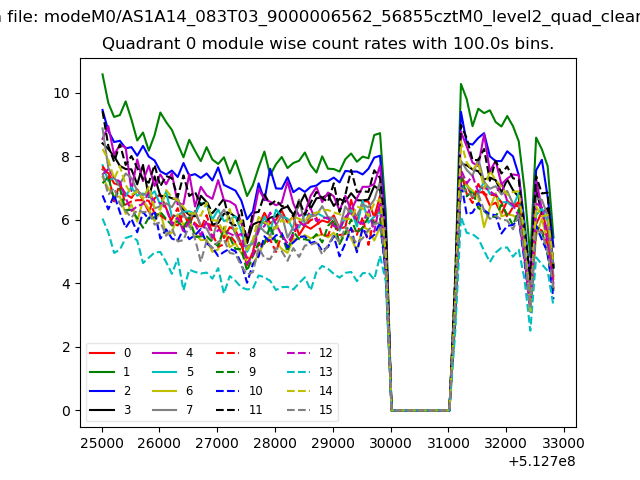 |
 |
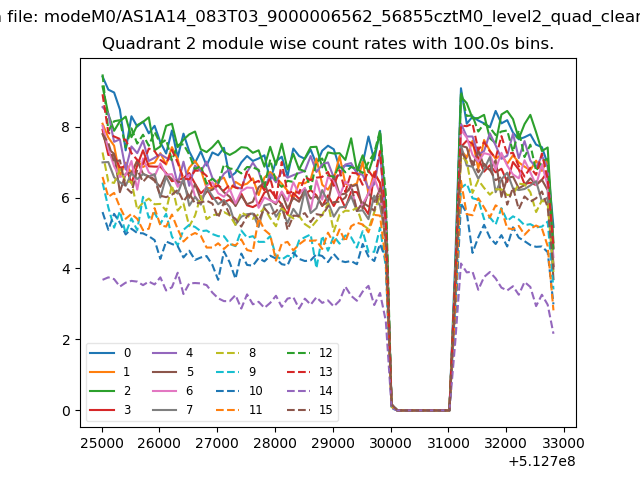
| Module-wise count rates for Quadrant B Data is divided into 100 sec bins |
 |
 |
| Module-wise count rates for Quadrant C Data is divided into 100 sec bins |
 |
 |
| Module-wise count rates for Quadrant D Data is divided into 100 sec bins |
 |
 |
| Parameter | Plot |
|---|---|
| CZT HV Monitor | 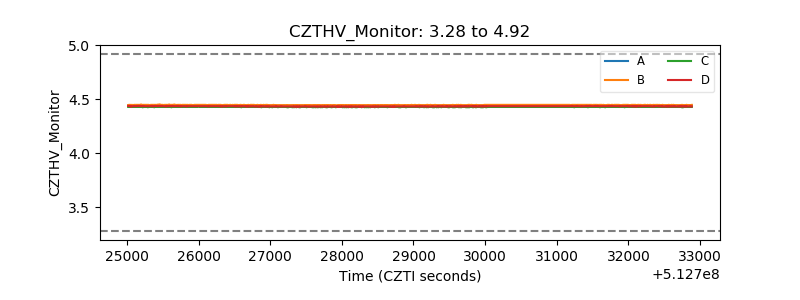 |
| D_VDD | 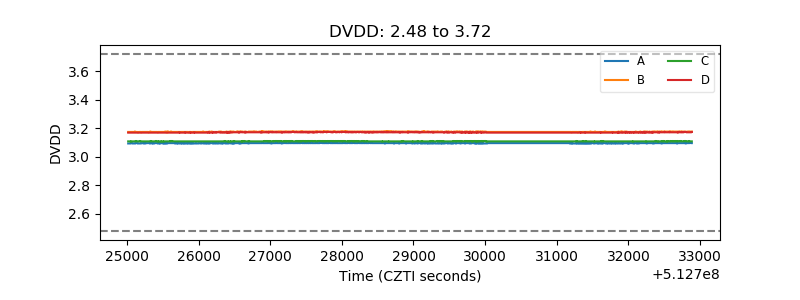 |
| Temperature 1 | 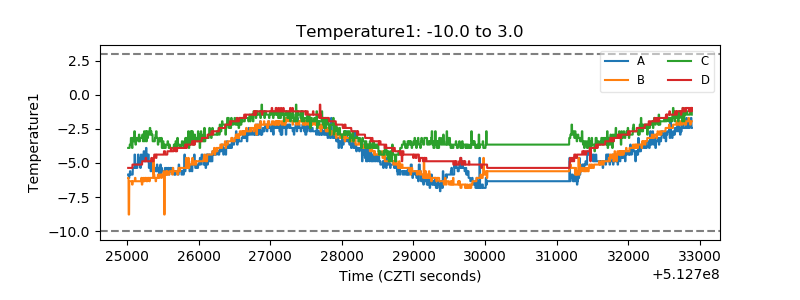 |
| Veto HV Monitor | 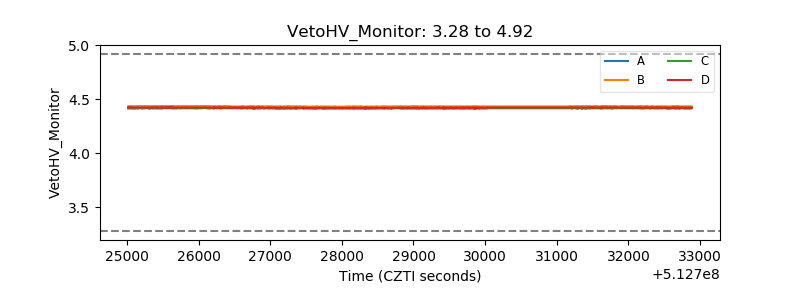 |
| Veto LLD | 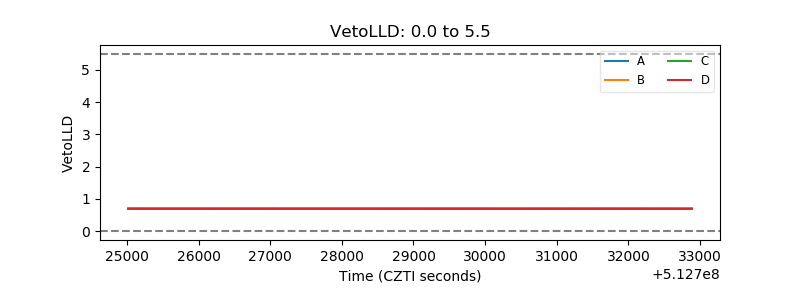 |
| Alpha Counter | 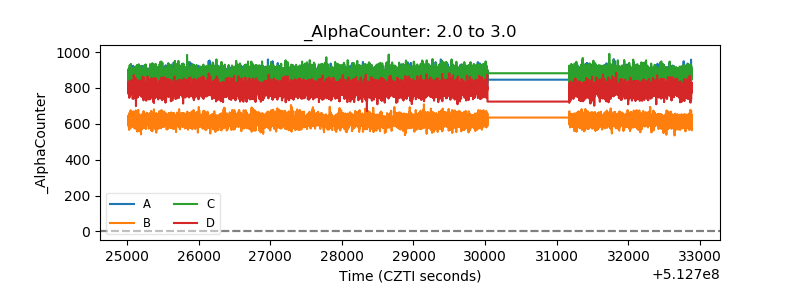 |
| _CPM_Rate | 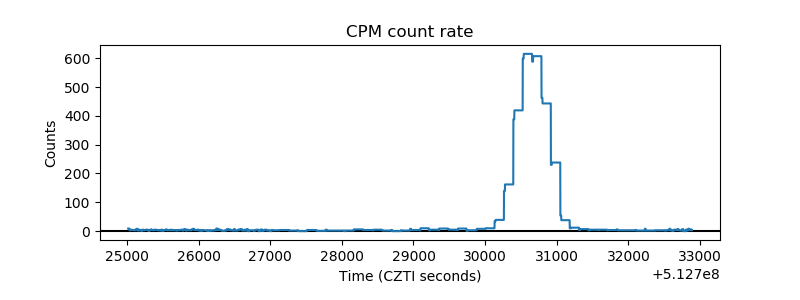 |
| CZT Counter | 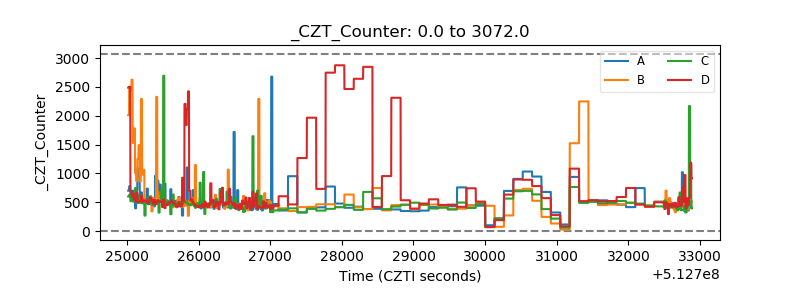 |
| +2.5 Volts monitor | 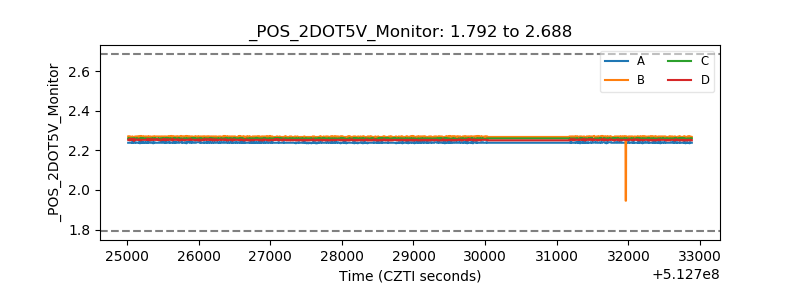 |
| +5 Volts monitor | 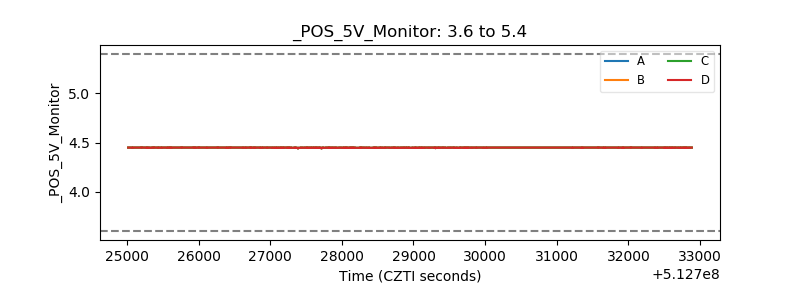 |
| _ROLL_ROT | 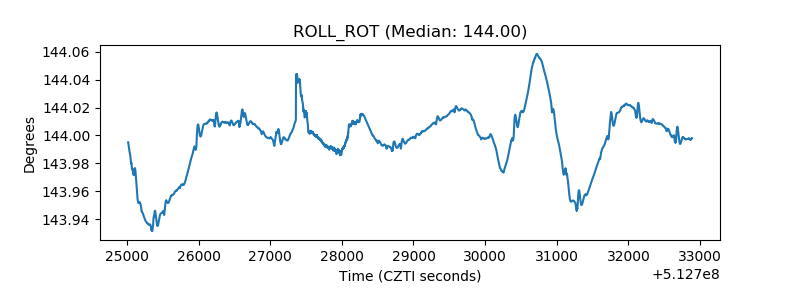 |
| _Roll_DEC | 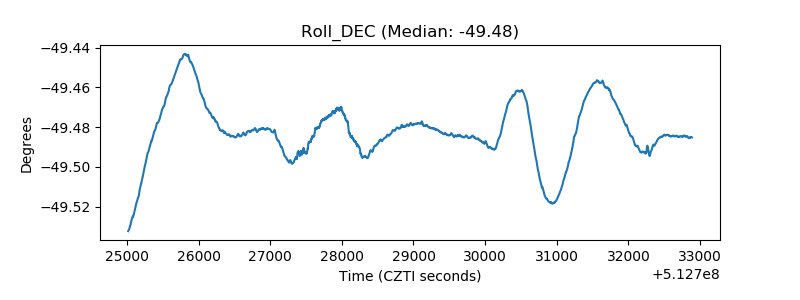 |
| _Roll_RA | 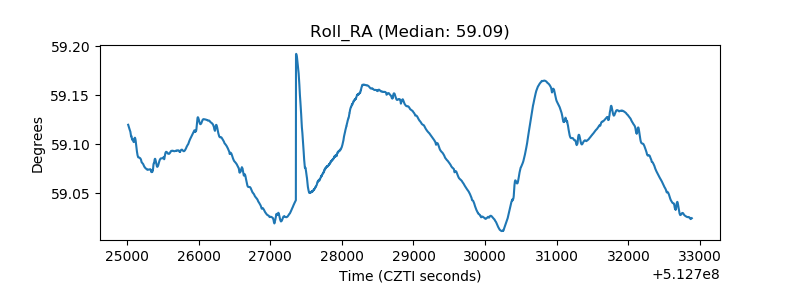 |
| Veto Counter | 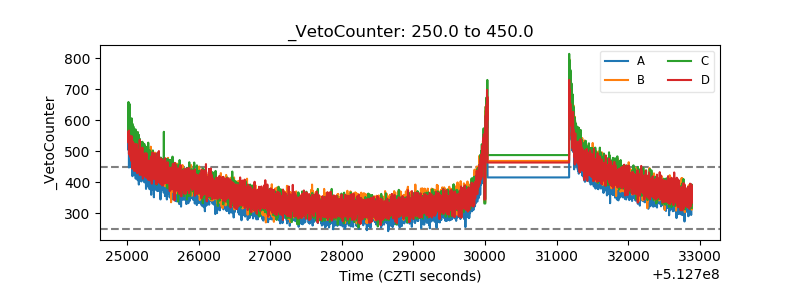 |