| Param | Original file | Final file |
|---|---|---|
| Filename | modeM0/AS1A14_083T03_9000006562_56856cztM0_level2.fits | modeM0/AS1A14_083T03_9000006562_56856cztM0_level2_quad_clean.evt |
| Size (bytes) | 562,118,400 | 87,681,600 |
| Size | 536.1 MB | 83.6 MB |
| Events in quadrant A | 6,280,060 | 514,963 |
| Events in quadrant B | 3,263,210 | 650,965 |
| Events in quadrant C | 4,781,927 | 565,028 |
| Events in quadrant D | 6,002,442 | 492,097 |
| Mode M9 | |||
|---|---|---|---|
| Quadrant | BADHDUFLAG | Total packets | Discarded packets |
| A | 0 | 11 | 0 |
| B | 0 | 11 | 0 |
| C | 0 | 11 | 0 |
| D | 0 | 11 | 0 |
| Mode SS | |||
|---|---|---|---|
| Quadrant | BADHDUFLAG | Total packets | Discarded packets |
| A | 0 | 126 | 0 |
| B | 0 | 126 | 0 |
| C | 0 | 126 | 0 |
| D | 0 | 126 | 0 |
| Mode M0 | |||
|---|---|---|---|
| Quadrant | BADHDUFLAG | Total packets | Discarded packets |
| A | 0 | 22942 | 1 |
| B | 0 | 14050 | 1 |
| C | 0 | 18673 | 2 |
| D | 0 | 21908 | 1 |
| Quadrant | Total seconds | Saturated seconds | Saturation percentage |
|---|---|---|---|
| A | 6186 | 1233 | 19.932105% |
| B | 6186 | 216 | 3.491756% |
| C | 6186 | 469 | 7.581636% |
| D | 6186 | 939 | 15.179437% |
Noise dominated data is calculated using 1-second bins in cleaned event files. If a bin has >2000 counts, and if more than 50% of those come from <1% of pixels, then it is considered to be noise-dominated and hence unusable.
| Quadrant | # 1 sec bins | Bins with >0 counts | Bins with >2000 counts | High rate bins dominated by noise | Noise dominated (total time) | Noise dominated (detector-on time) | Marked lightcurve |
|---|---|---|---|---|---|---|---|
| A | 7306 | 6186 | 1085 | 1085 | 14.85% | 17.54% | 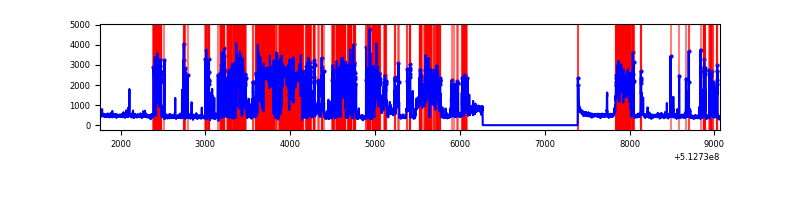 |
| B | 7306 | 6186 | 76 | 76 | 1.04% | 1.23% | 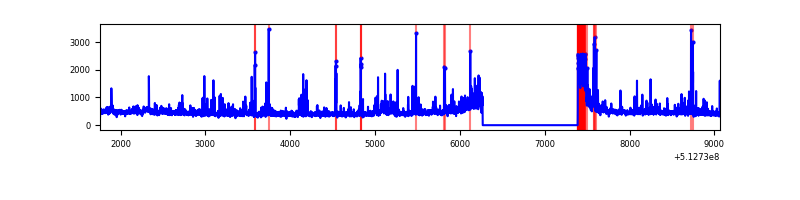 |
| C | 7306 | 6187 | 396 | 396 | 5.42% | 6.40% | 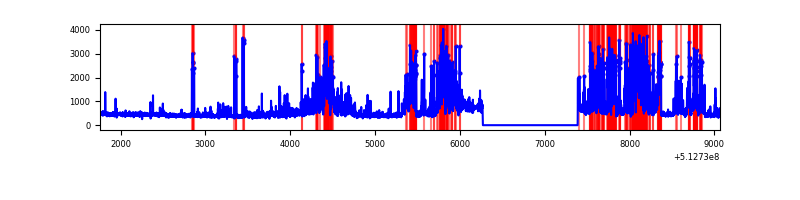 |
| D | 7306 | 6187 | 935 | 935 | 12.80% | 15.11% | 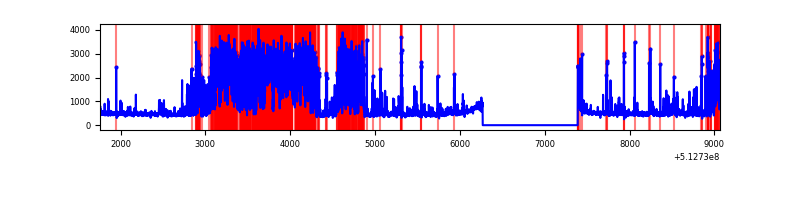 |
Top three noisy pixels from each quadrant. If the there are fewer than three noisy pixels in the level2.evt file, extra rows are filled as -1
| Pixel properties | Quadrant properties | ||||||
|---|---|---|---|---|---|---|---|
| Quadrant | DetID | PixID | Counts | Sigma | Mean | Median | Sigma |
| A | 3 | 62 | 3218177 | 20534.82 | 634 | 618 | 156.7 |
| A | 3 | 46 | 313926 | 1999.57 | 634 | 618 | 156.7 |
| A | 10 | 251 | 184404 | 1172.94 | 634 | 618 | 156.7 |
| B | 10 | 32 | 160848 | 1138.42 | 660 | 636 | 140.7 |
| B | 10 | 247 | 96764 | 683.06 | 660 | 636 | 140.7 |
| B | 10 | 16 | 87569 | 617.72 | 660 | 636 | 140.7 |
| C | 13 | 3 | 1064090 | 6055.65 | 644 | 638 | 175.6 |
| C | 14 | 96 | 771979 | 4392.28 | 644 | 638 | 175.6 |
| C | 15 | 208 | 242471 | 1377.08 | 644 | 638 | 175.6 |
| D | 2 | 249 | 2924364 | 16311.38 | 633 | 604 | 179.2 |
| D | 8 | 240 | 281690 | 1568.15 | 633 | 604 | 179.2 |
| D | 2 | 31 | 61109 | 337.55 | 633 | 604 | 179.2 |
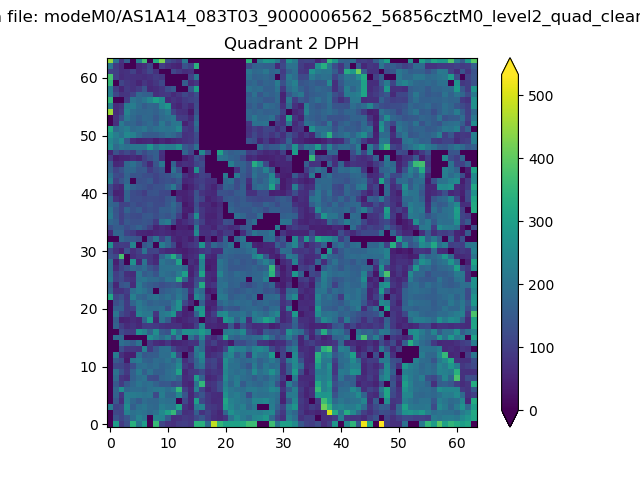
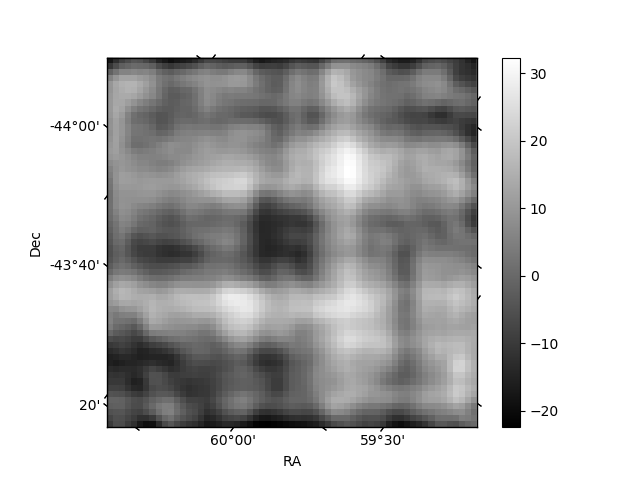
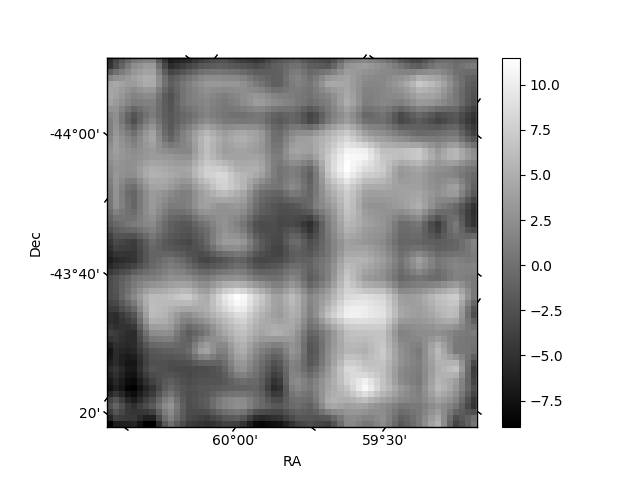
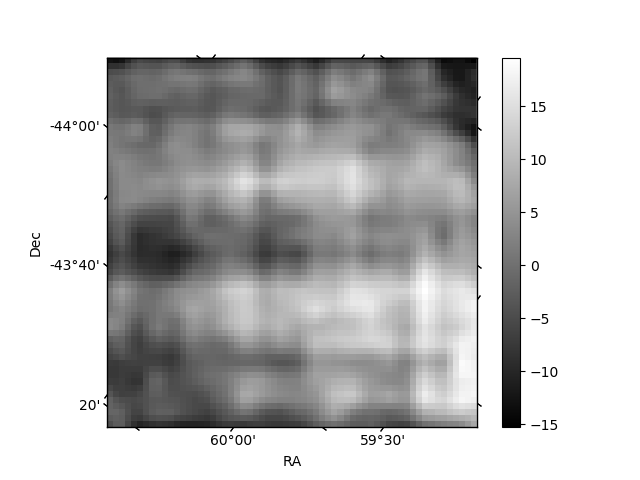
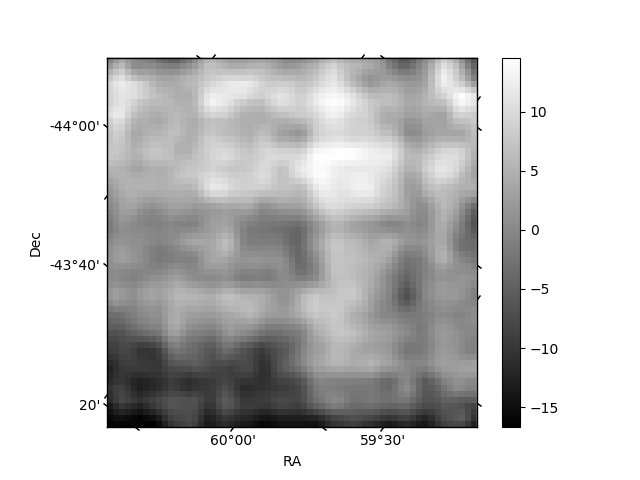
Histogram calculated using DETX and DETY for each event in the final _common_clean file
| Quadrant A | 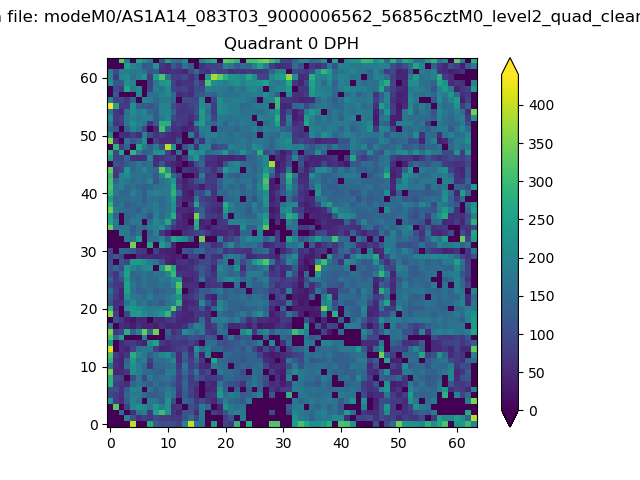 |
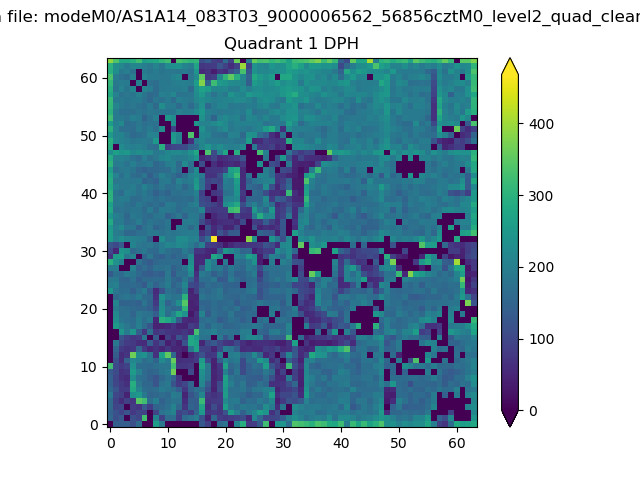 |
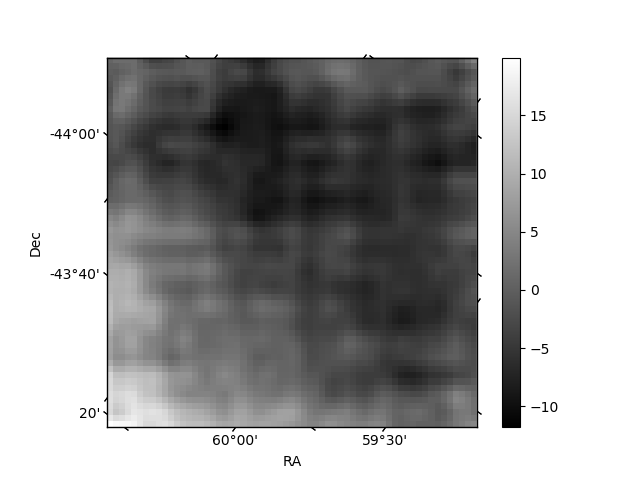
Quadrant B |
|---|---|---|---|
| Quadrant D | 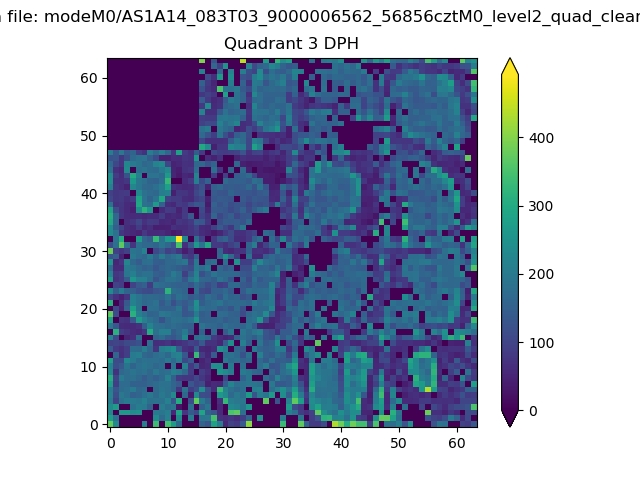 |
 |
Quadrant C |
| Plot type | Count rate plots | Images |
|---|---|---|
| Comparison with Poisson distribution Blue bars denote a histogram of data divided into 1 sec bins. Red curve is a Poisson curve with rate = median count rate of data. |
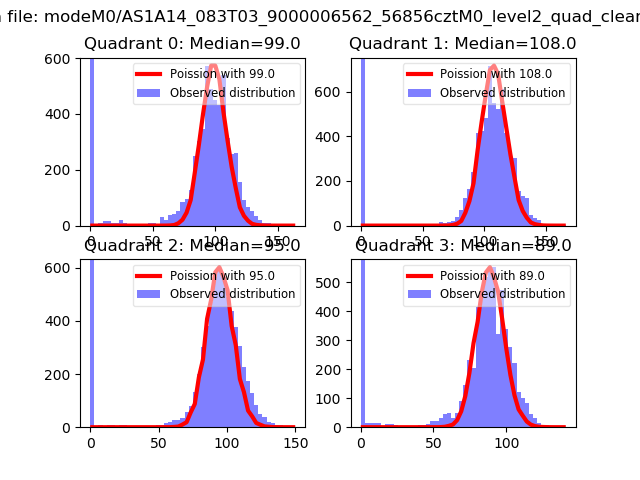 |
 |
| Quadrant-wise count rates Data is divided into 100 sec bins |
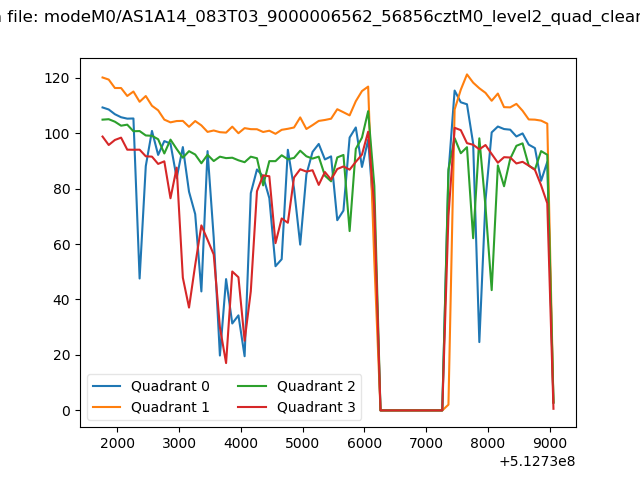 |
|
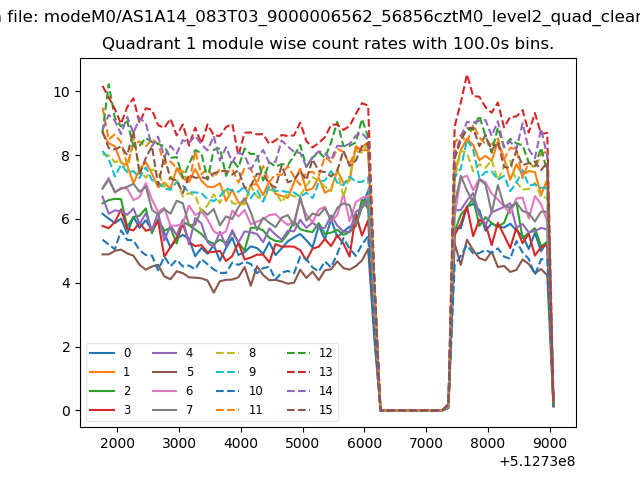
| Module-wise count rates for Quadrant A Data is divided into 100 sec bins |
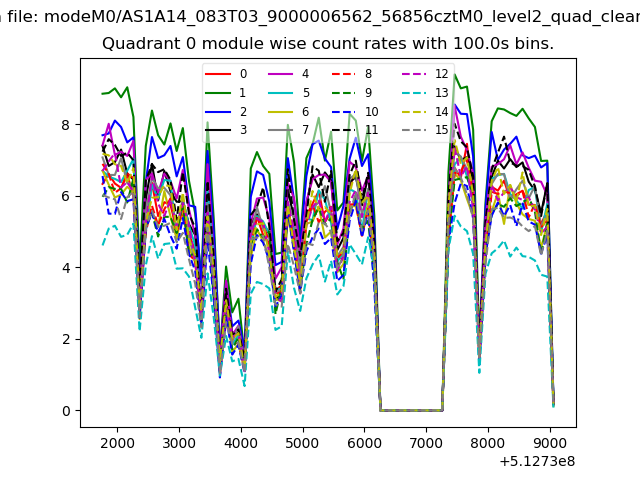 |
 |
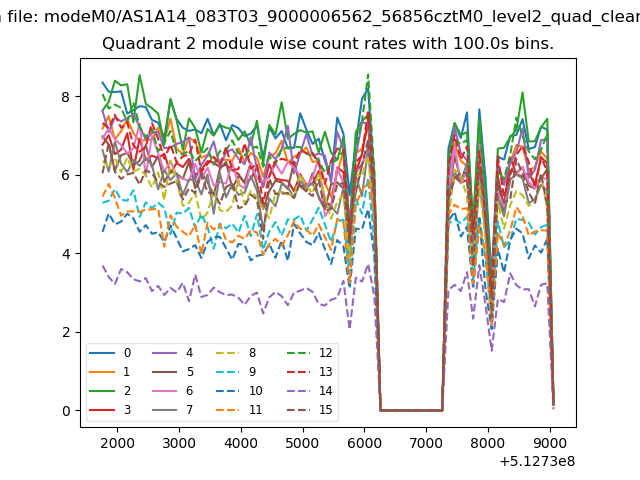
| Module-wise count rates for Quadrant B Data is divided into 100 sec bins |
 |
 |
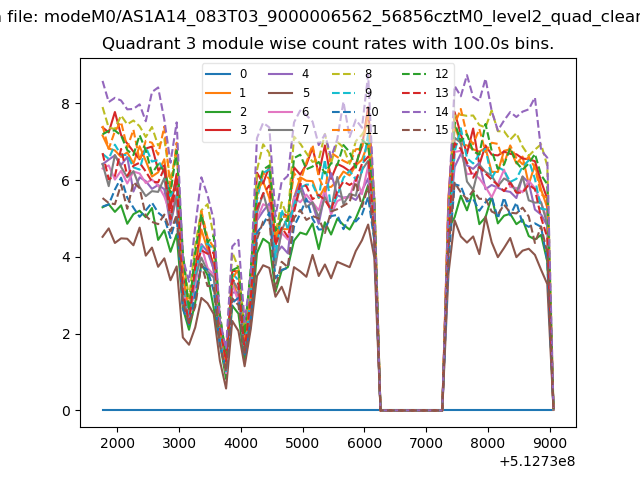
| Module-wise count rates for Quadrant C Data is divided into 100 sec bins |
 |
 |
| Module-wise count rates for Quadrant D Data is divided into 100 sec bins |
 |
 |
| Parameter | Plot |
|---|---|
| CZT HV Monitor | 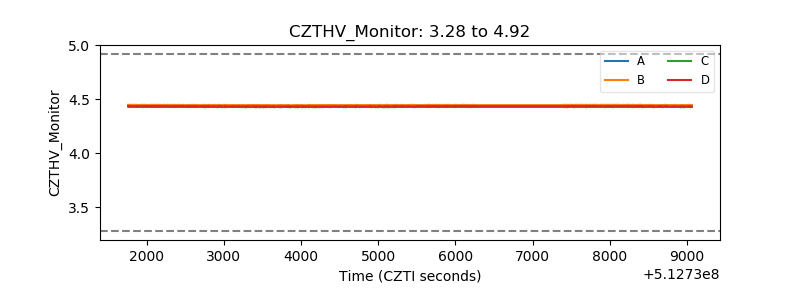 |
| D_VDD | 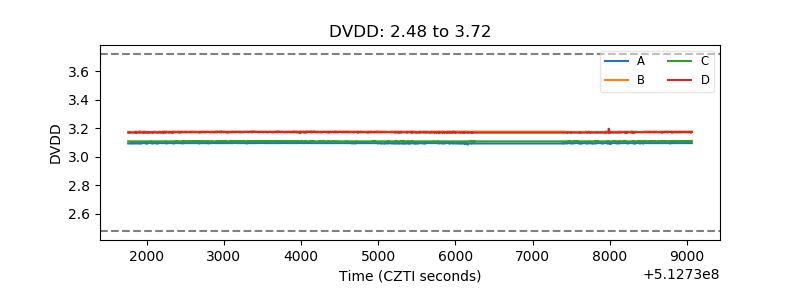 |
| Temperature 1 | 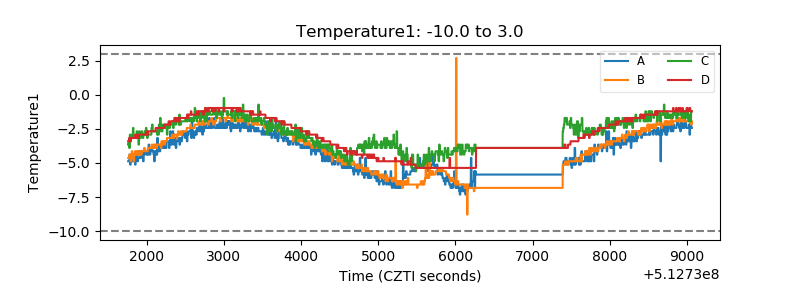 |
| Veto HV Monitor | 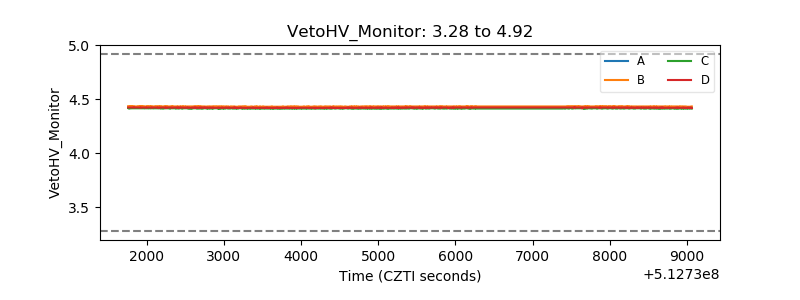 |
| Veto LLD | 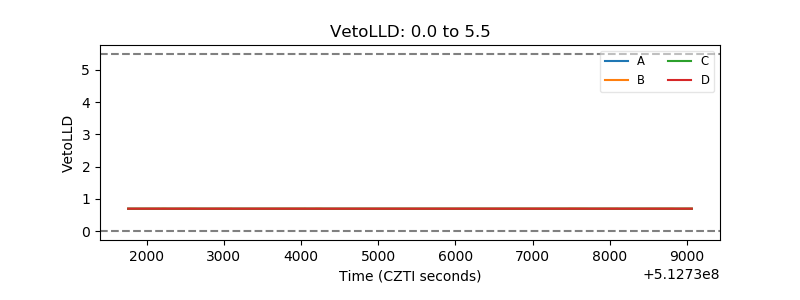 |
| Alpha Counter | 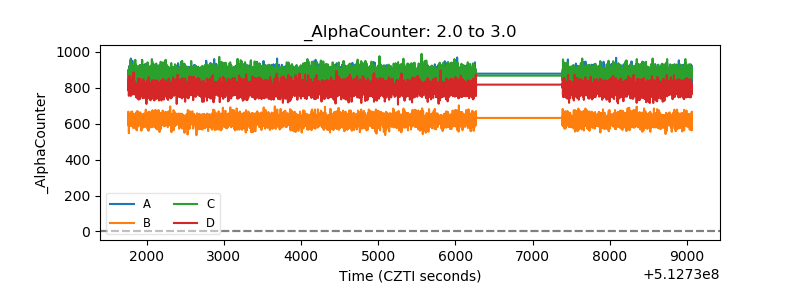 |
| _CPM_Rate | 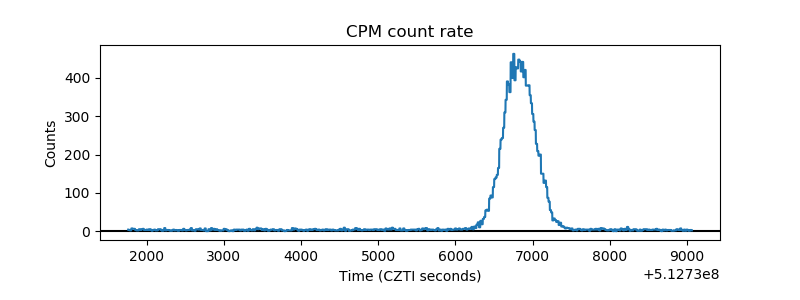 |
| CZT Counter | 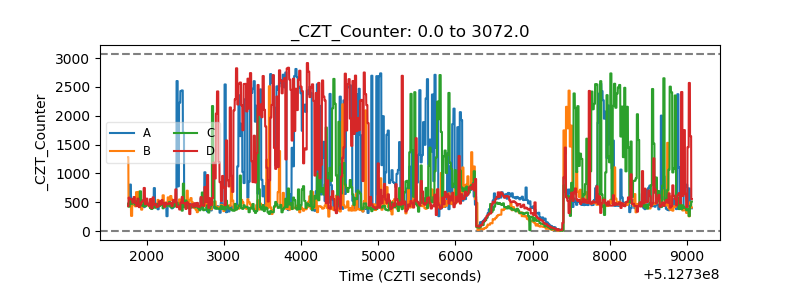 |
| +2.5 Volts monitor |  |
| +5 Volts monitor |  |
| _ROLL_ROT | 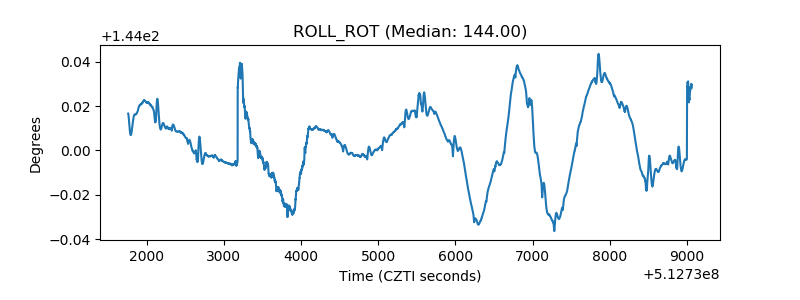 |
| _Roll_DEC | 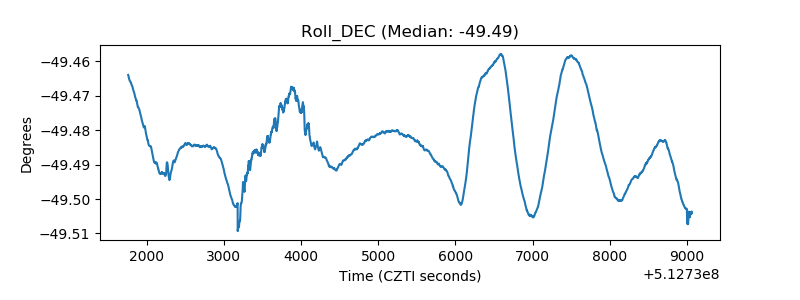 |
| _Roll_RA | 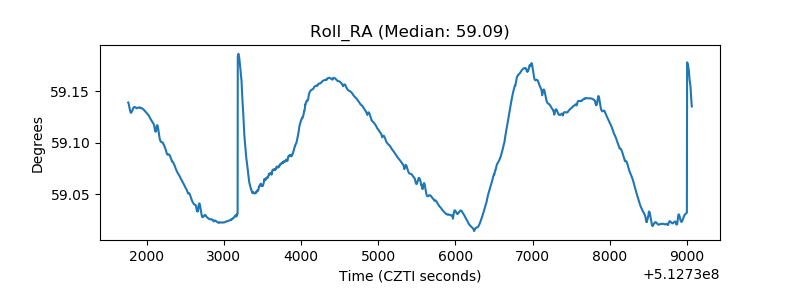 |
| Veto Counter | 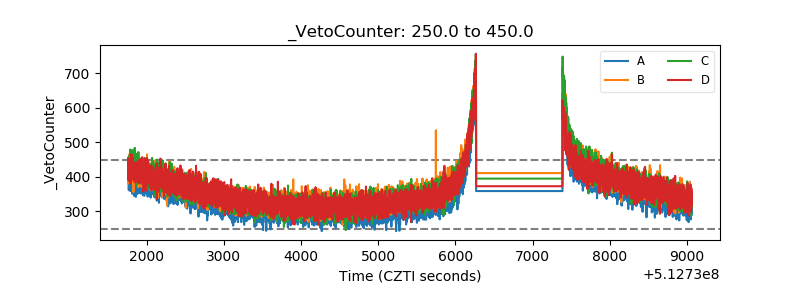 |