| Param | Original file | Final file |
|---|---|---|
| Filename | modeM0/AS1A14_083T03_9000006562_56858cztM0_level2.fits | modeM0/AS1A14_083T03_9000006562_56858cztM0_level2_quad_clean.evt |
| Size (bytes) | 559,471,680 | 88,776,000 |
| Size | 533.6 MB | 84.7 MB |
| Events in quadrant A | 6,797,283 | 494,608 |
| Events in quadrant B | 3,552,974 | 643,116 |
| Events in quadrant C | 3,711,345 | 589,082 |
| Events in quadrant D | 6,138,358 | 503,722 |
| Mode M9 | |||
|---|---|---|---|
| Quadrant | BADHDUFLAG | Total packets | Discarded packets |
| A | 0 | 8 | 0 |
| B | 0 | 8 | 0 |
| C | 0 | 8 | 0 |
| D | 0 | 8 | 0 |
| Mode SS | |||
|---|---|---|---|
| Quadrant | BADHDUFLAG | Total packets | Discarded packets |
| A | 0 | 132 | 0 |
| B | 0 | 132 | 0 |
| C | 0 | 132 | 0 |
| D | 0 | 132 | 0 |
| Mode M0 | |||
|---|---|---|---|
| Quadrant | BADHDUFLAG | Total packets | Discarded packets |
| A | 0 | 24833 | 1 |
| B | 0 | 15436 | 1 |
| C | 0 | 16043 | 1 |
| D | 0 | 22801 | 1 |
| Quadrant | Total seconds | Saturated seconds | Saturation percentage |
|---|---|---|---|
| A | 6561 | 1503 | 22.908093% |
| B | 6561 | 302 | 4.602957% |
| C | 6561 | 172 | 2.621552% |
| D | 6562 | 869 | 13.242914% |
Noise dominated data is calculated using 1-second bins in cleaned event files. If a bin has >2000 counts, and if more than 50% of those come from <1% of pixels, then it is considered to be noise-dominated and hence unusable.
| Quadrant | # 1 sec bins | Bins with >0 counts | Bins with >2000 counts | High rate bins dominated by noise | Noise dominated (total time) | Noise dominated (detector-on time) | Marked lightcurve |
|---|---|---|---|---|---|---|---|
| A | 7325 | 6560 | 1354 | 1354 | 18.48% | 20.64% | 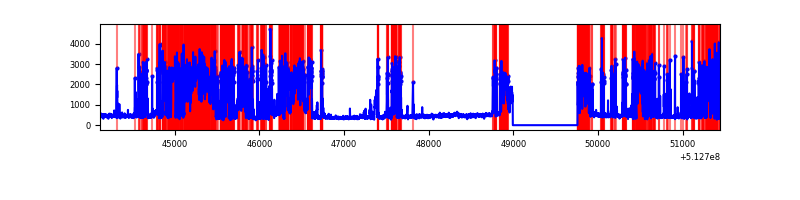 |
| B | 7326 | 6562 | 175 | 175 | 2.39% | 2.67% | 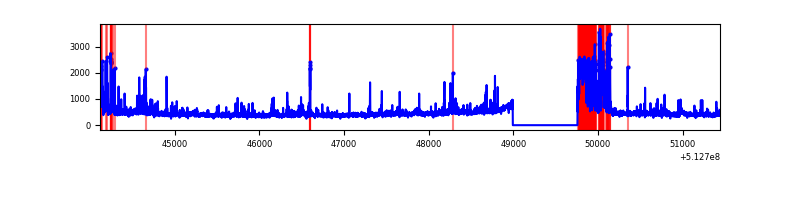 |
| C | 7326 | 6562 | 161 | 161 | 2.20% | 2.45% | 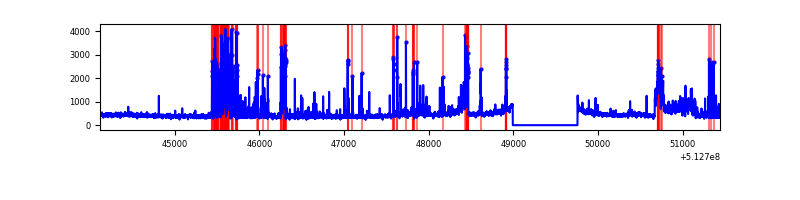 |
| D | 7327 | 6563 | 878 | 878 | 11.98% | 13.38% | 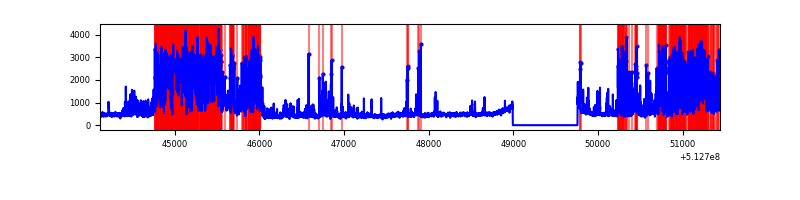 |
Top three noisy pixels from each quadrant. If the there are fewer than three noisy pixels in the level2.evt file, extra rows are filled as -1
| Pixel properties | Quadrant properties | ||||||
|---|---|---|---|---|---|---|---|
| Quadrant | DetID | PixID | Counts | Sigma | Mean | Median | Sigma |
| A | 3 | 62 | 4027781 | 25983.92 | 625 | 611 | 155.0 |
| A | 3 | 46 | 231190 | 1487.73 | 625 | 611 | 155.0 |
| A | 3 | 14 | 27176 | 171.4 | 625 | 611 | 155.0 |
| B | 10 | 16 | 549697 | 3820.47 | 667 | 642 | 143.7 |
| B | 5 | 185 | 103373 | 714.83 | 667 | 642 | 143.7 |
| B | 10 | 32 | 52960 | 364.04 | 667 | 642 | 143.7 |
| C | 13 | 3 | 655955 | 3603.47 | 666 | 660 | 181.9 |
| C | 9 | 38 | 266318 | 1460.85 | 666 | 660 | 181.9 |
| C | 14 | 96 | 80373 | 438.34 | 666 | 660 | 181.9 |
| D | 2 | 249 | 2608670 | 14372.27 | 638 | 609 | 181.5 |
| D | 8 | 240 | 598345 | 3293.95 | 638 | 609 | 181.5 |
| D | 5 | 113 | 172565 | 947.6 | 638 | 609 | 181.5 |
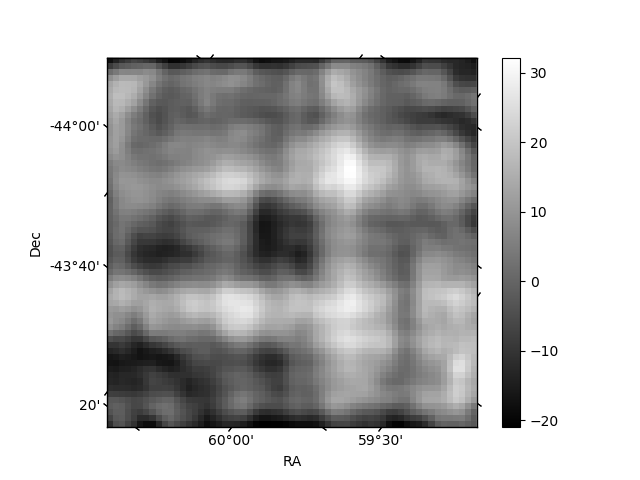
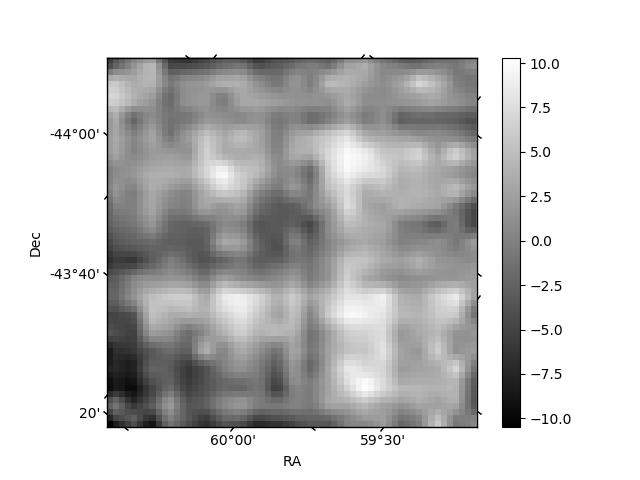
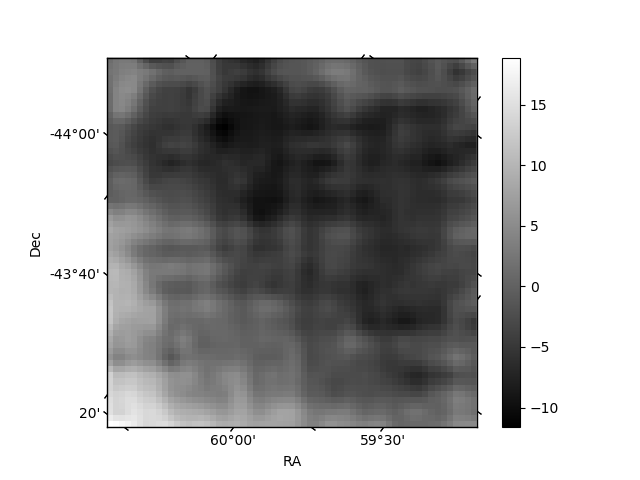
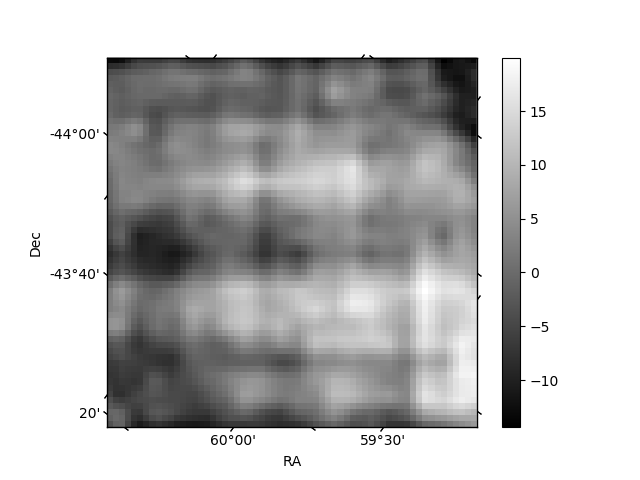
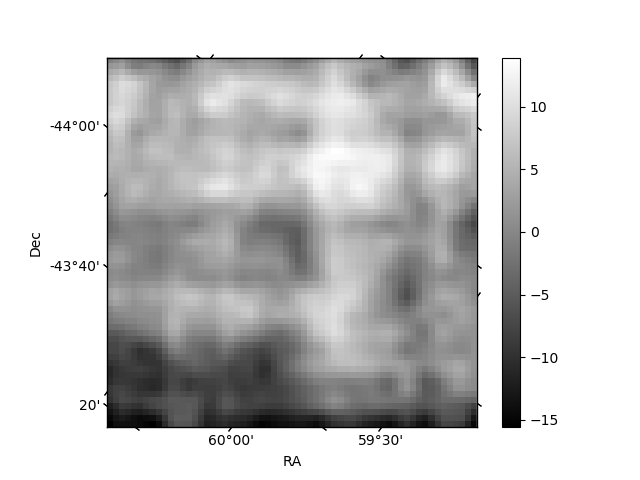
Histogram calculated using DETX and DETY for each event in the final _common_clean file
| Quadrant A | 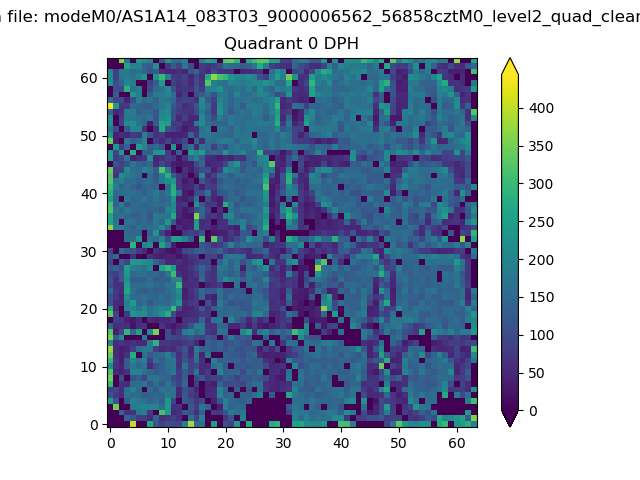 |
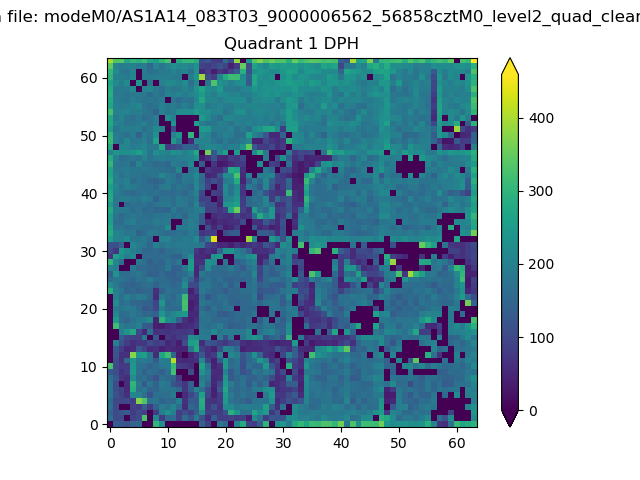 |
Quadrant B |
|---|---|---|---|
| Quadrant D | 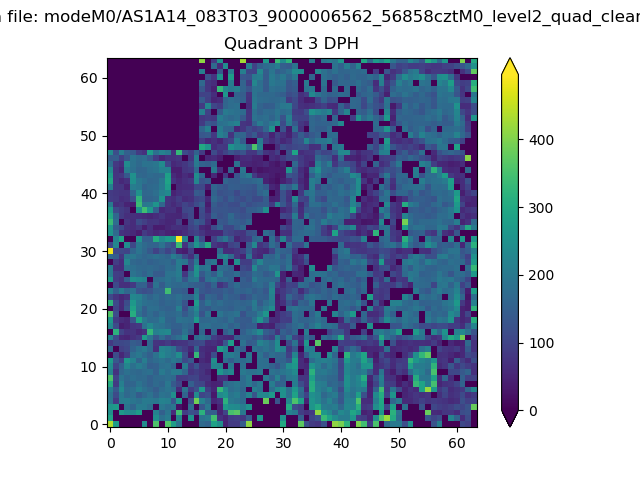 |
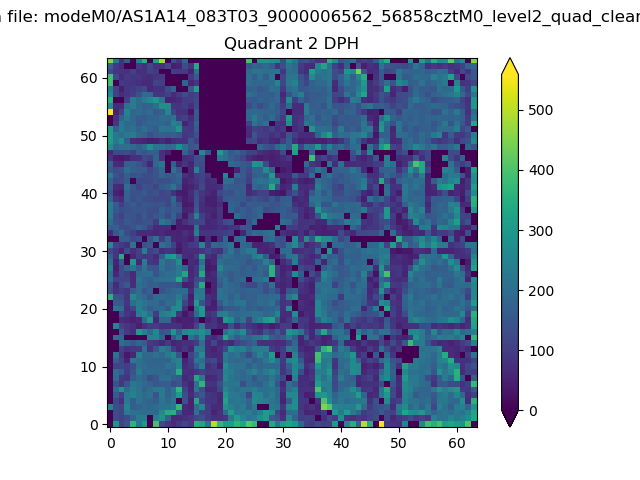 |
Quadrant C |
| Plot type | Count rate plots | Images |
|---|---|---|
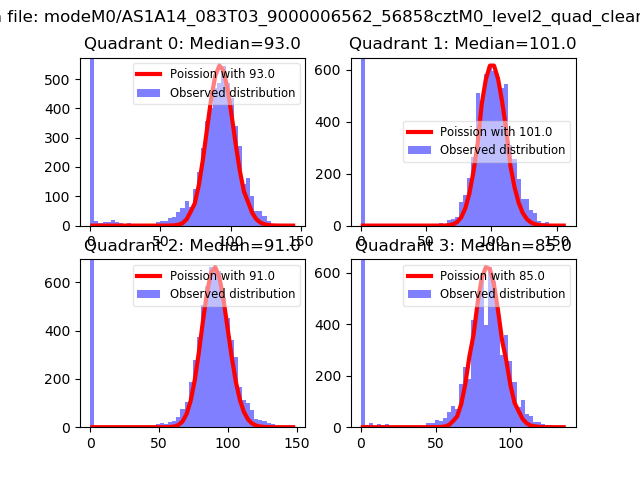
| Comparison with Poisson distribution Blue bars denote a histogram of data divided into 1 sec bins. Red curve is a Poisson curve with rate = median count rate of data. |
 |
 |
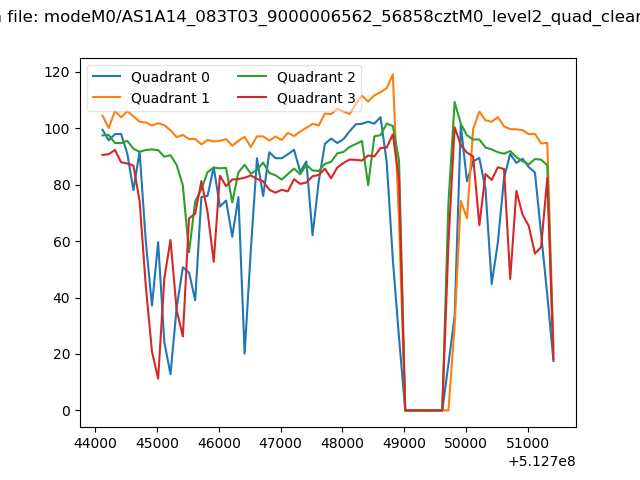
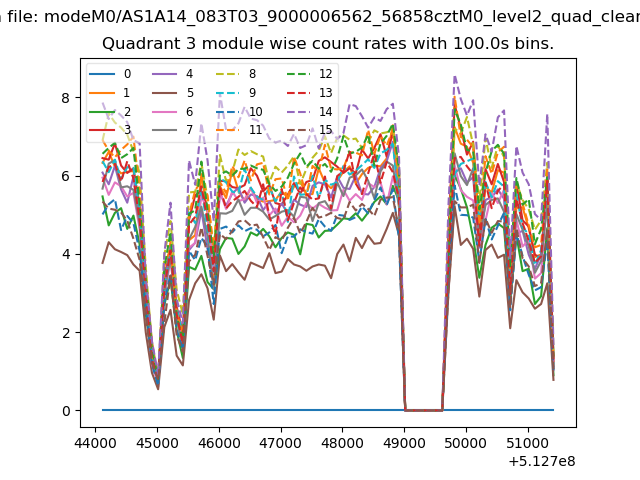
| Quadrant-wise count rates Data is divided into 100 sec bins |
 |
|
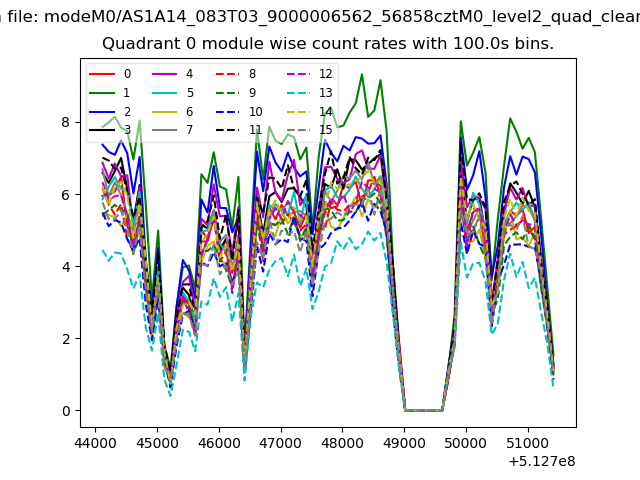
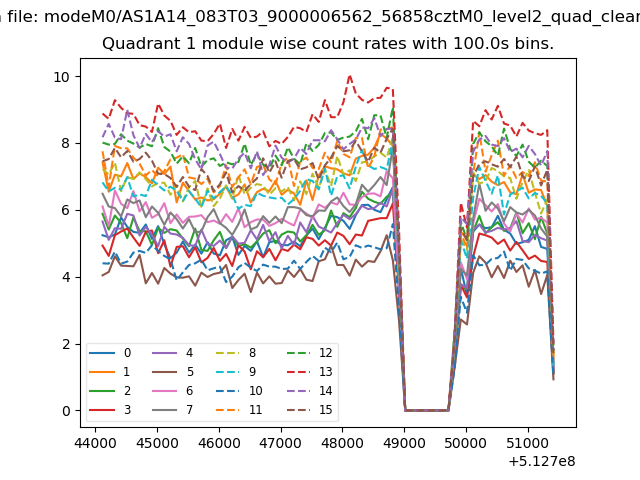
| Module-wise count rates for Quadrant A Data is divided into 100 sec bins |
 |
 |
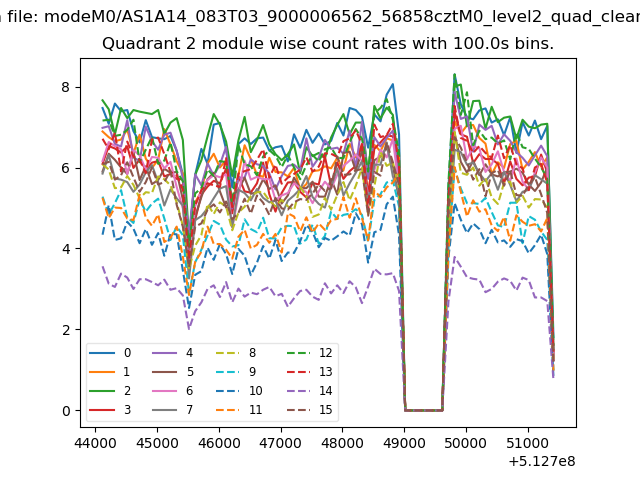
| Module-wise count rates for Quadrant B Data is divided into 100 sec bins |
 |
 |
| Module-wise count rates for Quadrant C Data is divided into 100 sec bins |
 |
 |
| Module-wise count rates for Quadrant D Data is divided into 100 sec bins |
 |
 |
| Parameter | Plot |
|---|---|
| CZT HV Monitor |  |
| D_VDD | 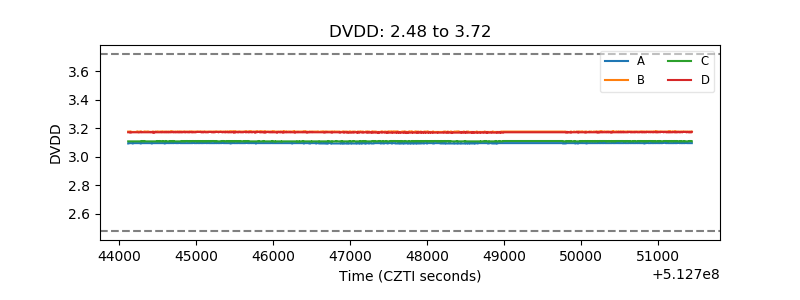 |
| Temperature 1 | 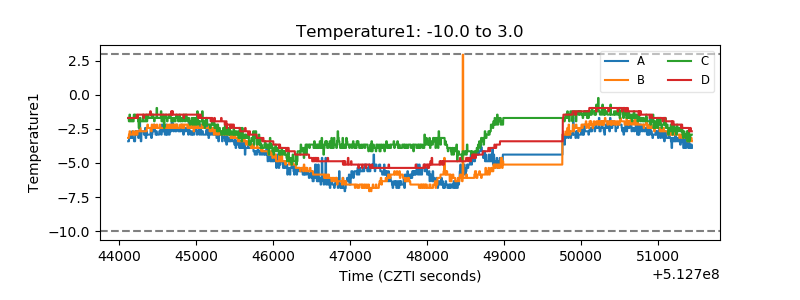 |
| Veto HV Monitor | 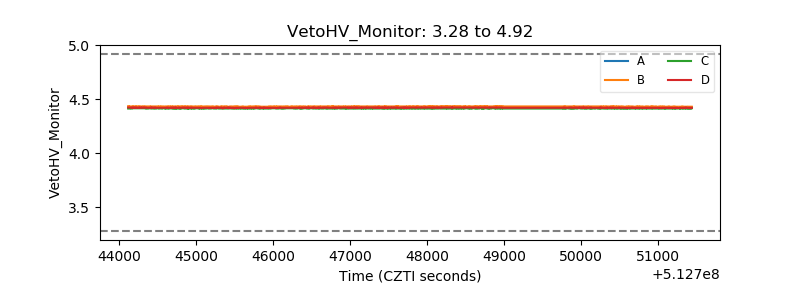 |
| Veto LLD | 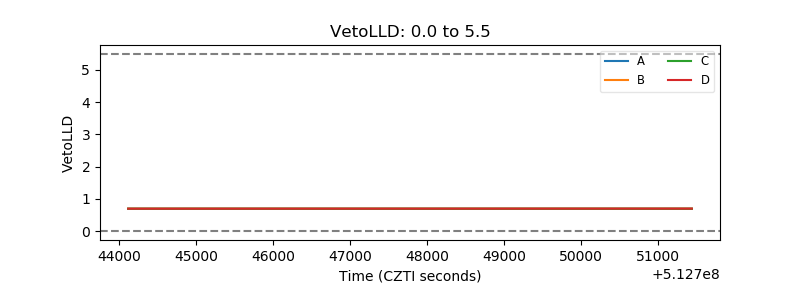 |
| Alpha Counter | 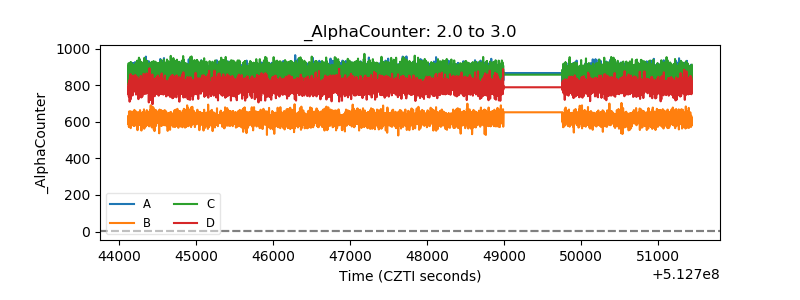 |
| _CPM_Rate | 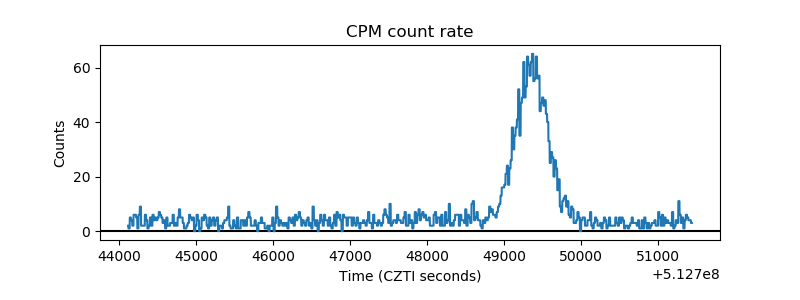 |
| CZT Counter | 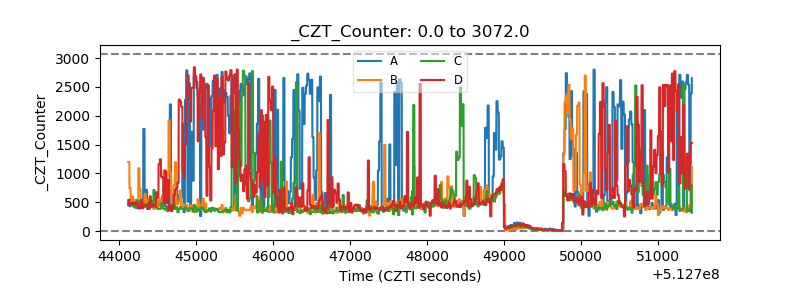 |
| +2.5 Volts monitor | 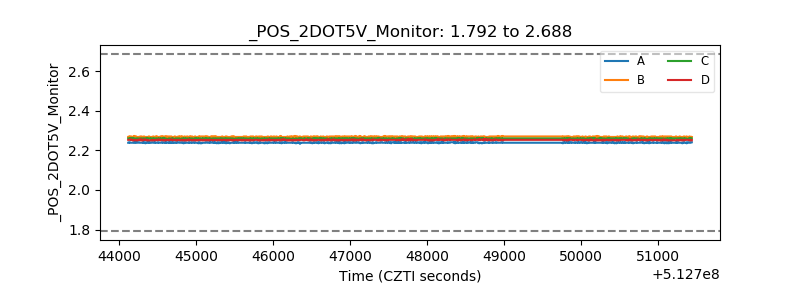 |
| +5 Volts monitor | 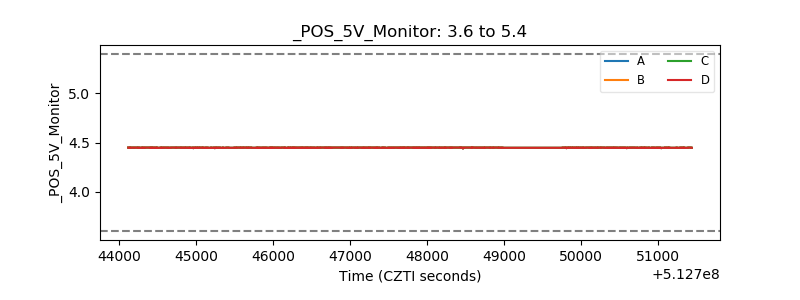 |
| _ROLL_ROT | 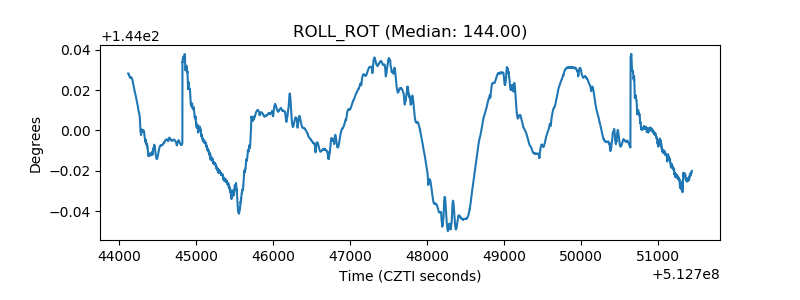 |
| _Roll_DEC | 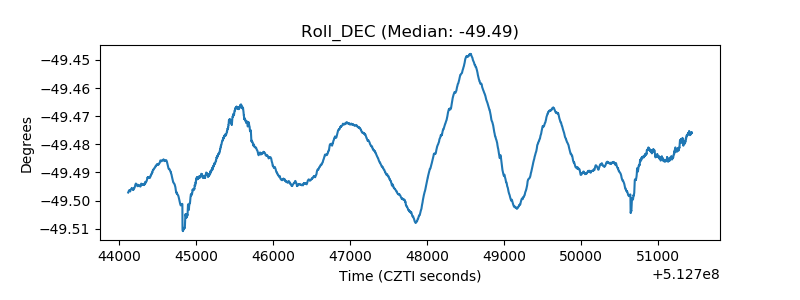 |
| _Roll_RA | 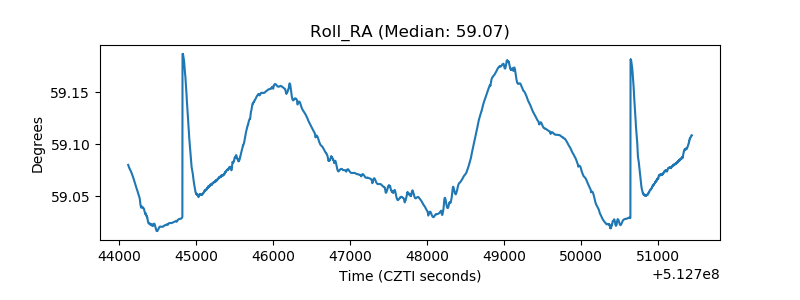 |
| Veto Counter | 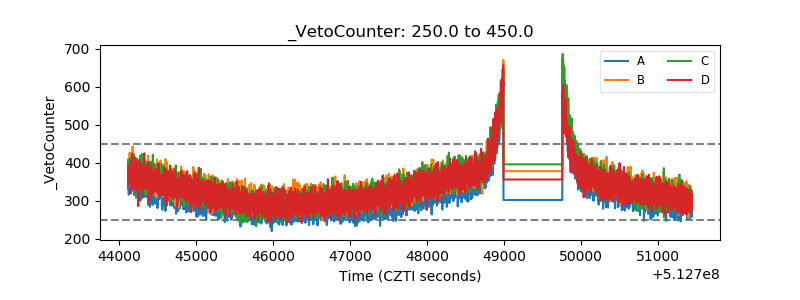 |