| Param | Original file | Final file |
|---|---|---|
| Filename | modeM0/AS1A14_083T03_9000006562_56859cztM0_level2.fits | modeM0/AS1A14_083T03_9000006562_56859cztM0_level2_quad_clean.evt |
| Size (bytes) | 579,850,560 | 93,988,800 |
| Size | 553.0 MB | 89.6 MB |
| Events in quadrant A | 7,776,083 | 525,976 |
| Events in quadrant B | 3,662,091 | 685,727 |
| Events in quadrant C | 3,623,847 | 620,571 |
| Events in quadrant D | 5,865,313 | 531,957 |
| Mode M9 | |||
|---|---|---|---|
| Quadrant | BADHDUFLAG | Total packets | Discarded packets |
| A | 0 | 2 | 0 |
| B | 0 | 2 | 0 |
| C | 0 | 2 | 0 |
| D | 0 | 2 | 0 |
| Mode SS | |||
|---|---|---|---|
| Quadrant | BADHDUFLAG | Total packets | Discarded packets |
| A | 0 | 140 | 0 |
| B | 0 | 140 | 0 |
| C | 0 | 140 | 0 |
| D | 0 | 140 | 0 |
| Mode M0 | |||
|---|---|---|---|
| Quadrant | BADHDUFLAG | Total packets | Discarded packets |
| A | 0 | 28069 | 1 |
| B | 0 | 15987 | 1 |
| C | 0 | 15921 | 1 |
| D | 0 | 22337 | 5 |
| Quadrant | Total seconds | Saturated seconds | Saturation percentage |
|---|---|---|---|
| A | 6912 | 1591 | 23.017940% |
| B | 6912 | 235 | 3.399884% |
| C | 6913 | 68 | 0.983654% |
| D | 6912 | 809 | 11.704282% |
Noise dominated data is calculated using 1-second bins in cleaned event files. If a bin has >2000 counts, and if more than 50% of those come from <1% of pixels, then it is considered to be noise-dominated and hence unusable.
| Quadrant | # 1 sec bins | Bins with >0 counts | Bins with >2000 counts | High rate bins dominated by noise | Noise dominated (total time) | Noise dominated (detector-on time) | Marked lightcurve |
|---|---|---|---|---|---|---|---|
| A | 7072 | 6914 | 1435 | 1435 | 20.29% | 20.75% | 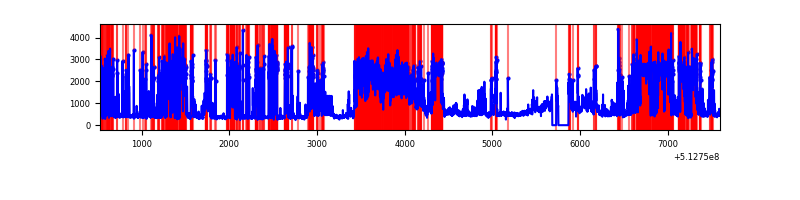 |
| B | 7072 | 6913 | 99 | 99 | 1.40% | 1.43% | 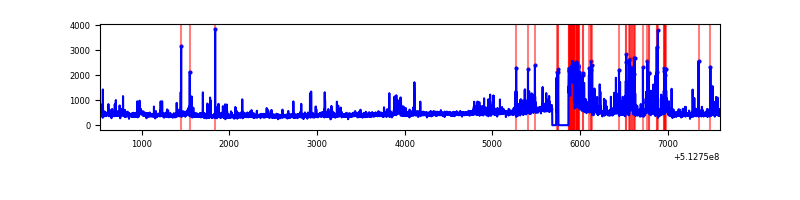 |
| C | 7073 | 6915 | 65 | 65 | 0.92% | 0.94% | 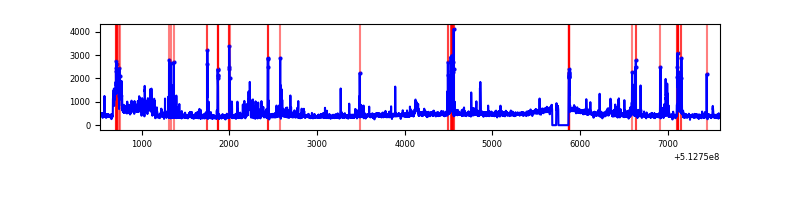 |
| D | 7072 | 6914 | 764 | 764 | 10.80% | 11.05% | 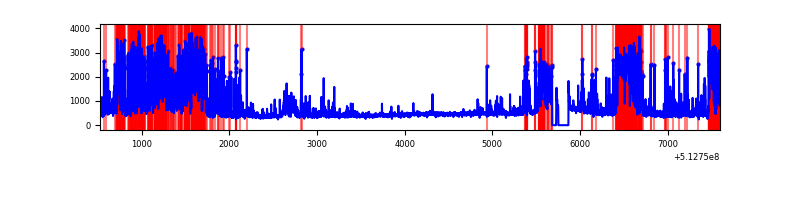 |
Top three noisy pixels from each quadrant. If the there are fewer than three noisy pixels in the level2.evt file, extra rows are filled as -1
| Pixel properties | Quadrant properties | ||||||
|---|---|---|---|---|---|---|---|
| Quadrant | DetID | PixID | Counts | Sigma | Mean | Median | Sigma |
| A | 3 | 62 | 2656792 | 15946.2 | 670 | 651 | 166.6 |
| A | 7 | 64 | 2442757 | 14661.24 | 670 | 651 | 166.6 |
| A | 3 | 14 | 26151 | 153.09 | 670 | 651 | 166.6 |
| B | 5 | 185 | 290895 | 1894.59 | 715 | 687 | 153.2 |
| B | 10 | 16 | 265409 | 1728.21 | 715 | 687 | 153.2 |
| B | 0 | 245 | 64575 | 417.09 | 715 | 687 | 153.2 |
| C | 9 | 38 | 403589 | 2076.85 | 711 | 705 | 194.0 |
| C | 13 | 3 | 219164 | 1126.15 | 711 | 705 | 194.0 |
| C | 1 | 16 | 64287 | 327.76 | 711 | 705 | 194.0 |
| D | 2 | 249 | 2196377 | 11452.9 | 678 | 647 | 191.7 |
| D | 8 | 240 | 662613 | 3452.81 | 678 | 647 | 191.7 |
| D | 3 | 12 | 93126 | 482.37 | 678 | 647 | 191.7 |
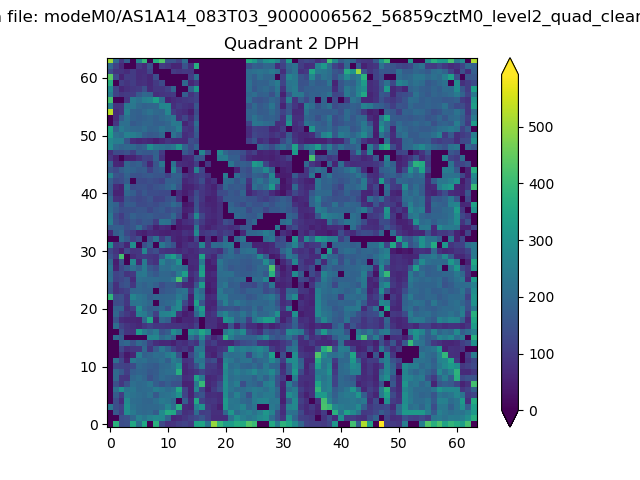
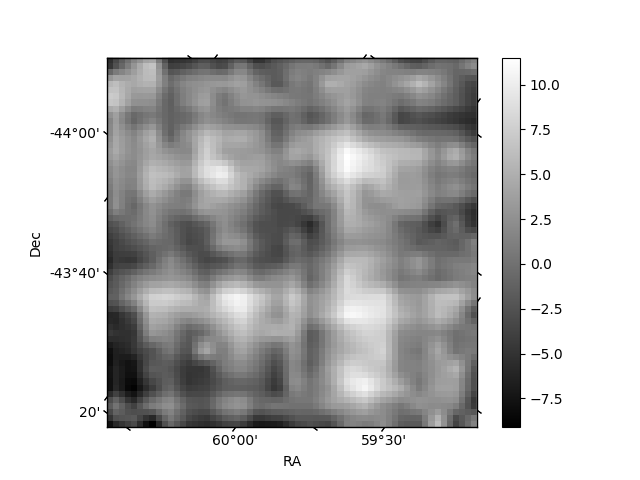
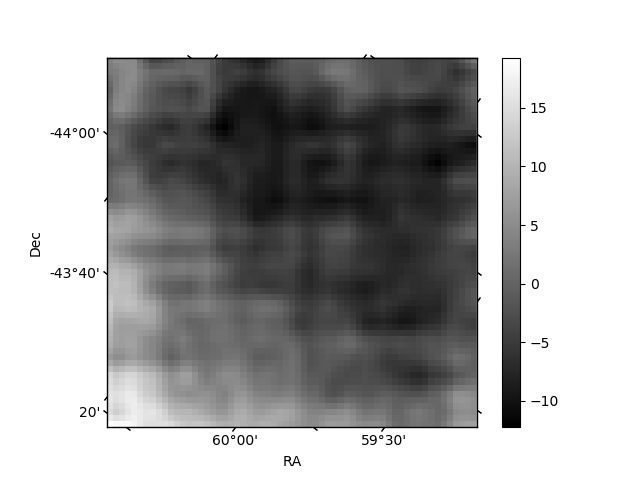
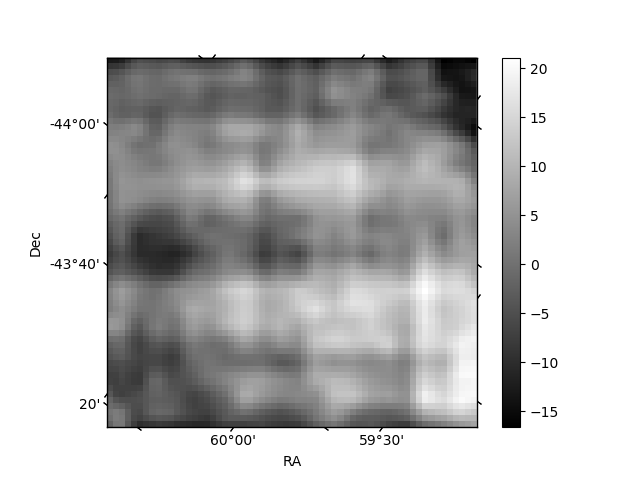
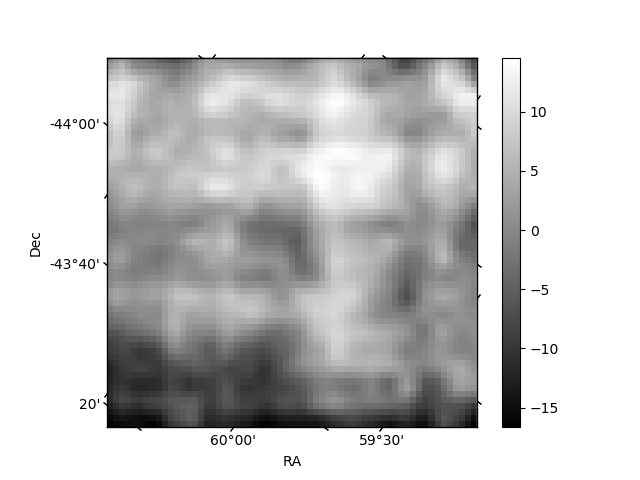
Histogram calculated using DETX and DETY for each event in the final _common_clean file
| Quadrant A | 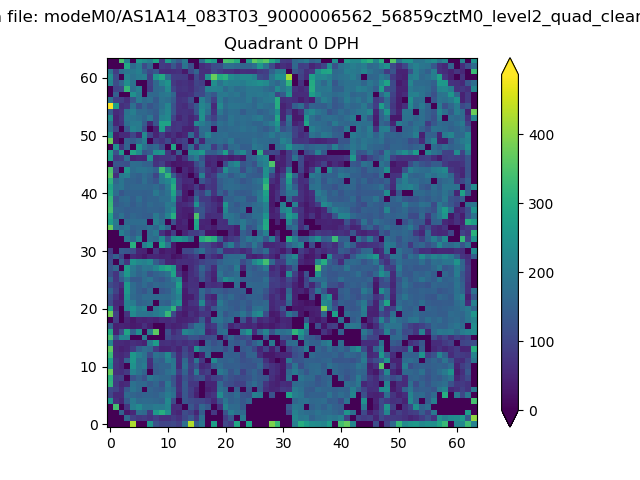 |
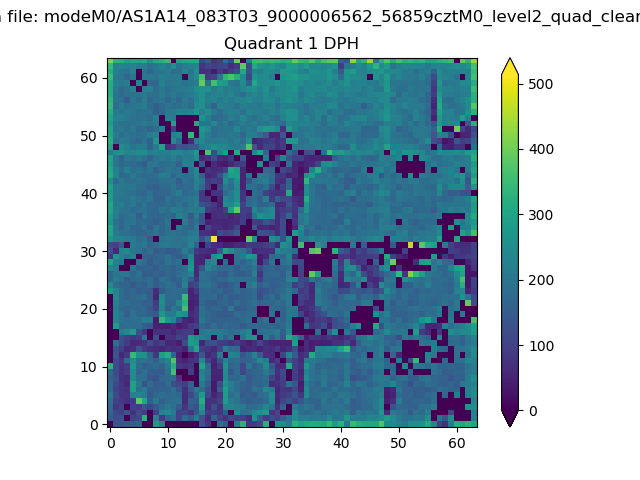 |
Quadrant B |
|---|---|---|---|
| Quadrant D | 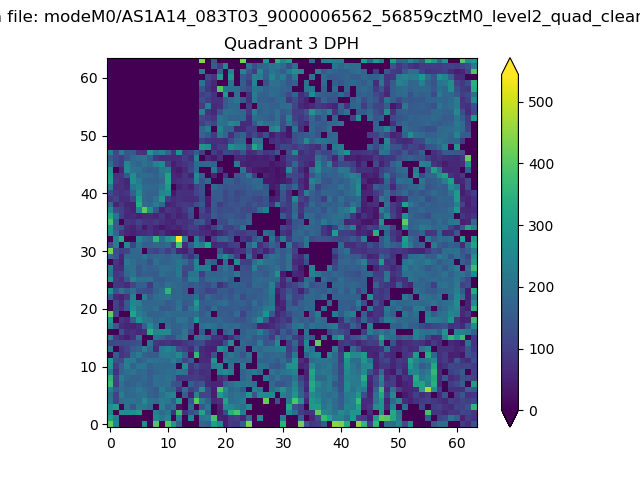 |
 |
Quadrant C |
| Plot type | Count rate plots | Images |
|---|---|---|
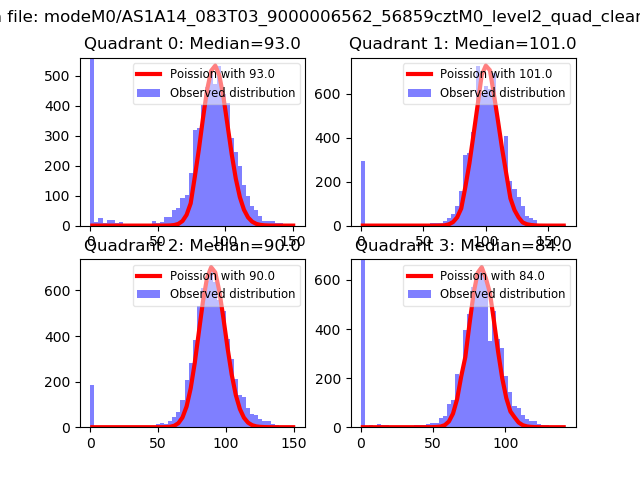
| Comparison with Poisson distribution Blue bars denote a histogram of data divided into 1 sec bins. Red curve is a Poisson curve with rate = median count rate of data. |
 |
 |
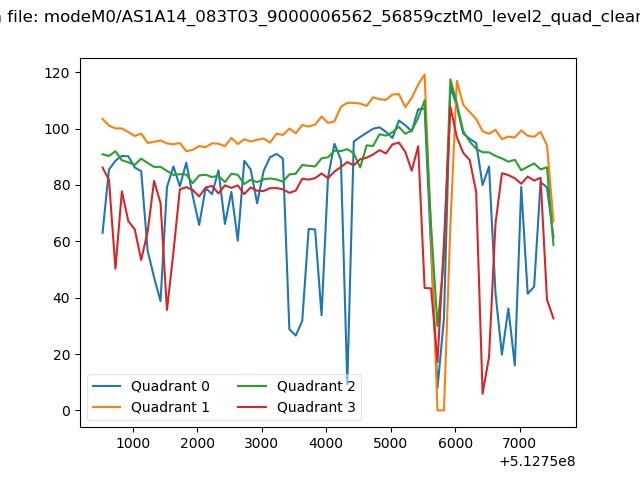
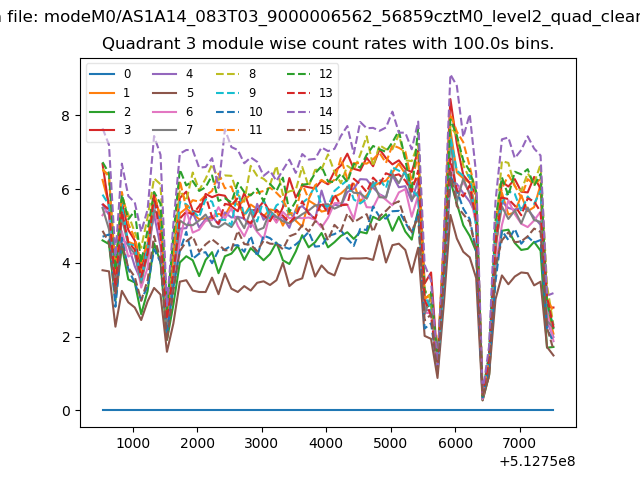
| Quadrant-wise count rates Data is divided into 100 sec bins |
 |
|
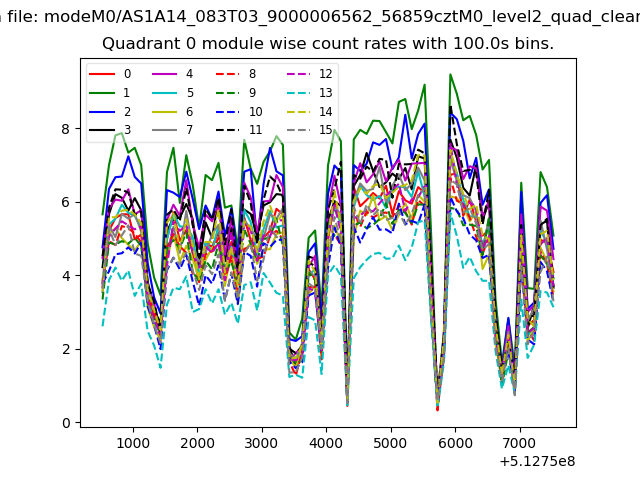
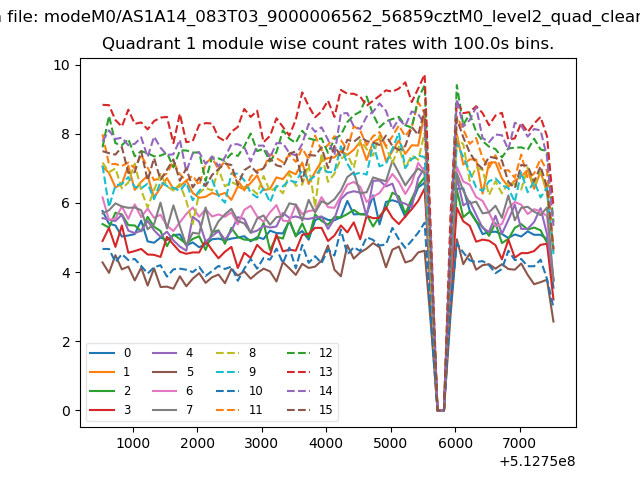
| Module-wise count rates for Quadrant A Data is divided into 100 sec bins |
 |
 |
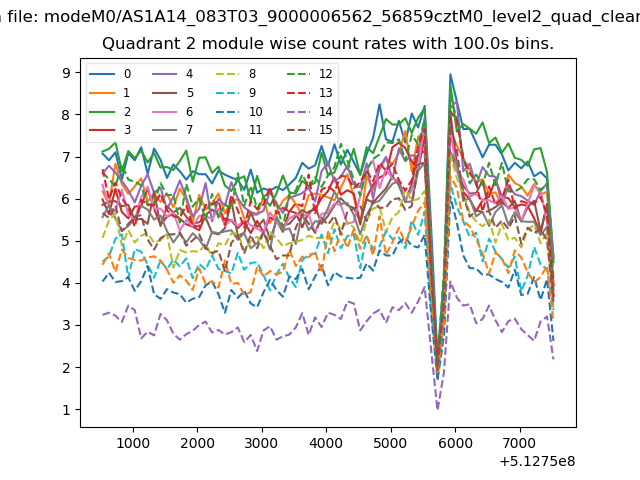
| Module-wise count rates for Quadrant B Data is divided into 100 sec bins |
 |
 |
| Module-wise count rates for Quadrant C Data is divided into 100 sec bins |
 |
 |
| Module-wise count rates for Quadrant D Data is divided into 100 sec bins |
 |
 |
| Parameter | Plot |
|---|---|
| CZT HV Monitor | 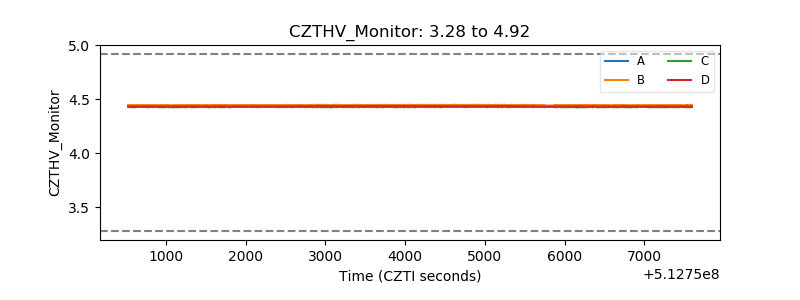 |
| D_VDD | 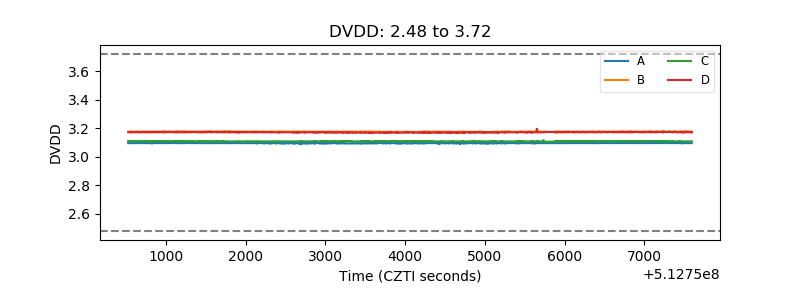 |
| Temperature 1 | 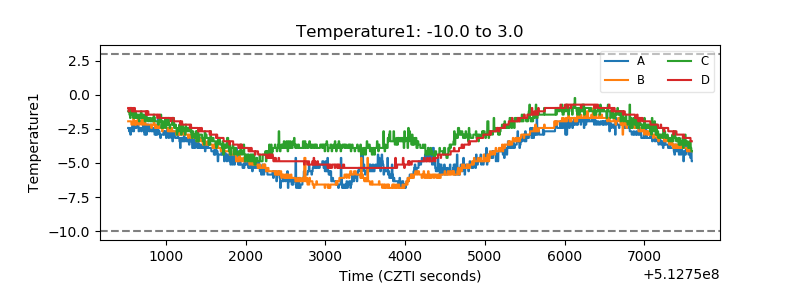 |
| Veto HV Monitor | 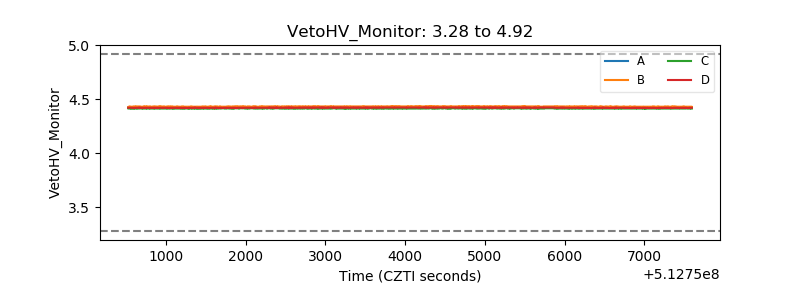 |
| Veto LLD | 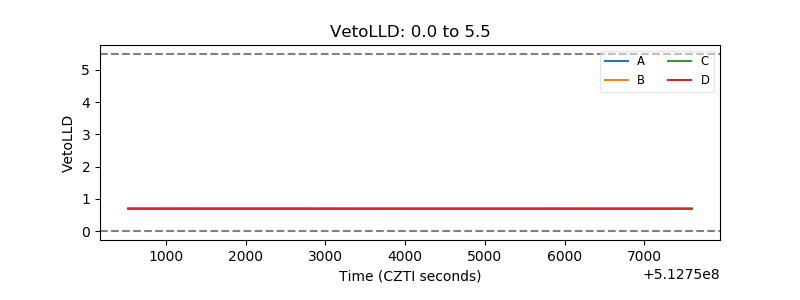 |
| Alpha Counter | 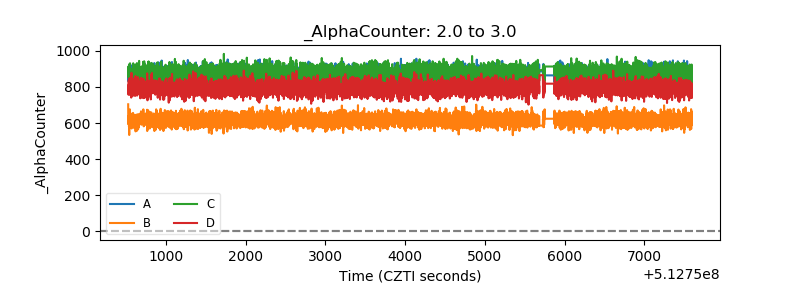 |
| _CPM_Rate | 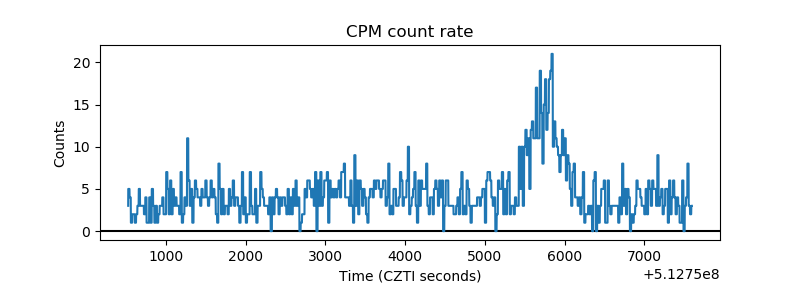 |
| CZT Counter | 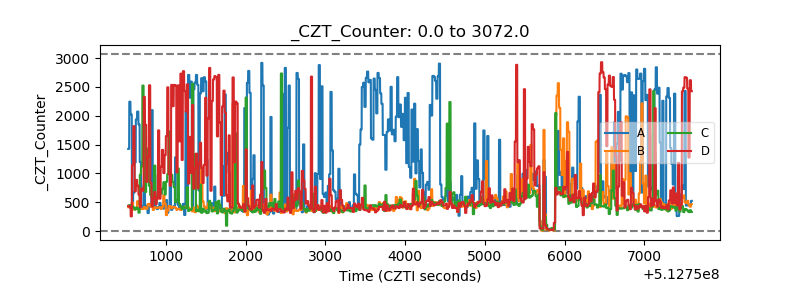 |
| +2.5 Volts monitor | 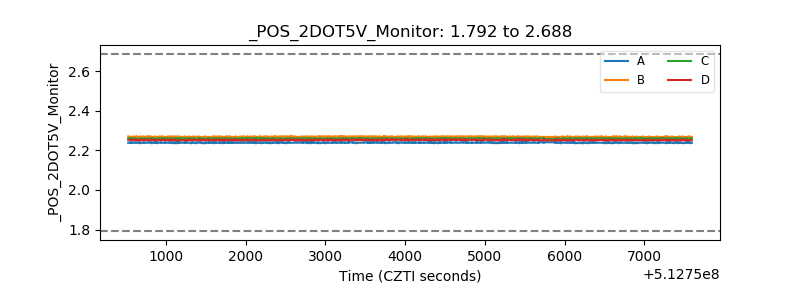 |
| +5 Volts monitor | 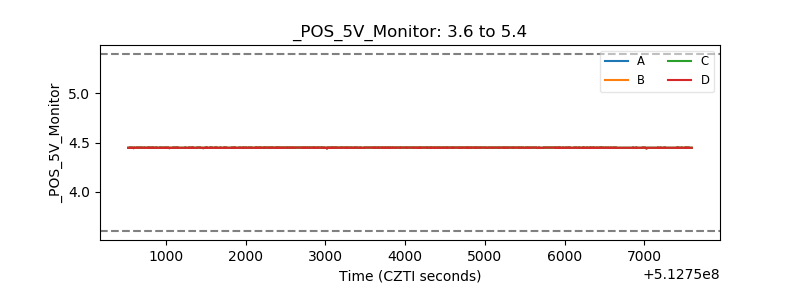 |
| _ROLL_ROT | 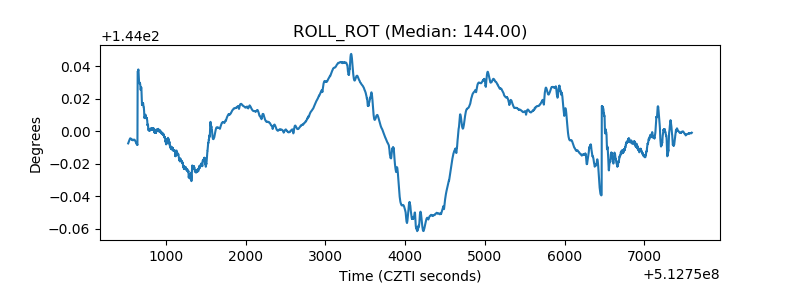 |
| _Roll_DEC | 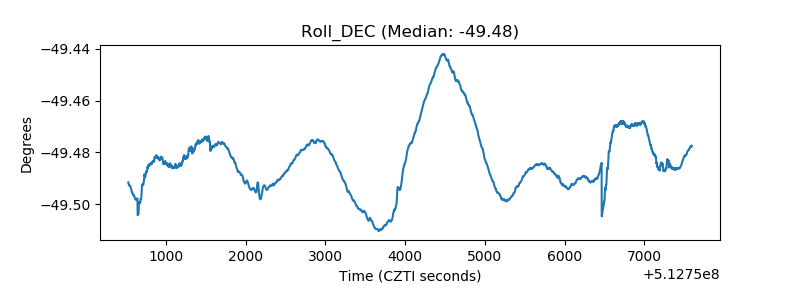 |
| _Roll_RA | 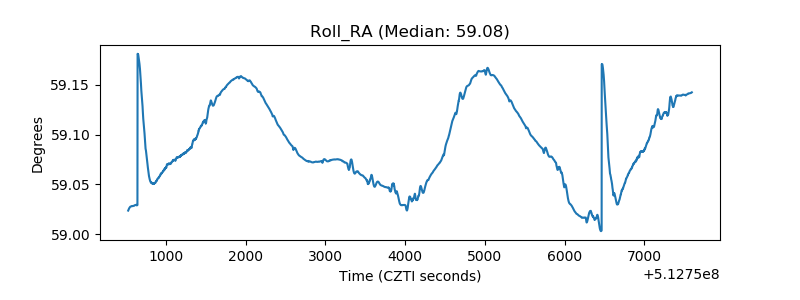 |
| Veto Counter | 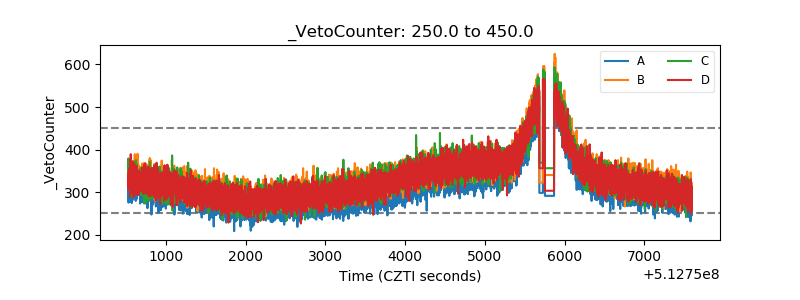 |