| Param | Original file | Final file |
|---|---|---|
| Filename | modeM0/AS1A14_083T03_9000006562_56864cztM0_level2.fits | modeM0/AS1A14_083T03_9000006562_56864cztM0_level2_quad_clean.evt |
| Size (bytes) | 1,424,453,760 | 257,097,600 |
| Size | 1.3 GB | 245.2 MB |
| Events in quadrant A | 12,504,214 | 1,659,156 |
| Events in quadrant B | 11,297,500 | 1,815,497 |
| Events in quadrant C | 11,971,980 | 1,570,434 |
| Events in quadrant D | 15,479,144 | 1,424,740 |
| Mode M9 | |||
|---|---|---|---|
| Quadrant | BADHDUFLAG | Total packets | Discarded packets |
| A | 0 | 14 | 0 |
| B | 0 | 14 | 0 |
| C | 0 | 14 | 0 |
| D | 0 | 14 | 0 |
| Mode SS | |||
|---|---|---|---|
| Quadrant | BADHDUFLAG | Total packets | Discarded packets |
| A | 0 | 386 | 0 |
| B | 0 | 386 | 0 |
| C | 0 | 386 | 0 |
| D | 0 | 386 | 0 |
| Mode M0 | |||
|---|---|---|---|
| Quadrant | BADHDUFLAG | Total packets | Discarded packets |
| A | 0 | 50946 | 3 |
| B | 0 | 47314 | 3 |
| C | 0 | 49389 | 3 |
| D | 0 | 59925 | 3 |
| Quadrant | Total seconds | Saturated seconds | Saturation percentage |
|---|---|---|---|
| A | 19076 | 862 | 4.518767% |
| B | 19077 | 907 | 4.754416% |
| C | 19077 | 1169 | 6.127798% |
| D | 19077 | 1887 | 9.891492% |
Noise dominated data is calculated using 1-second bins in cleaned event files. If a bin has >2000 counts, and if more than 50% of those come from <1% of pixels, then it is considered to be noise-dominated and hence unusable.
| Quadrant | # 1 sec bins | Bins with >0 counts | Bins with >2000 counts | High rate bins dominated by noise | Noise dominated (total time) | Noise dominated (detector-on time) | Marked lightcurve |
|---|---|---|---|---|---|---|---|
| A | 20386 | 19079 | 604 | 604 | 2.96% | 3.17% | 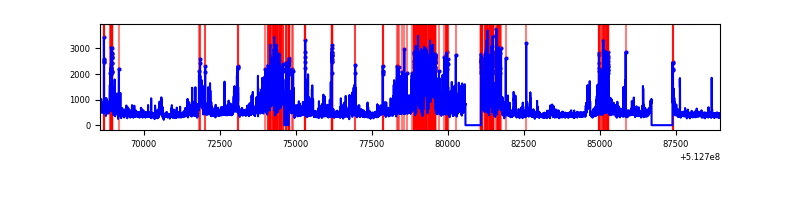 |
| B | 20387 | 19078 | 535 | 535 | 2.62% | 2.80% | 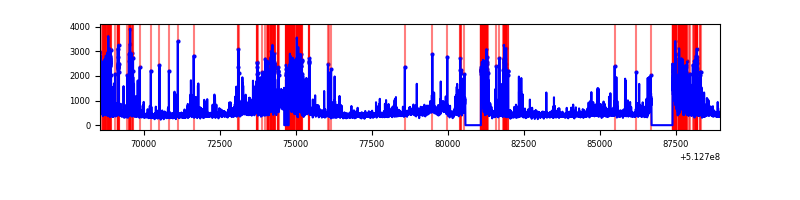 |
| C | 20387 | 19079 | 1025 | 1025 | 5.03% | 5.37% | 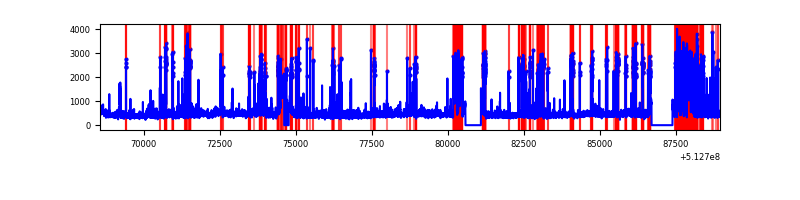 |
| D | 20387 | 19080 | 1787 | 1787 | 8.77% | 9.37% | 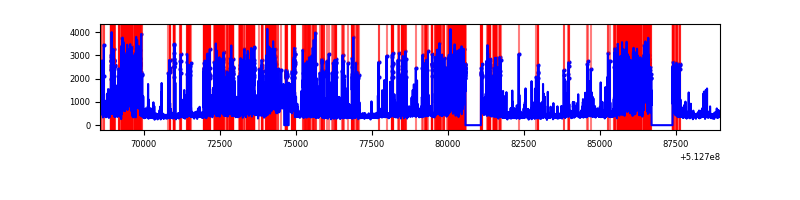 |
Top three noisy pixels from each quadrant. If the there are fewer than three noisy pixels in the level2.evt file, extra rows are filled as -1
| Pixel properties | Quadrant properties | ||||||
|---|---|---|---|---|---|---|---|
| Quadrant | DetID | PixID | Counts | Sigma | Mean | Median | Sigma |
| A | 7 | 64 | 4258315 | 8769.11 | 1984 | 1936 | 485.4 |
| A | 3 | 62 | 283714 | 580.53 | 1984 | 1936 | 485.4 |
| A | 3 | 14 | 109718 | 222.06 | 1984 | 1936 | 485.4 |
| B | 5 | 185 | 1606168 | 3855.96 | 1947 | 1876 | 416.1 |
| B | 10 | 16 | 1155503 | 2772.77 | 1947 | 1876 | 416.1 |
| B | 7 | 0 | 357707 | 855.25 | 1947 | 1876 | 416.1 |
| C | 9 | 38 | 3006573 | 5781.23 | 1914 | 1893 | 519.7 |
| C | 1 | 16 | 417600 | 799.85 | 1914 | 1893 | 519.7 |
| C | 13 | 3 | 151650 | 288.14 | 1914 | 1893 | 519.7 |
| D | 2 | 249 | 4416739 | 8484.73 | 1866 | 1783 | 520.3 |
| D | 8 | 240 | 2985118 | 5733.42 | 1866 | 1783 | 520.3 |
| D | 5 | 173 | 159281 | 302.68 | 1866 | 1783 | 520.3 |
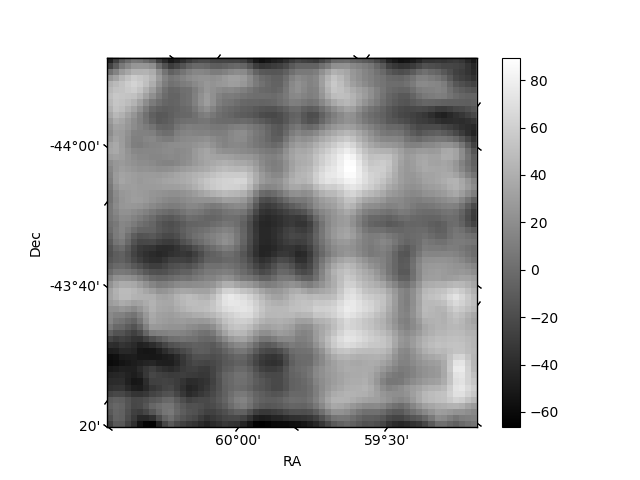
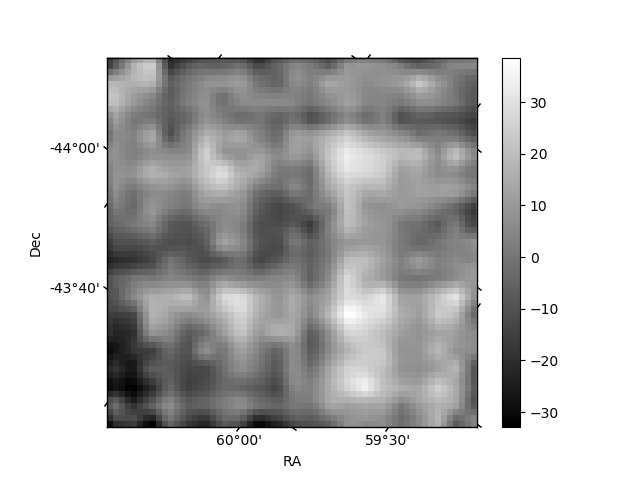
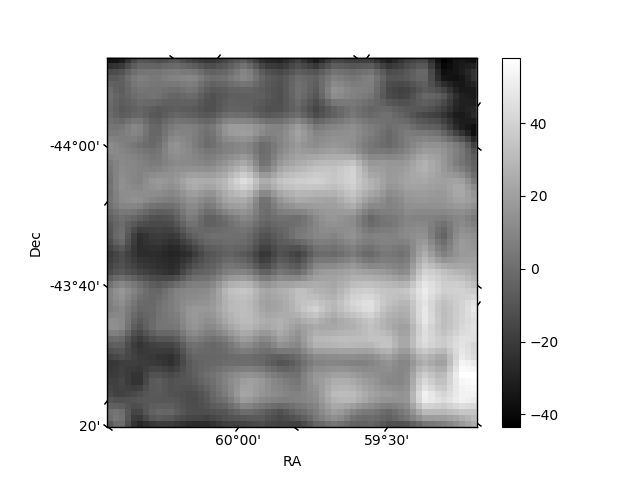
Histogram calculated using DETX and DETY for each event in the final _common_clean file
| Quadrant A | 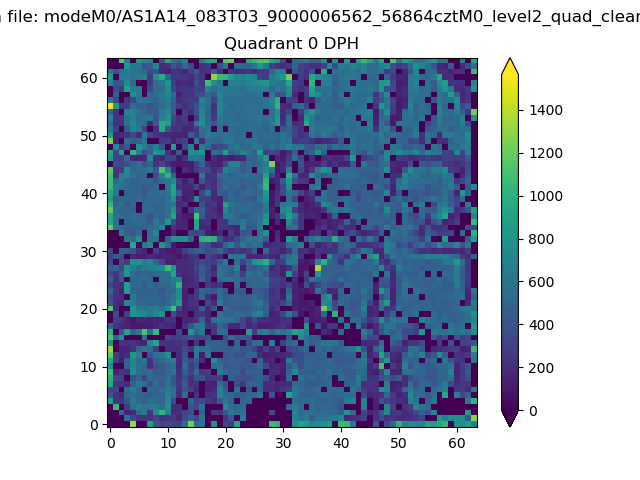 |
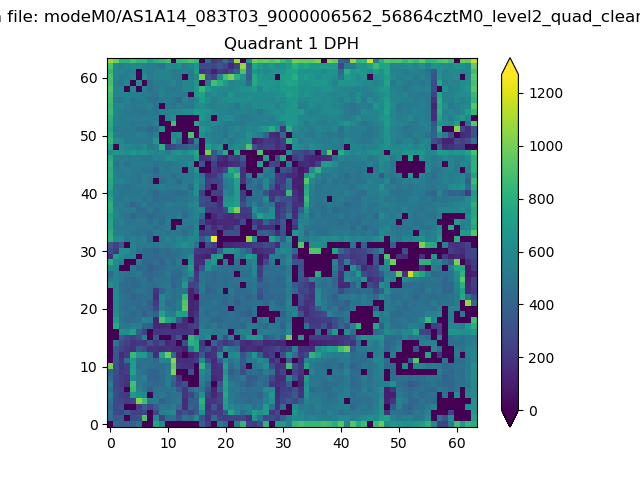 |
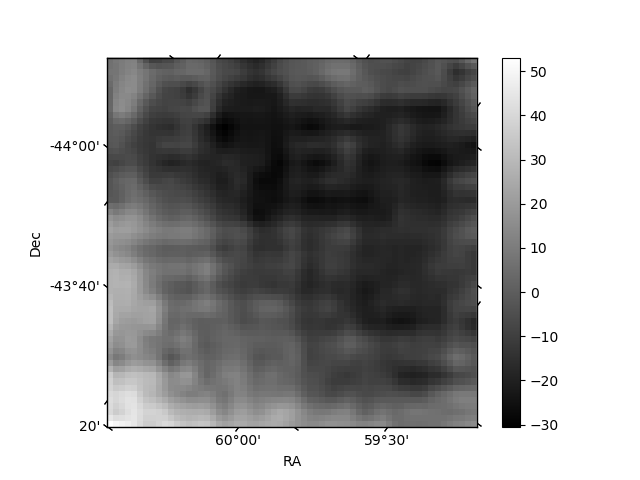
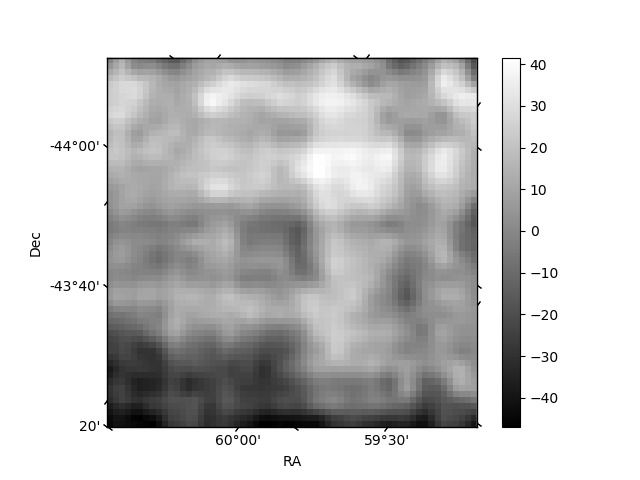
Quadrant B |
|---|---|---|---|
| Quadrant D | 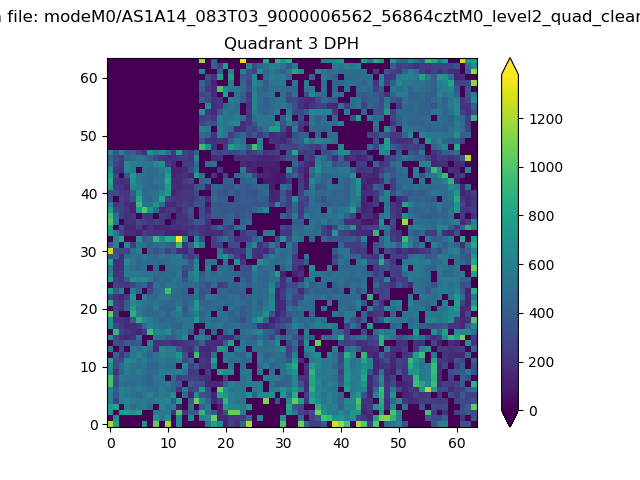 |
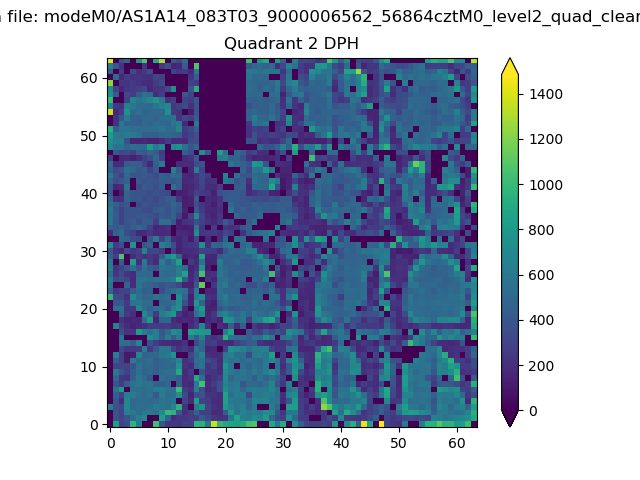 |
Quadrant C |
| Plot type | Count rate plots | Images |
|---|---|---|
| Comparison with Poisson distribution Blue bars denote a histogram of data divided into 1 sec bins. Red curve is a Poisson curve with rate = median count rate of data. |
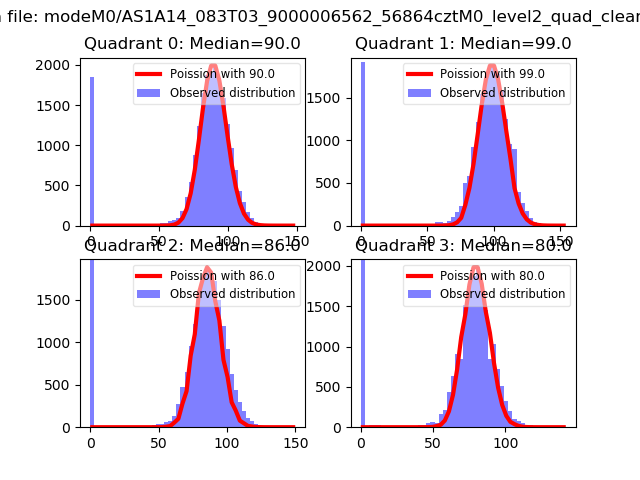 |
 |
| Quadrant-wise count rates Data is divided into 100 sec bins |
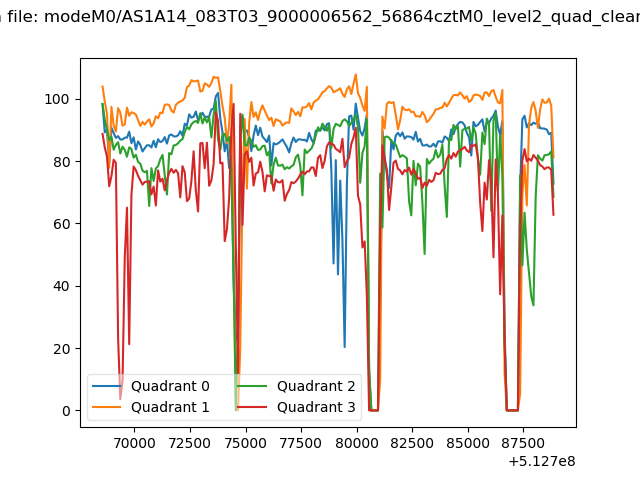 |
|
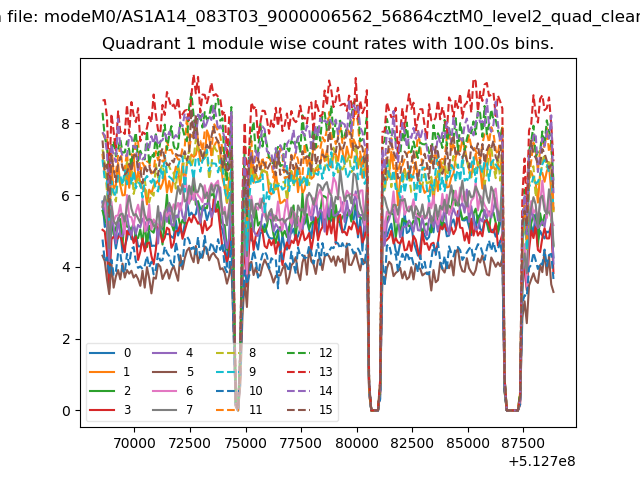
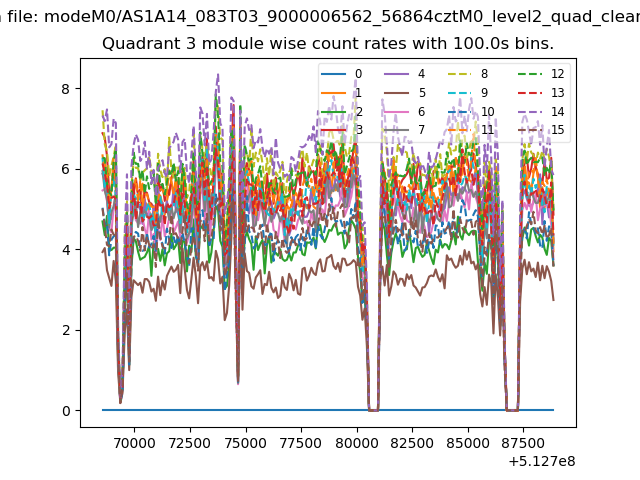
| Module-wise count rates for Quadrant A Data is divided into 100 sec bins |
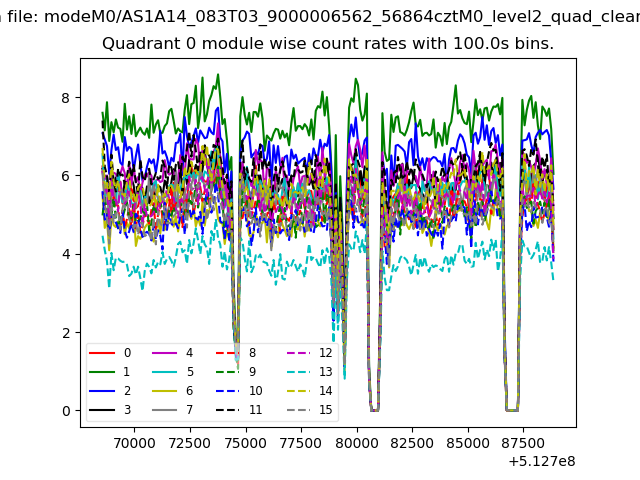 |
 |
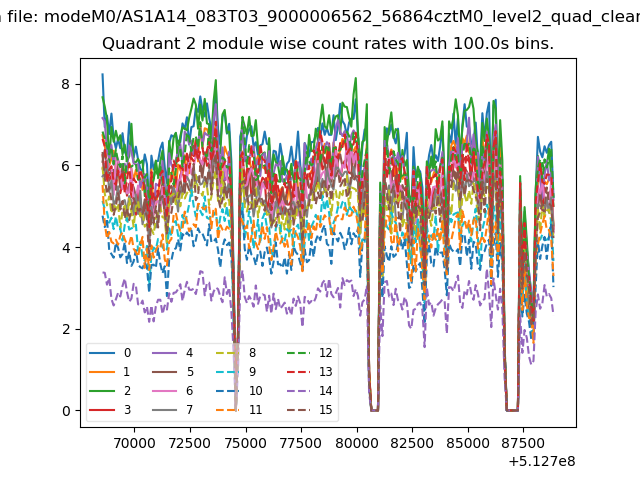
| Module-wise count rates for Quadrant B Data is divided into 100 sec bins |
 |
 |
| Module-wise count rates for Quadrant C Data is divided into 100 sec bins |
 |
 |
| Module-wise count rates for Quadrant D Data is divided into 100 sec bins |
 |
 |
| Parameter | Plot |
|---|---|
| CZT HV Monitor | 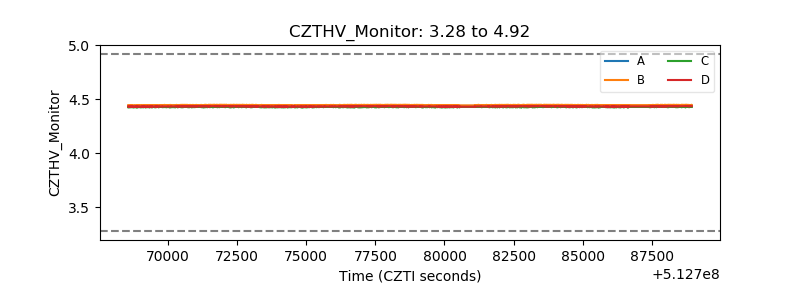 |
| D_VDD | 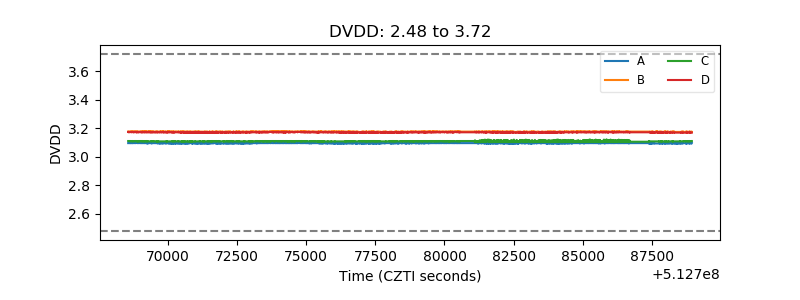 |
| Temperature 1 | 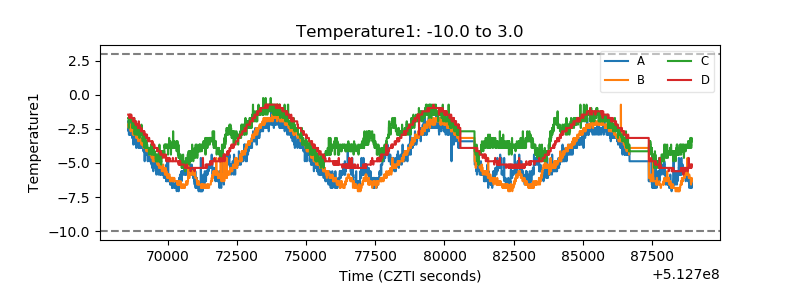 |
| Veto HV Monitor |  |
| Veto LLD | 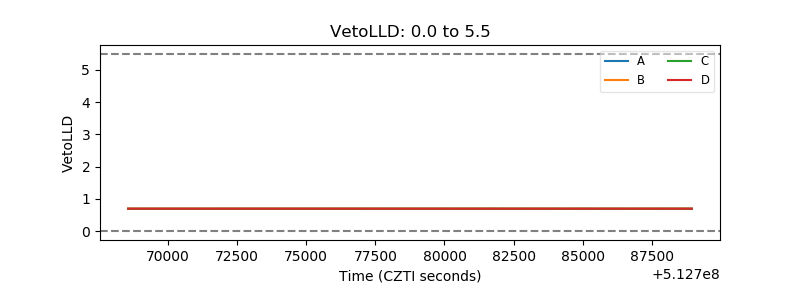 |
| Alpha Counter | 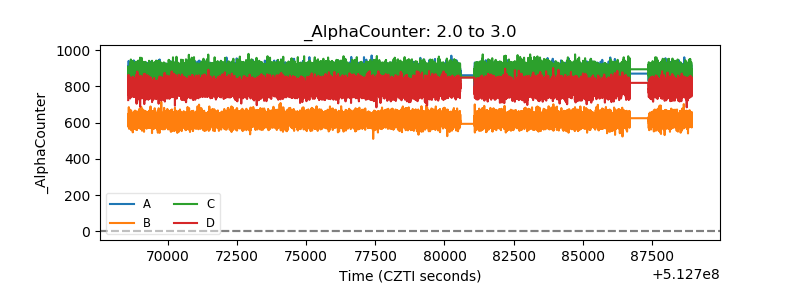 |
| _CPM_Rate | 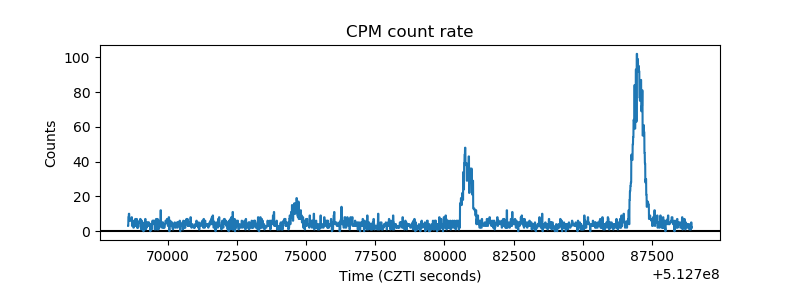 |
| CZT Counter | 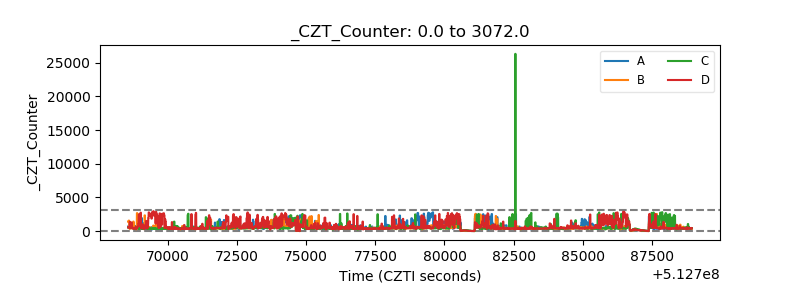 |
| +2.5 Volts monitor | 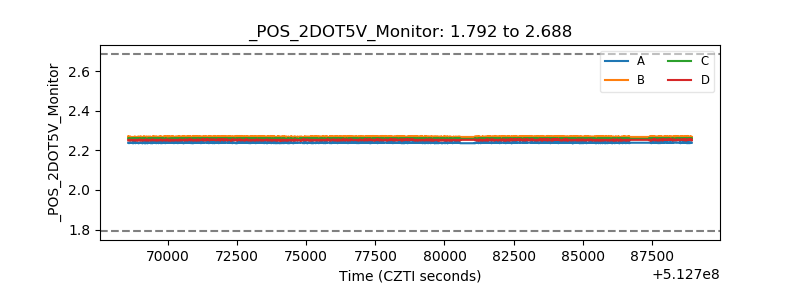 |
| +5 Volts monitor | 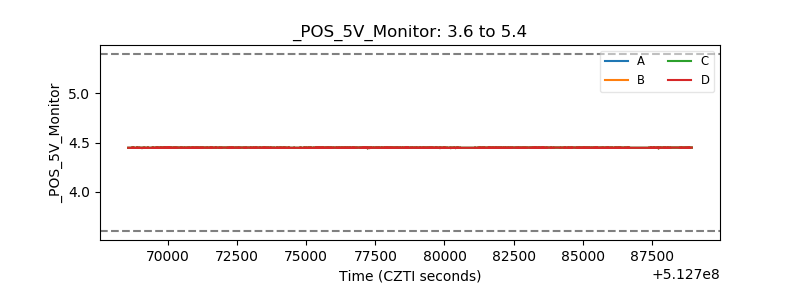 |
| _ROLL_ROT | 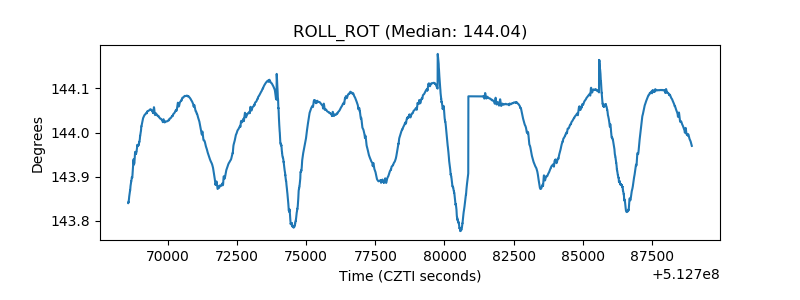 |
| _Roll_DEC | 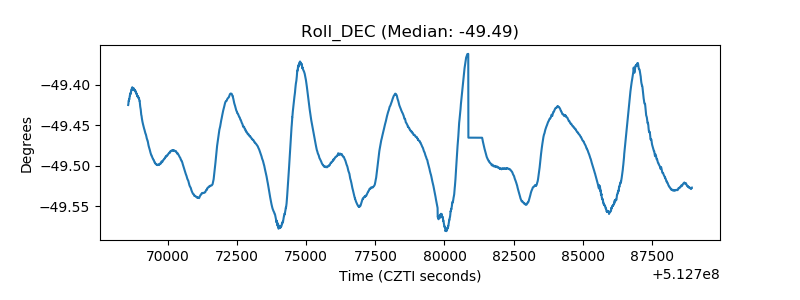 |
| _Roll_RA | 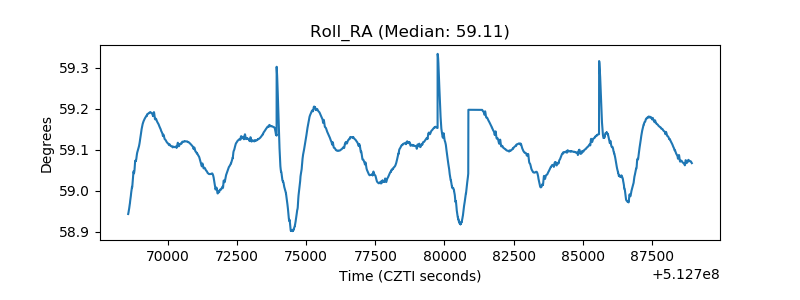 |
| Veto Counter | 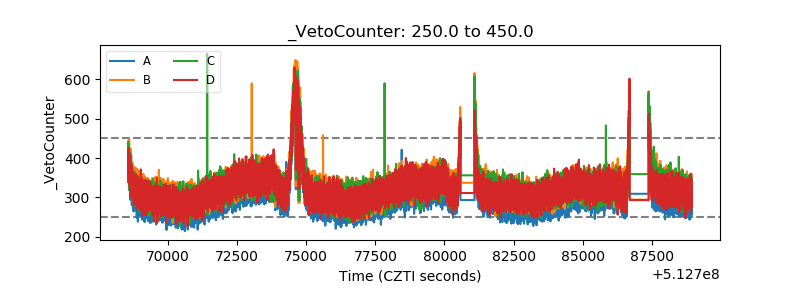 |