| Param | Original file | Final file |
|---|---|---|
| Filename | modeM0/AS1A14_083T03_9000006562_56865cztM0_level2.fits | modeM0/AS1A14_083T03_9000006562_56865cztM0_level2_quad_clean.evt |
| Size (bytes) | 2,049,462,720 | 394,439,040 |
| Size | 1.9 GB | 376.2 MB |
| Events in quadrant A | 19,566,118 | 2,540,511 |
| Events in quadrant B | 15,944,399 | 2,785,423 |
| Events in quadrant C | 15,422,672 | 2,470,318 |
| Events in quadrant D | 22,723,777 | 2,183,274 |
| Mode M9 | |||
|---|---|---|---|
| Quadrant | BADHDUFLAG | Total packets | Discarded packets |
| A | 0 | 10 | 0 |
| B | 0 | 10 | 0 |
| C | 0 | 10 | 0 |
| D | 0 | 10 | 0 |
| Mode SS | |||
|---|---|---|---|
| Quadrant | BADHDUFLAG | Total packets | Discarded packets |
| A | 0 | 576 | 0 |
| B | 0 | 576 | 0 |
| C | 0 | 576 | 0 |
| D | 0 | 576 | 0 |
| Mode M0 | |||
|---|---|---|---|
| Quadrant | BADHDUFLAG | Total packets | Discarded packets |
| A | 0 | 78685 | 2 |
| B | 0 | 68076 | 2 |
| C | 0 | 66794 | 2 |
| D | 0 | 88236 | 3 |
| Quadrant | Total seconds | Saturated seconds | Saturation percentage |
|---|---|---|---|
| A | 28547 | 1679 | 5.881529% |
| B | 28547 | 1099 | 3.849792% |
| C | 28547 | 854 | 2.991558% |
| D | 28547 | 3040 | 10.649105% |
Noise dominated data is calculated using 1-second bins in cleaned event files. If a bin has >2000 counts, and if more than 50% of those come from <1% of pixels, then it is considered to be noise-dominated and hence unusable.
| Quadrant | # 1 sec bins | Bins with >0 counts | Bins with >2000 counts | High rate bins dominated by noise | Noise dominated (total time) | Noise dominated (detector-on time) | Marked lightcurve |
|---|---|---|---|---|---|---|---|
| A | 37678 | 28550 | 1313 | 1313 | 3.48% | 4.60% | 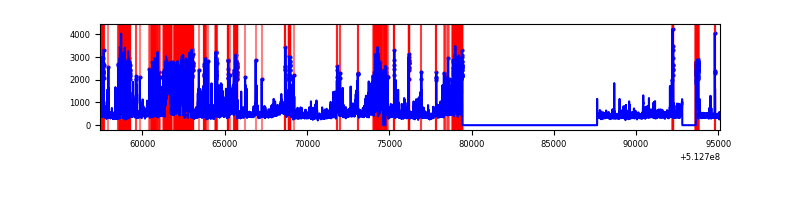 |
| B | 37678 | 28549 | 659 | 659 | 1.75% | 2.31% | 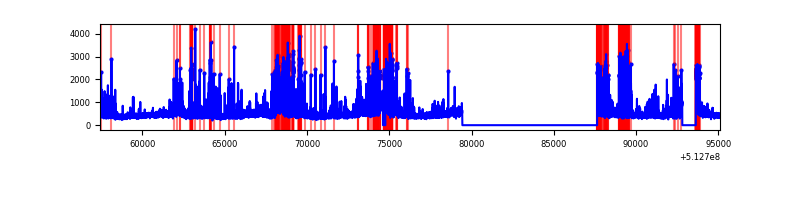 |
| C | 37678 | 28549 | 691 | 691 | 1.83% | 2.42% | 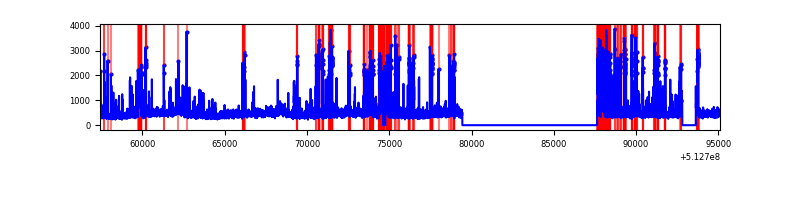 |
| D | 37678 | 28550 | 2840 | 2840 | 7.54% | 9.95% | 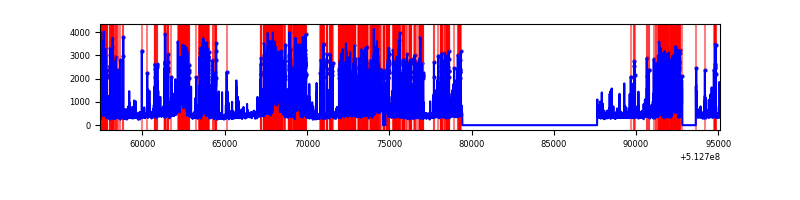 |
Top three noisy pixels from each quadrant. If the there are fewer than three noisy pixels in the level2.evt file, extra rows are filled as -1
| Pixel properties | Quadrant properties | ||||||
|---|---|---|---|---|---|---|---|
| Quadrant | DetID | PixID | Counts | Sigma | Mean | Median | Sigma |
| A | 7 | 64 | 6516806 | 9004.81 | 2946 | 2873 | 723.4 |
| A | 3 | 62 | 1306322 | 1801.88 | 2946 | 2873 | 723.4 |
| A | 3 | 14 | 108621 | 146.18 | 2946 | 2873 | 723.4 |
| B | 5 | 185 | 2215347 | 3547.93 | 2933 | 2820 | 623.6 |
| B | 10 | 16 | 1123794 | 1797.55 | 2933 | 2820 | 623.6 |
| B | 7 | 0 | 207292 | 327.88 | 2933 | 2820 | 623.6 |
| C | 9 | 38 | 1823313 | 2320.58 | 2898 | 2870 | 784.5 |
| C | 1 | 16 | 525246 | 665.89 | 2898 | 2870 | 784.5 |
| C | 8 | 208 | 292168 | 368.78 | 2898 | 2870 | 784.5 |
| D | 2 | 249 | 7294760 | 9286.55 | 2789 | 2660 | 785.2 |
| D | 8 | 240 | 3406618 | 4334.97 | 2789 | 2660 | 785.2 |
| D | 5 | 173 | 236426 | 297.7 | 2789 | 2660 | 785.2 |
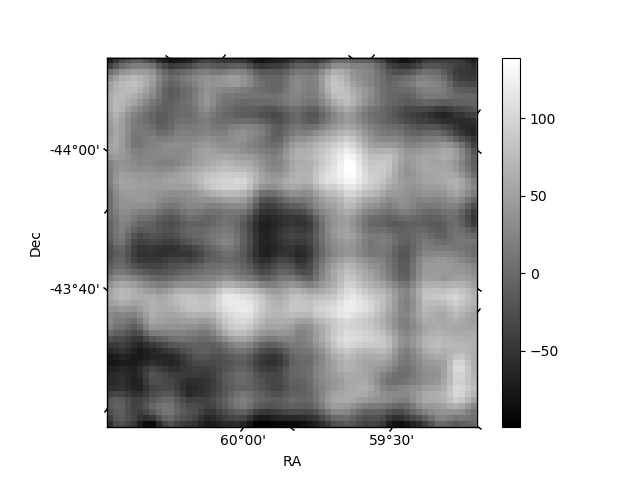
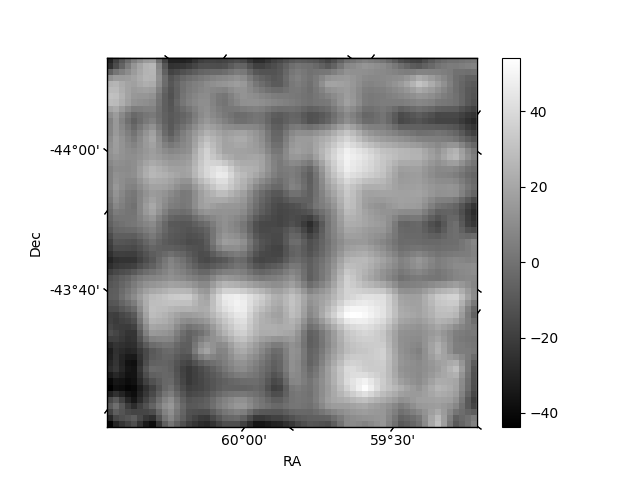
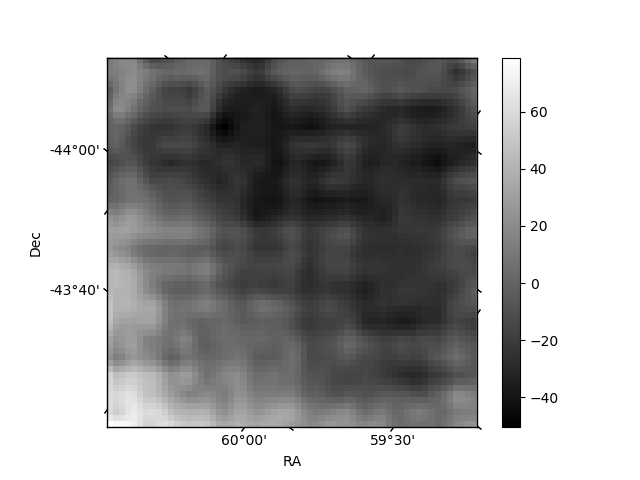
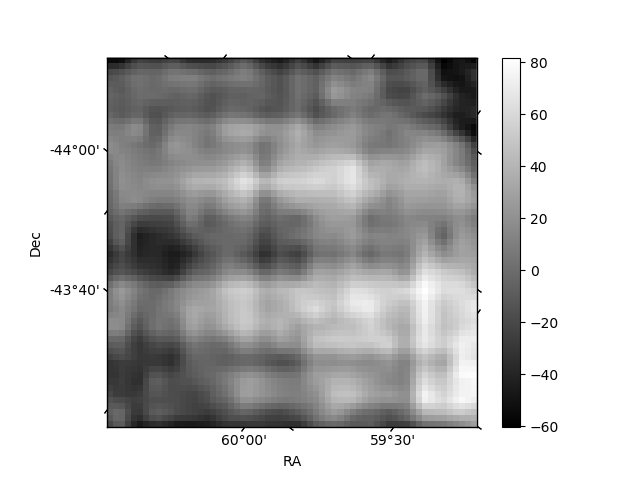
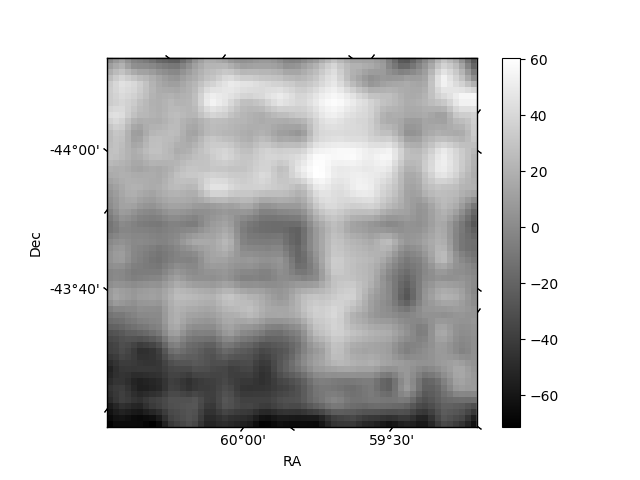
Histogram calculated using DETX and DETY for each event in the final _common_clean file
| Quadrant A | 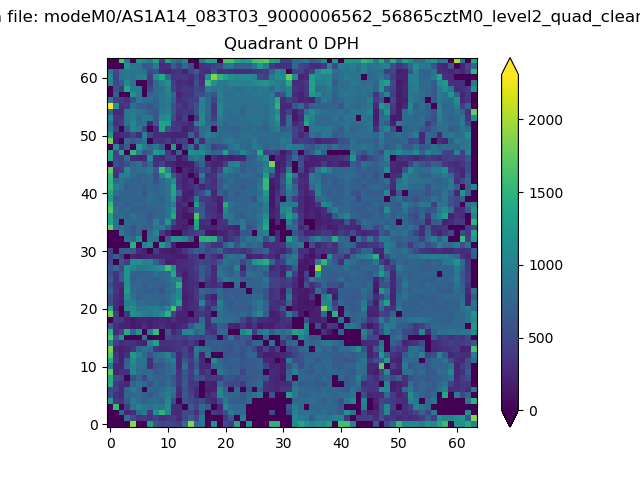 |
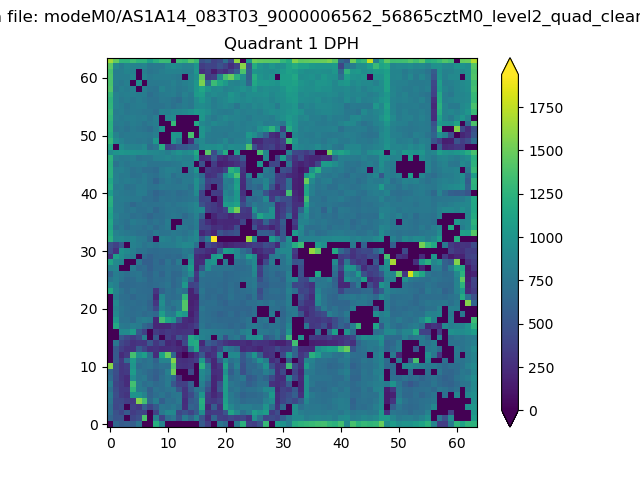 |
Quadrant B |
|---|---|---|---|
| Quadrant D | 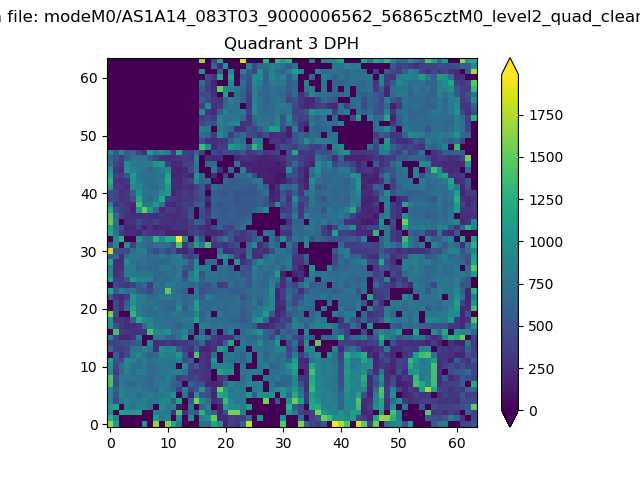 |
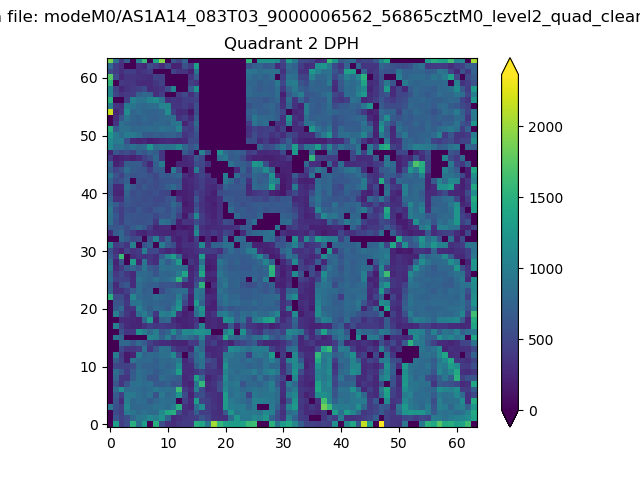 |
Quadrant C |
| Plot type | Count rate plots | Images |
|---|---|---|
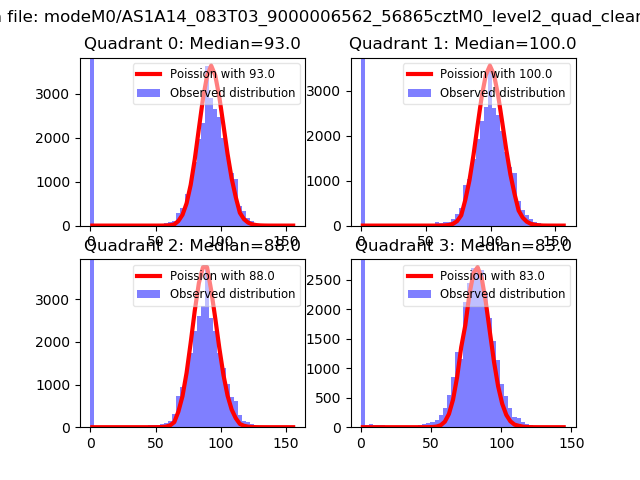
| Comparison with Poisson distribution Blue bars denote a histogram of data divided into 1 sec bins. Red curve is a Poisson curve with rate = median count rate of data. |
 |
 |
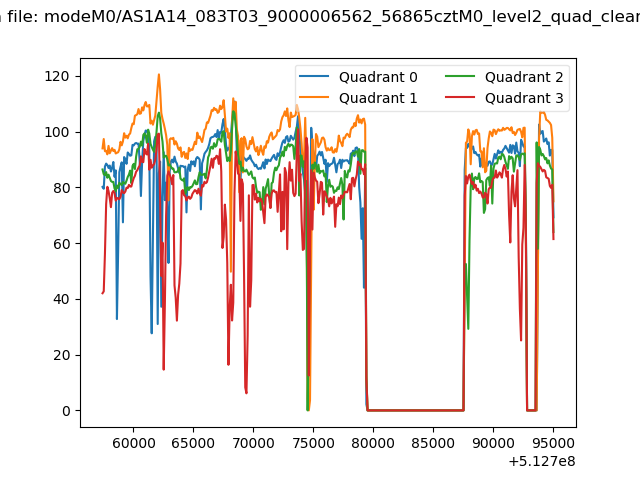
| Quadrant-wise count rates Data is divided into 100 sec bins |
 |
|
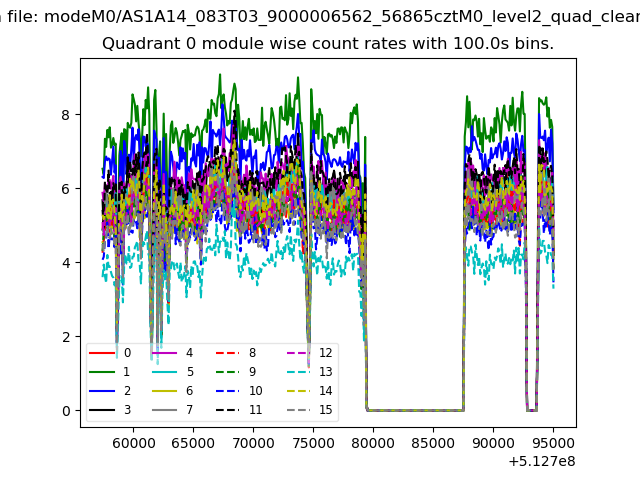
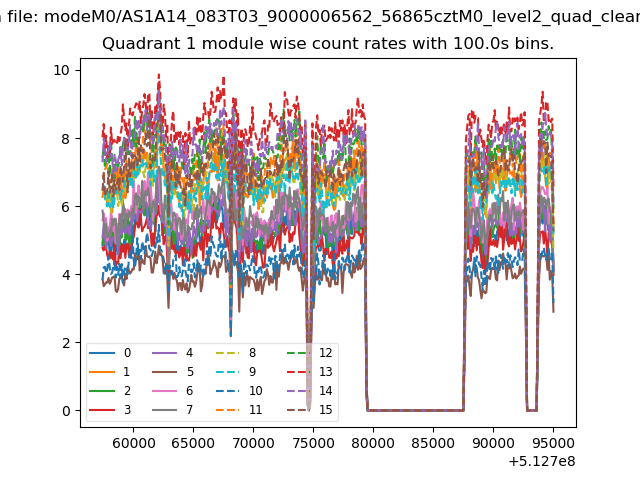
| Module-wise count rates for Quadrant A Data is divided into 100 sec bins |
 |
 |
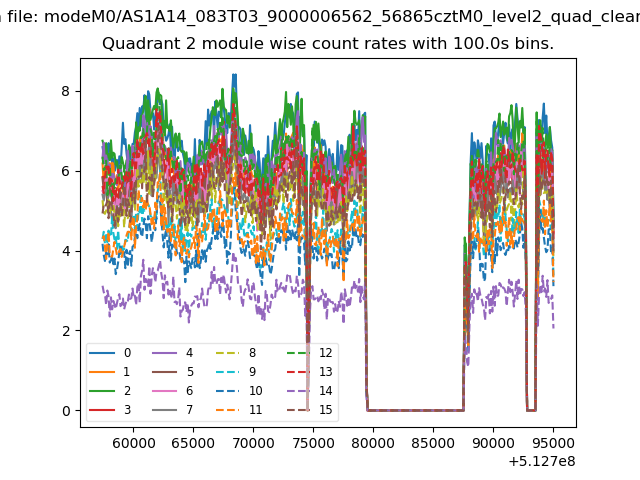
| Module-wise count rates for Quadrant B Data is divided into 100 sec bins |
 |
 |
| Module-wise count rates for Quadrant C Data is divided into 100 sec bins |
 |
 |
| Module-wise count rates for Quadrant D Data is divided into 100 sec bins |
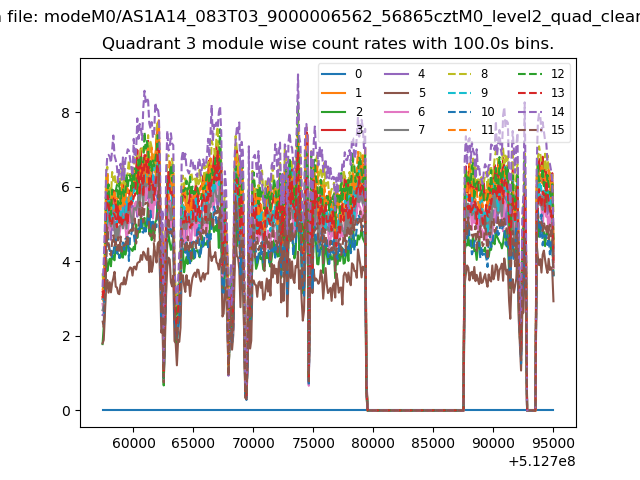 |
 |
| Parameter | Plot |
|---|---|
| CZT HV Monitor | 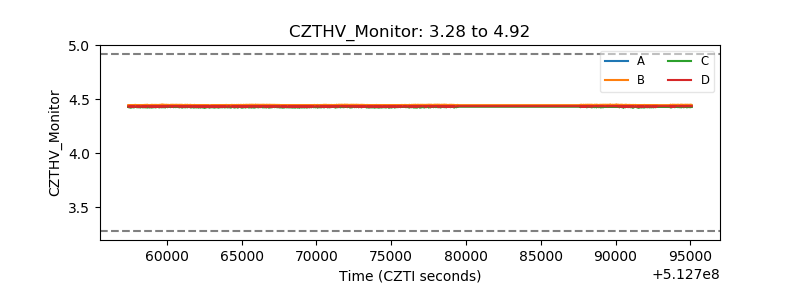 |
| D_VDD | 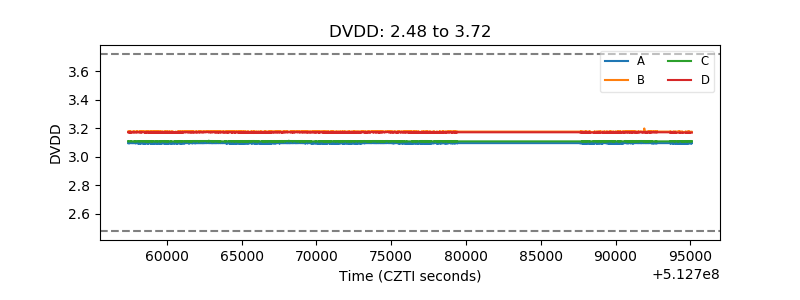 |
| Temperature 1 | 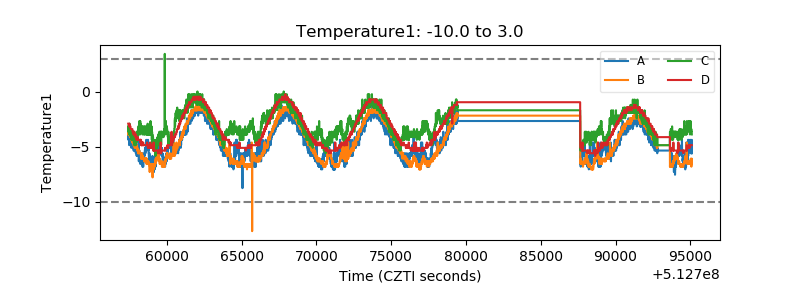 |
| Veto HV Monitor | 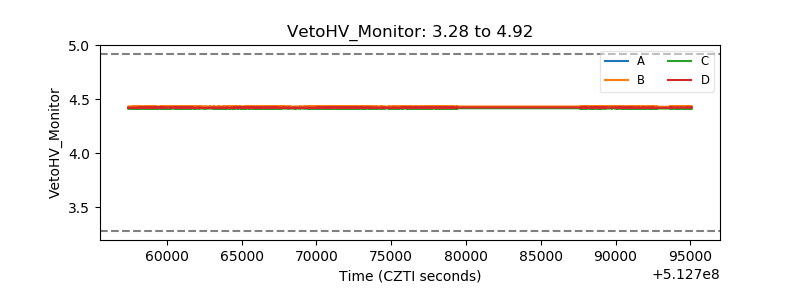 |
| Veto LLD | 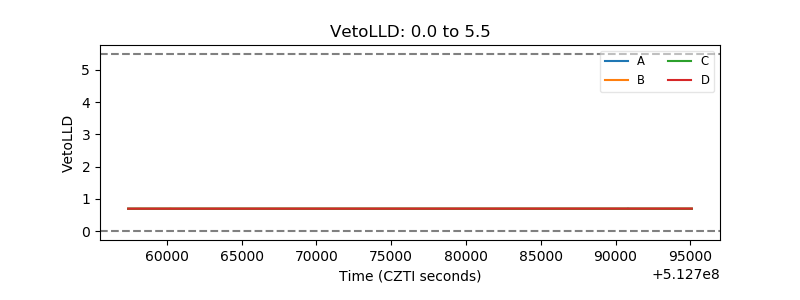 |
| Alpha Counter | 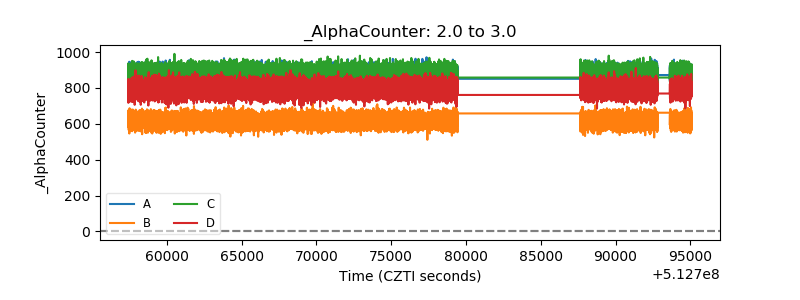 |
| _CPM_Rate | 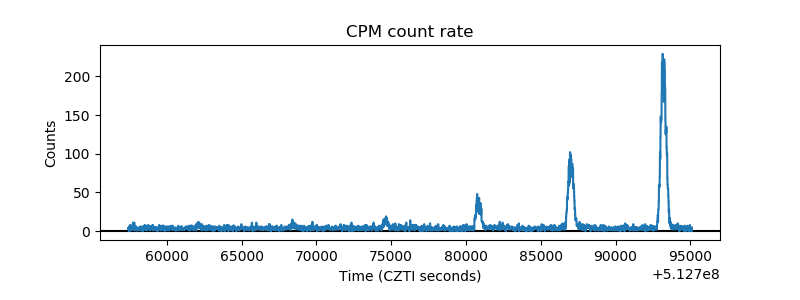 |
| CZT Counter | 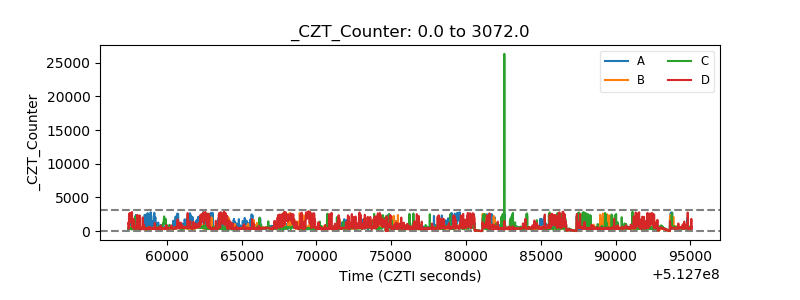 |
| +2.5 Volts monitor | 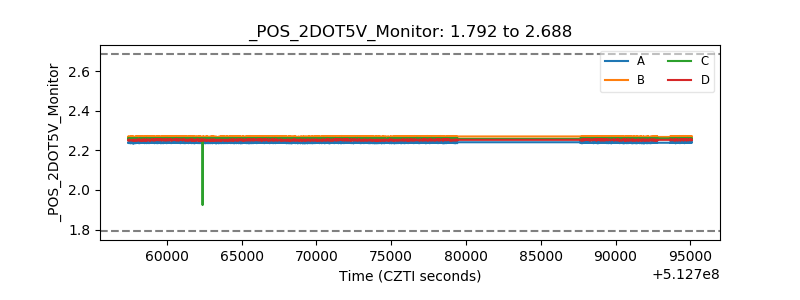 |
| +5 Volts monitor | 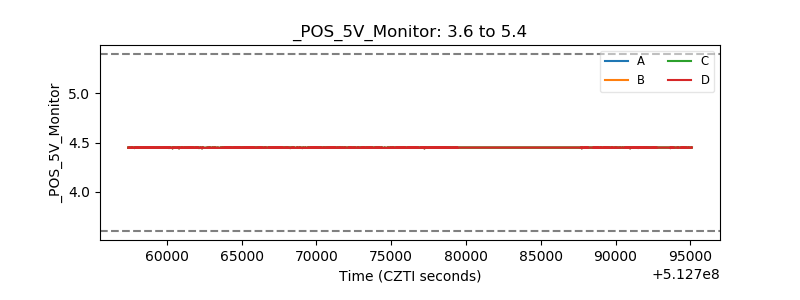 |
| _ROLL_ROT | 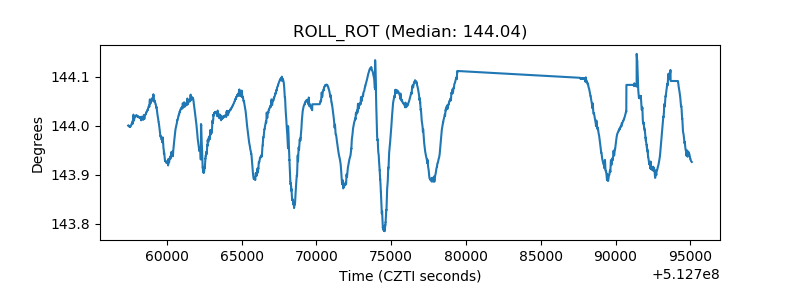 |
| _Roll_DEC | 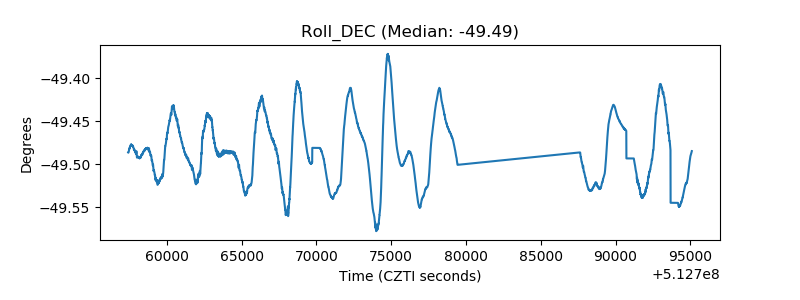 |
| _Roll_RA | 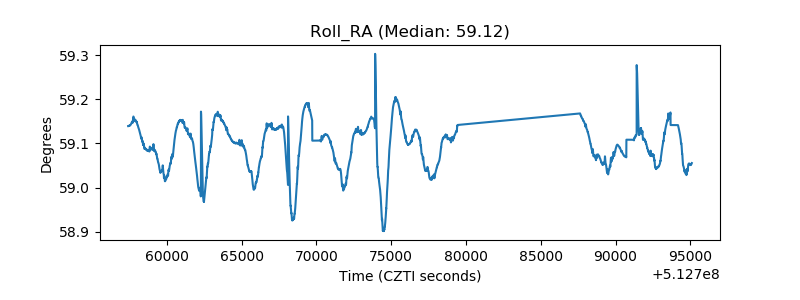 |
| Veto Counter | 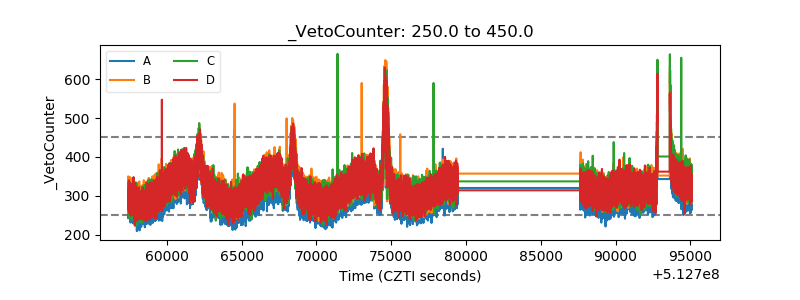 |