| Param | Original file | Final file |
|---|---|---|
| Filename | modeM0/AS1A14_083T03_9000006562_56867cztM0_level2.fits | modeM0/AS1A14_083T03_9000006562_56867cztM0_level2_quad_clean.evt |
| Size (bytes) | 414,930,240 | 91,278,720 |
| Size | 395.7 MB | 87.1 MB |
| Events in quadrant A | 3,159,980 | 602,648 |
| Events in quadrant B | 3,917,060 | 624,125 |
| Events in quadrant C | 3,222,375 | 576,726 |
| Events in quadrant D | 4,570,992 | 522,332 |
| Mode M9 | |||
|---|---|---|---|
| Quadrant | BADHDUFLAG | Total packets | Discarded packets |
| A | 0 | 10 | 0 |
| B | 0 | 10 | 0 |
| C | 0 | 10 | 0 |
| D | 0 | 10 | 0 |
| Mode SS | |||
|---|---|---|---|
| Quadrant | BADHDUFLAG | Total packets | Discarded packets |
| A | 0 | 126 | 0 |
| B | 0 | 126 | 0 |
| C | 0 | 126 | 0 |
| D | 0 | 126 | 0 |
| Mode M0 | |||
|---|---|---|---|
| Quadrant | BADHDUFLAG | Total packets | Discarded packets |
| A | 0 | 14028 | 1 |
| B | 0 | 16201 | 1 |
| C | 0 | 14157 | 1 |
| D | 0 | 18013 | 1 |
| Quadrant | Total seconds | Saturated seconds | Saturation percentage |
|---|---|---|---|
| A | 6282 | 138 | 2.196753% |
| B | 6282 | 307 | 4.886979% |
| C | 6283 | 135 | 2.148655% |
| D | 6282 | 426 | 6.781280% |
Noise dominated data is calculated using 1-second bins in cleaned event files. If a bin has >2000 counts, and if more than 50% of those come from <1% of pixels, then it is considered to be noise-dominated and hence unusable.
| Quadrant | # 1 sec bins | Bins with >0 counts | Bins with >2000 counts | High rate bins dominated by noise | Noise dominated (total time) | Noise dominated (detector-on time) | Marked lightcurve |
|---|---|---|---|---|---|---|---|
| A | 7262 | 6282 | 104 | 104 | 1.43% | 1.66% | 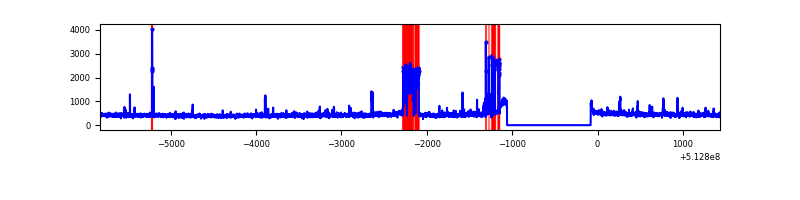 |
| B | 7262 | 6282 | 162 | 162 | 2.23% | 2.58% | 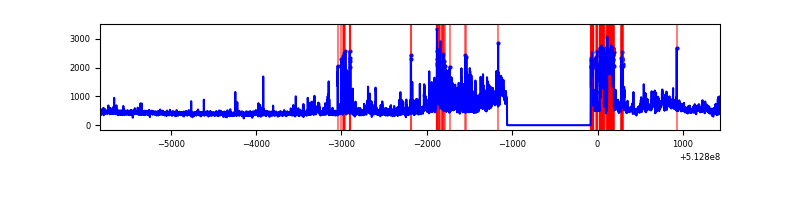 |
| C | 7263 | 6283 | 86 | 86 | 1.18% | 1.37% | 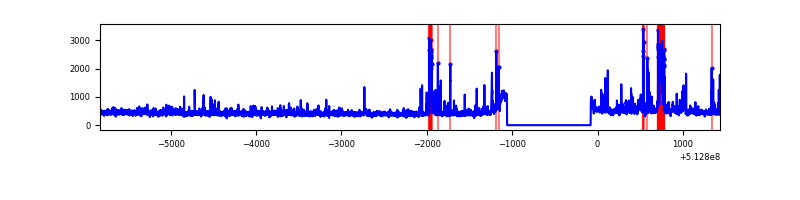 |
| D | 7262 | 6282 | 381 | 381 | 5.25% | 6.06% | 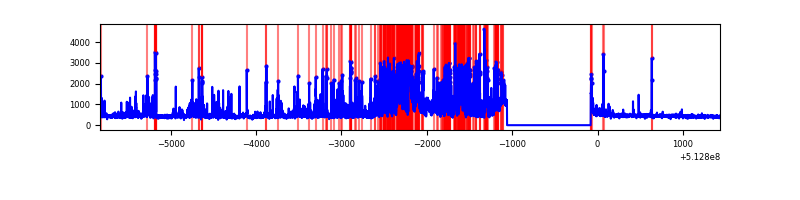 |
Top three noisy pixels from each quadrant. If the there are fewer than three noisy pixels in the level2.evt file, extra rows are filled as -1
| Pixel properties | Quadrant properties | ||||||
|---|---|---|---|---|---|---|---|
| Quadrant | DetID | PixID | Counts | Sigma | Mean | Median | Sigma |
| A | 13 | 153 | 307966 | 1844.7 | 675 | 659 | 166.6 |
| A | 3 | 62 | 90689 | 540.43 | 675 | 659 | 166.6 |
| A | 7 | 64 | 48131 | 284.96 | 675 | 659 | 166.6 |
| B | 5 | 185 | 737533 | 5204.2 | 655 | 630 | 141.6 |
| B | 10 | 16 | 396724 | 2797.32 | 655 | 630 | 141.6 |
| B | 0 | 173 | 78727 | 551.54 | 655 | 630 | 141.6 |
| C | 13 | 3 | 350289 | 1913.71 | 661 | 654 | 182.7 |
| C | 1 | 16 | 186502 | 1017.23 | 661 | 654 | 182.7 |
| C | 14 | 96 | 24515 | 130.6 | 661 | 654 | 182.7 |
| D | 2 | 249 | 1299927 | 7161.97 | 642 | 613 | 181.4 |
| D | 8 | 240 | 308055 | 1694.66 | 642 | 613 | 181.4 |
| D | 7 | 96 | 290443 | 1597.58 | 642 | 613 | 181.4 |
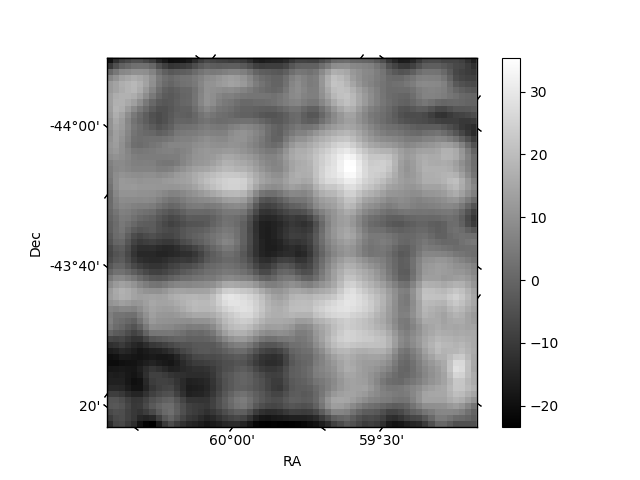
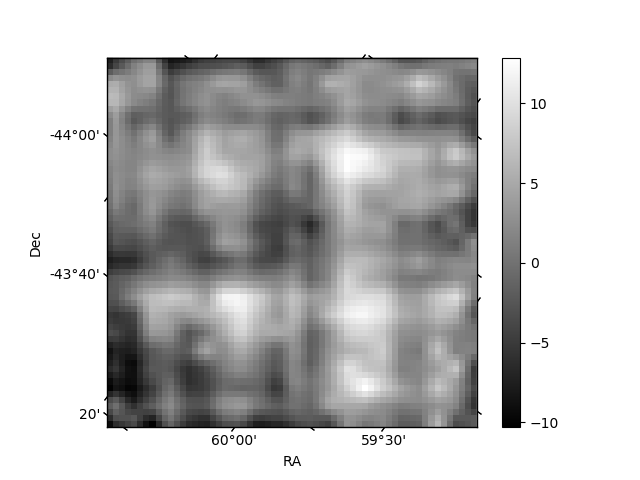
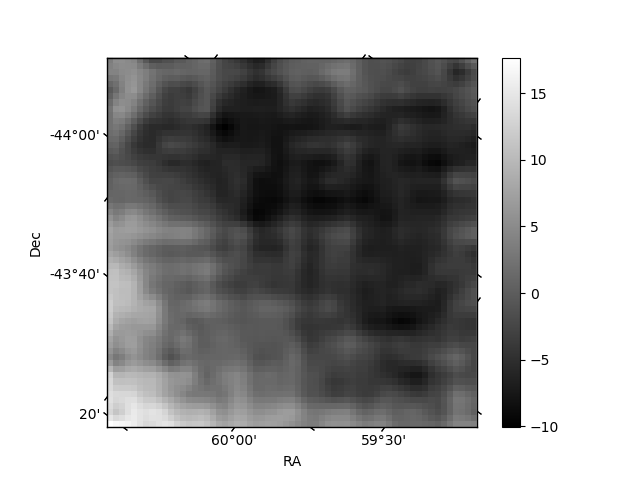
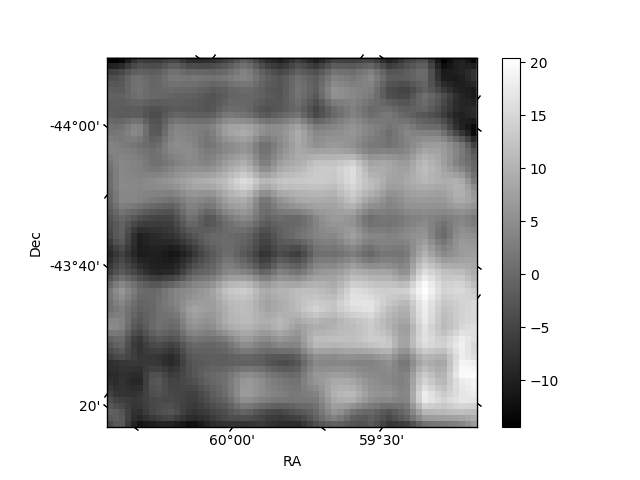
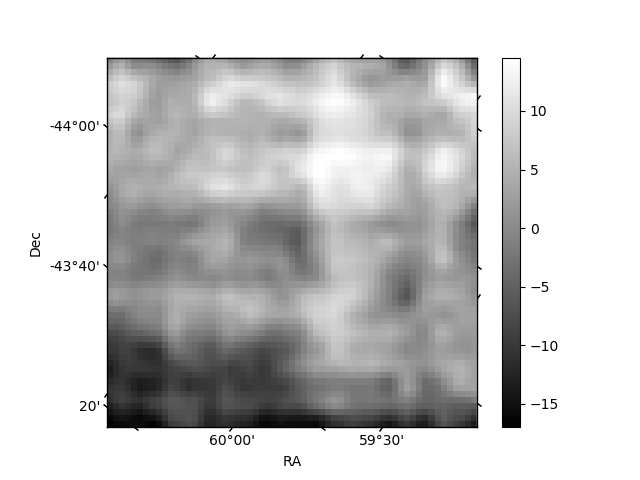
Histogram calculated using DETX and DETY for each event in the final _common_clean file
| Quadrant A | 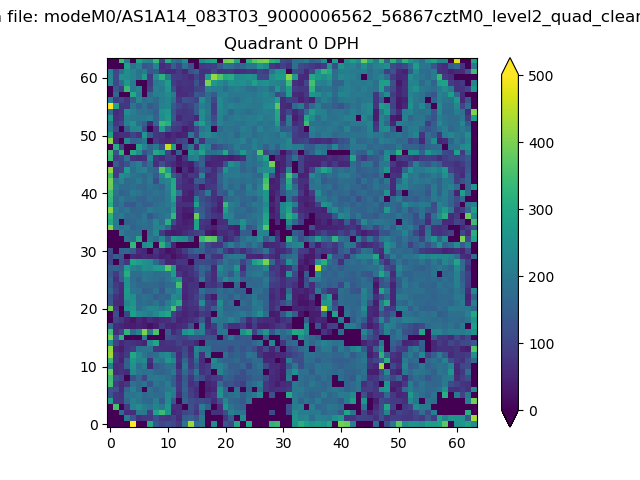 |
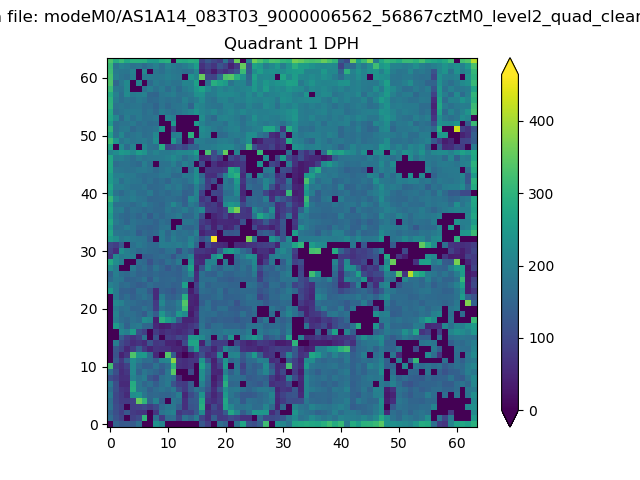 |
Quadrant B |
|---|---|---|---|
| Quadrant D | 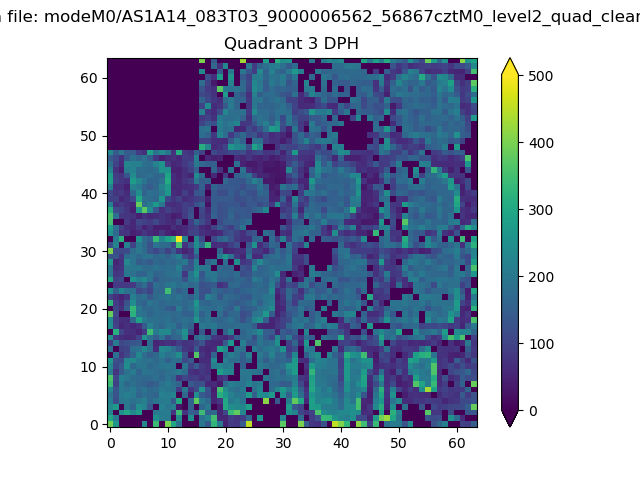 |
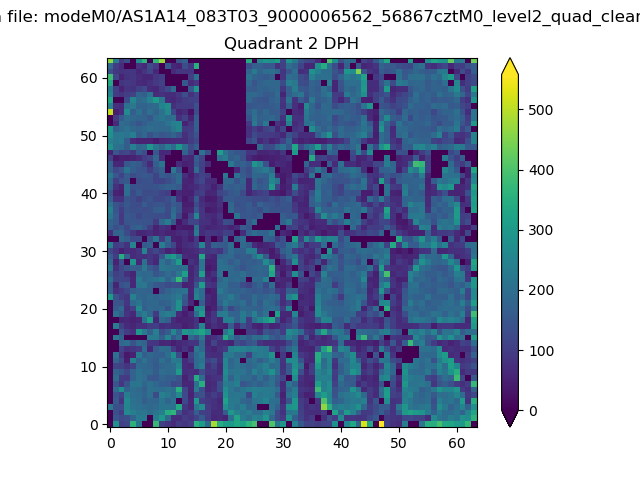 |
Quadrant C |
| Plot type | Count rate plots | Images |
|---|---|---|
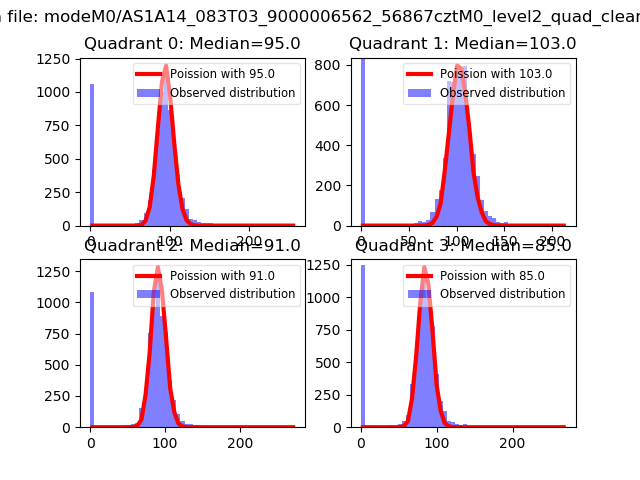
| Comparison with Poisson distribution Blue bars denote a histogram of data divided into 1 sec bins. Red curve is a Poisson curve with rate = median count rate of data. |
 |
 |
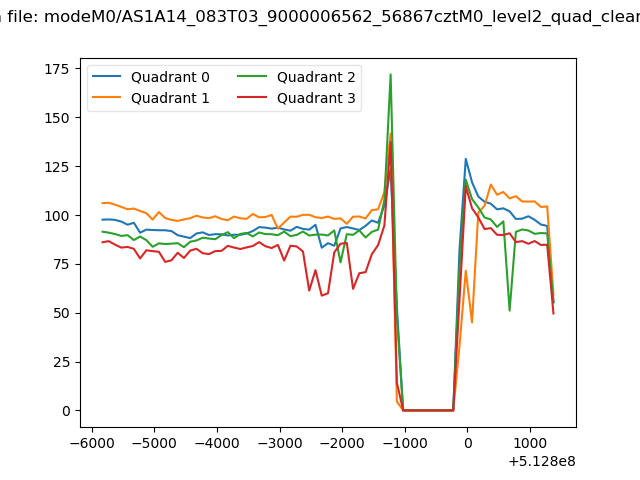
| Quadrant-wise count rates Data is divided into 100 sec bins |
 |
|
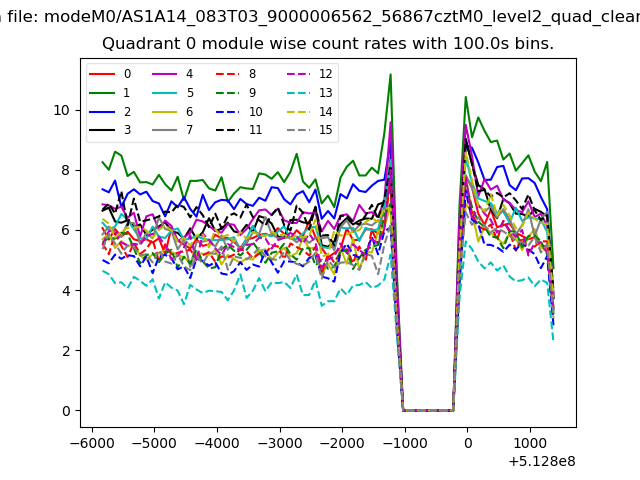
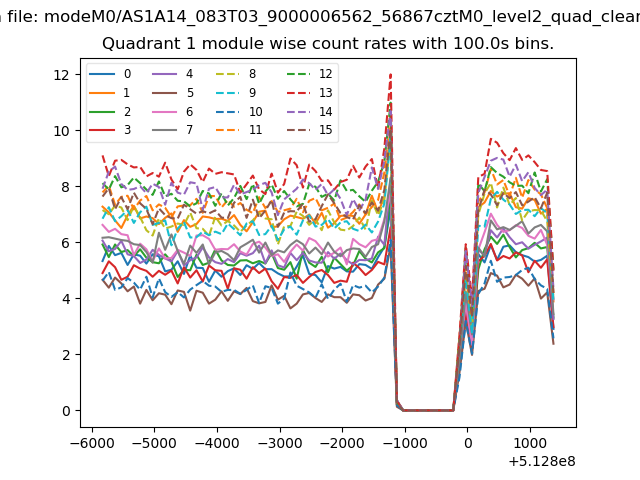
| Module-wise count rates for Quadrant A Data is divided into 100 sec bins |
 |
 |
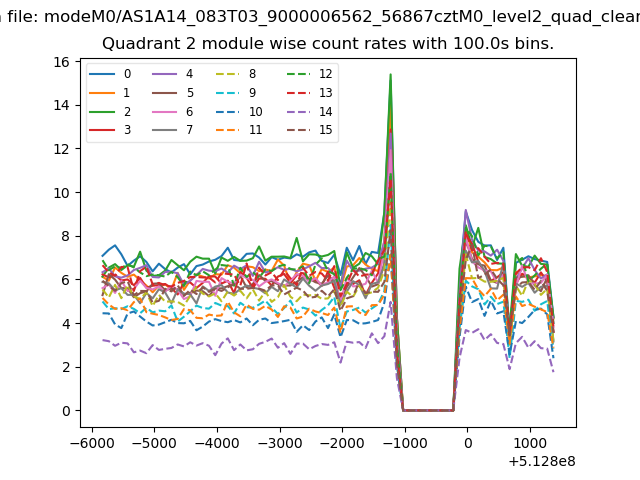
| Module-wise count rates for Quadrant B Data is divided into 100 sec bins |
 |
 |
| Module-wise count rates for Quadrant C Data is divided into 100 sec bins |
 |
 |
| Module-wise count rates for Quadrant D Data is divided into 100 sec bins |
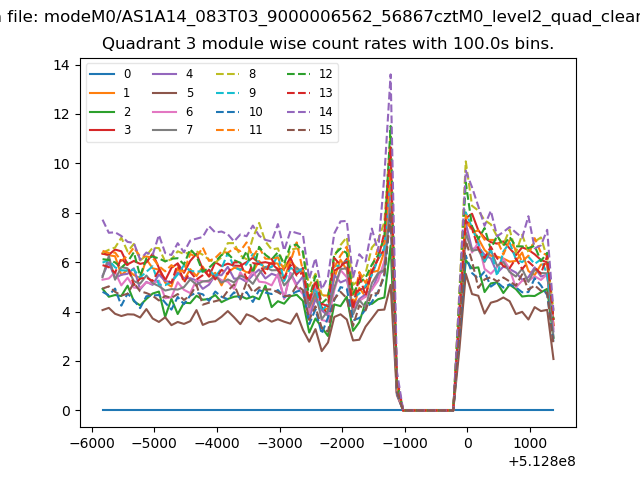 |
 |
| Parameter | Plot |
|---|---|
| CZT HV Monitor | 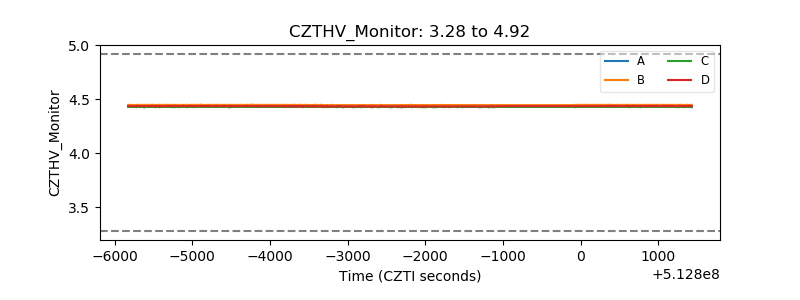 |
| D_VDD | 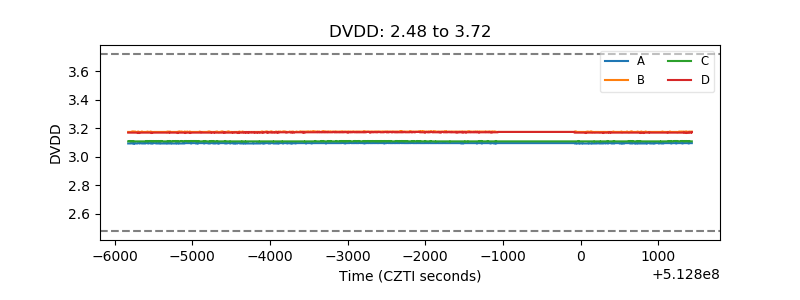 |
| Temperature 1 | 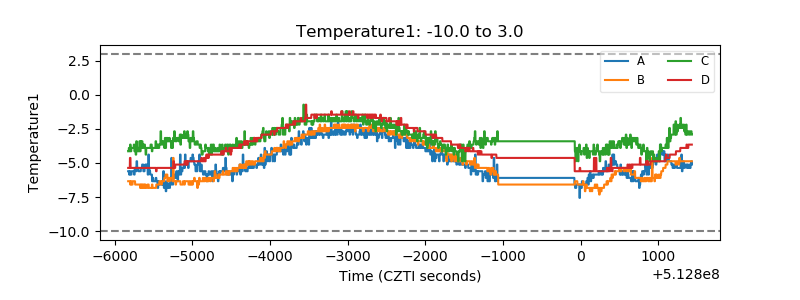 |
| Veto HV Monitor | 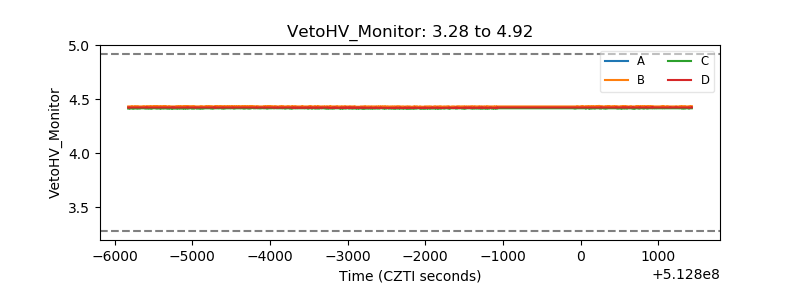 |
| Veto LLD | 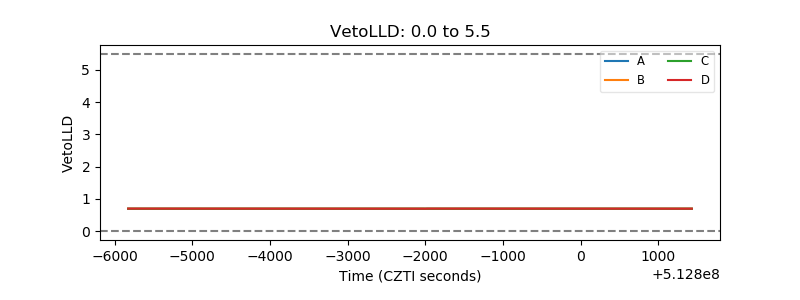 |
| Alpha Counter | 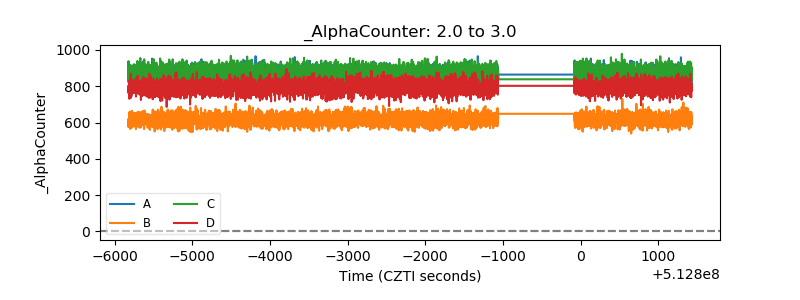 |
| _CPM_Rate | 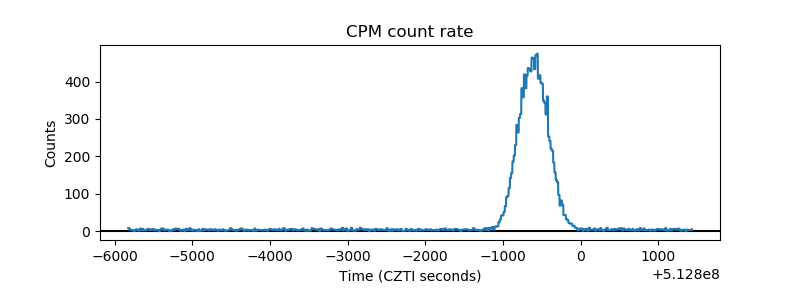 |
| CZT Counter | 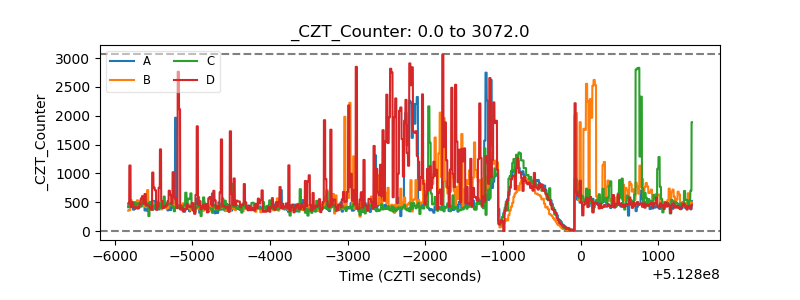 |
| +2.5 Volts monitor |  |
| +5 Volts monitor | 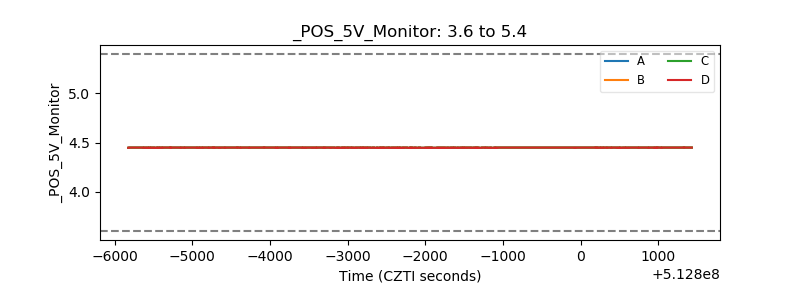 |
| _ROLL_ROT | 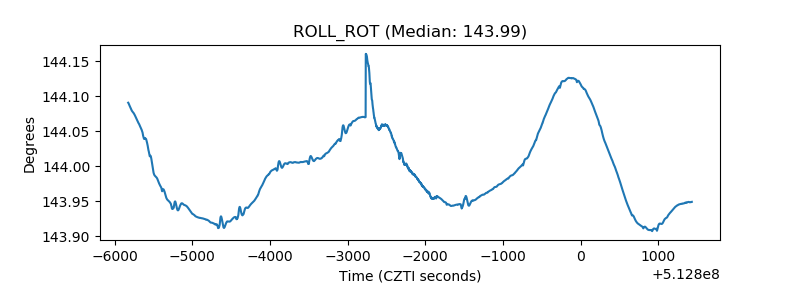 |
| _Roll_DEC | 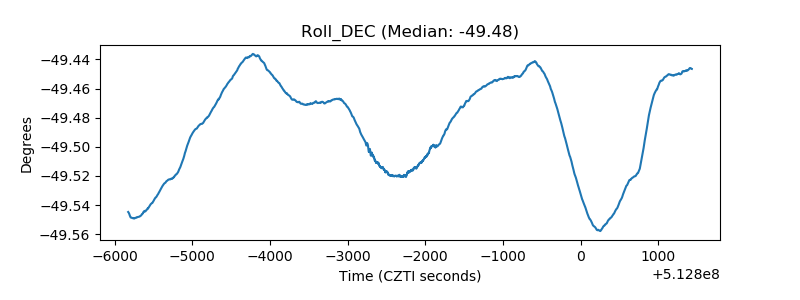 |
| _Roll_RA | 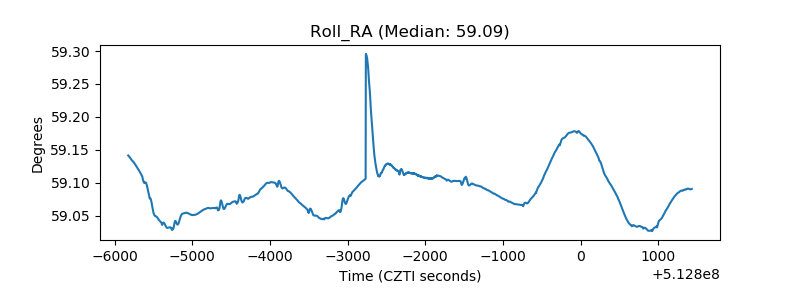 |
| Veto Counter | 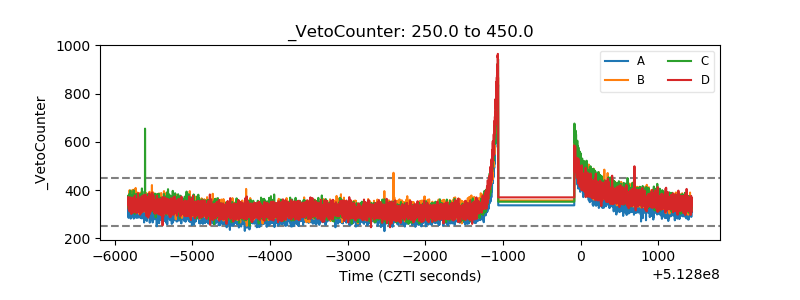 |