| Param | Original file | Final file |
|---|---|---|
| Filename | modeM0/AS1A14_083T03_9000006562_56868cztM0_level2.fits | modeM0/AS1A14_083T03_9000006562_56868cztM0_level2_quad_clean.evt |
| Size (bytes) | 454,976,640 | 96,840,000 |
| Size | 433.9 MB | 92.4 MB |
| Events in quadrant A | 3,018,321 | 653,756 |
| Events in quadrant B | 5,609,660 | 633,429 |
| Events in quadrant C | 3,633,350 | 615,518 |
| Events in quadrant D | 4,078,371 | 578,827 |
| Mode M9 | |||
|---|---|---|---|
| Quadrant | BADHDUFLAG | Total packets | Discarded packets |
| A | 0 | 11 | 0 |
| B | 0 | 11 | 0 |
| C | 0 | 11 | 0 |
| D | 0 | 11 | 0 |
| Mode SS | |||
|---|---|---|---|
| Quadrant | BADHDUFLAG | Total packets | Discarded packets |
| A | 0 | 132 | 0 |
| B | 0 | 132 | 0 |
| C | 0 | 132 | 0 |
| D | 0 | 132 | 0 |
| Mode M0 | |||
|---|---|---|---|
| Quadrant | BADHDUFLAG | Total packets | Discarded packets |
| A | 0 | 13487 | 2 |
| B | 0 | 21041 | 2 |
| C | 0 | 15311 | 2 |
| D | 0 | 16574 | 2 |
| Quadrant | Total seconds | Saturated seconds | Saturation percentage |
|---|---|---|---|
| A | 6460 | 40 | 0.619195% |
| B | 6461 | 648 | 10.029407% |
| C | 6461 | 150 | 2.321622% |
| D | 6461 | 188 | 2.909766% |
Noise dominated data is calculated using 1-second bins in cleaned event files. If a bin has >2000 counts, and if more than 50% of those come from <1% of pixels, then it is considered to be noise-dominated and hence unusable.
| Quadrant | # 1 sec bins | Bins with >0 counts | Bins with >2000 counts | High rate bins dominated by noise | Noise dominated (total time) | Noise dominated (detector-on time) | Marked lightcurve |
|---|---|---|---|---|---|---|---|
| A | 7570 | 6460 | 8 | 8 | 0.11% | 0.12% | 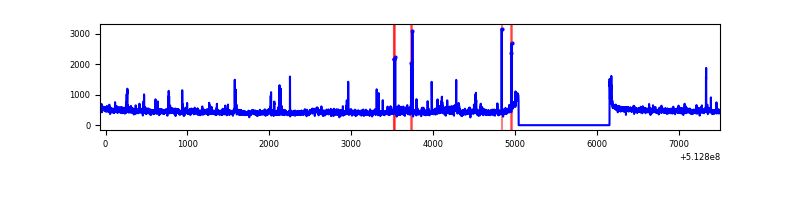 |
| B | 7571 | 6461 | 490 | 490 | 6.47% | 7.58% | 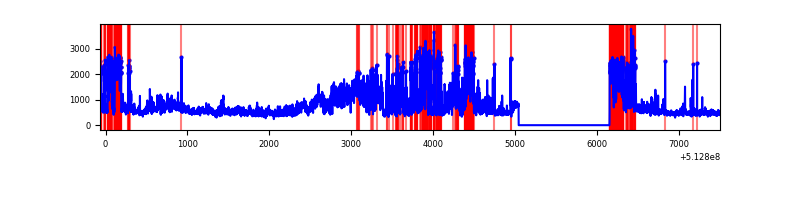 |
| C | 7571 | 6461 | 102 | 102 | 1.35% | 1.58% | 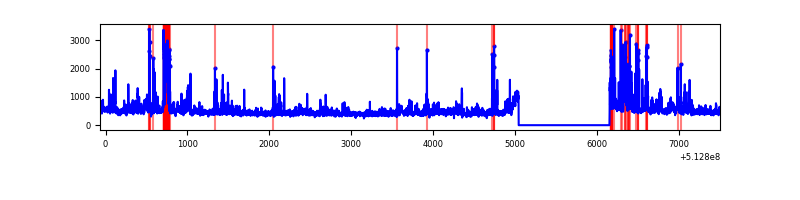 |
| D | 7571 | 6461 | 174 | 174 | 2.30% | 2.69% | 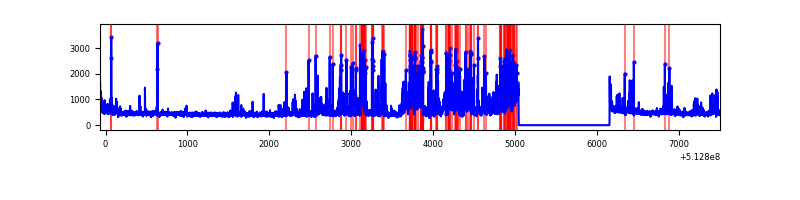 |
Top three noisy pixels from each quadrant. If the there are fewer than three noisy pixels in the level2.evt file, extra rows are filled as -1
| Pixel properties | Quadrant properties | ||||||
|---|---|---|---|---|---|---|---|
| Quadrant | DetID | PixID | Counts | Sigma | Mean | Median | Sigma |
| A | 7 | 64 | 118436 | 671.18 | 713 | 698 | 175.4 |
| A | 3 | 62 | 52793 | 296.97 | 713 | 698 | 175.4 |
| A | 3 | 14 | 44695 | 250.81 | 713 | 698 | 175.4 |
| B | 5 | 185 | 2054498 | 14376.27 | 668 | 643 | 142.9 |
| B | 10 | 16 | 743312 | 5198.42 | 668 | 643 | 142.9 |
| B | 8 | 128 | 64073 | 443.99 | 668 | 643 | 142.9 |
| C | 13 | 3 | 483560 | 2550.44 | 691 | 685 | 189.3 |
| C | 1 | 16 | 264637 | 1394.13 | 691 | 685 | 189.3 |
| C | 14 | 96 | 54966 | 286.7 | 691 | 685 | 189.3 |
| D | 8 | 240 | 463887 | 2382.43 | 688 | 656 | 194.4 |
| D | 2 | 249 | 373753 | 1918.86 | 688 | 656 | 194.4 |
| D | 7 | 96 | 355692 | 1825.98 | 688 | 656 | 194.4 |
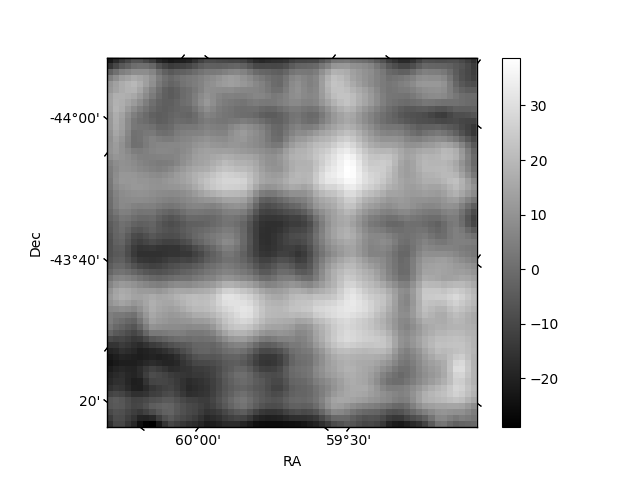
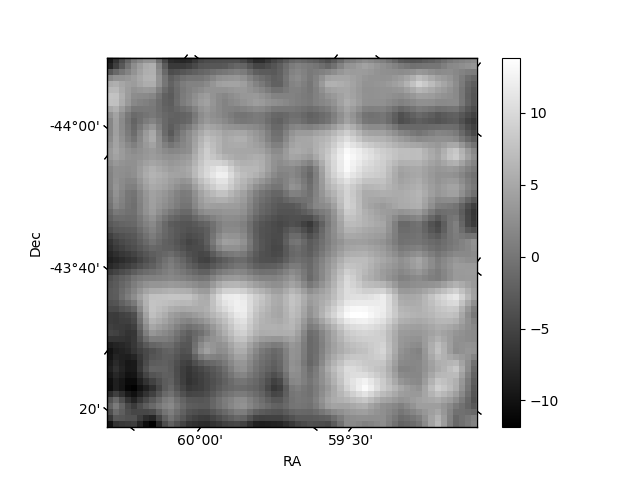
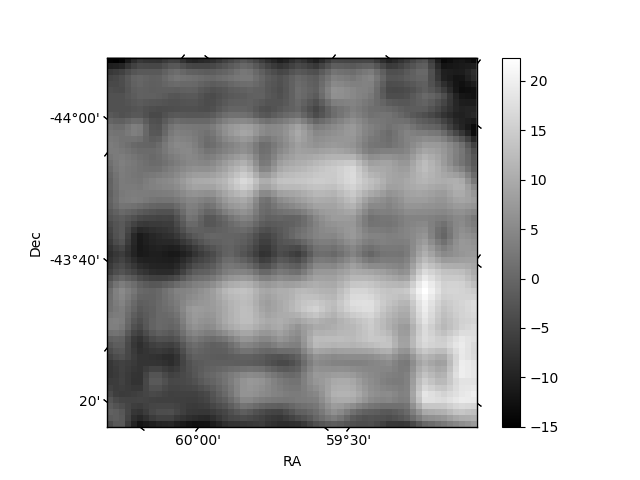
Histogram calculated using DETX and DETY for each event in the final _common_clean file
| Quadrant A | 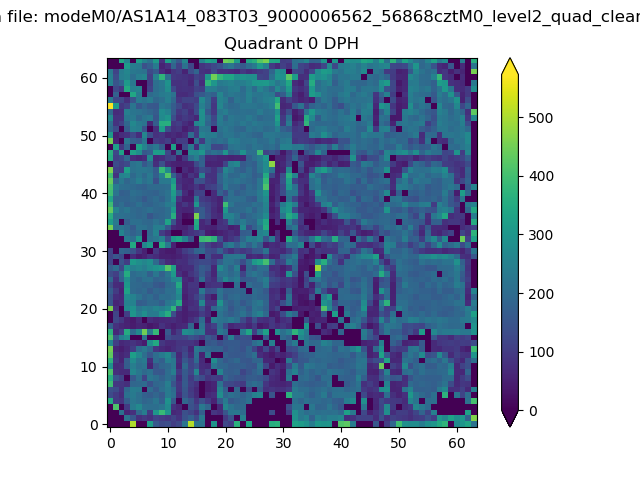 |
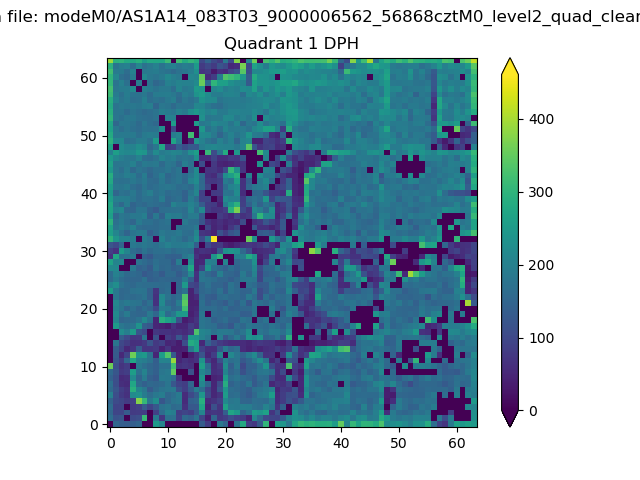 |
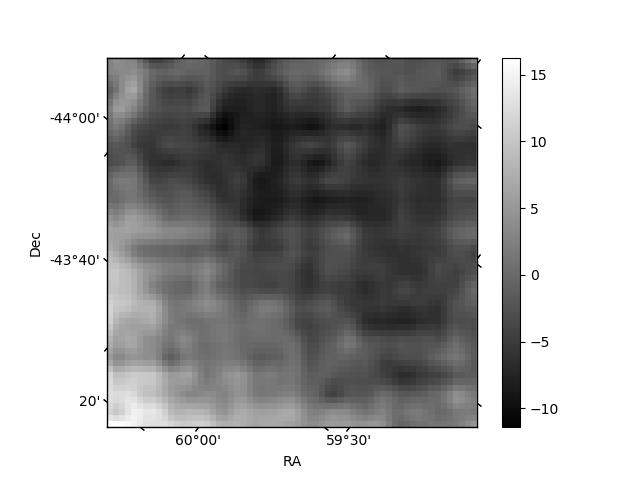
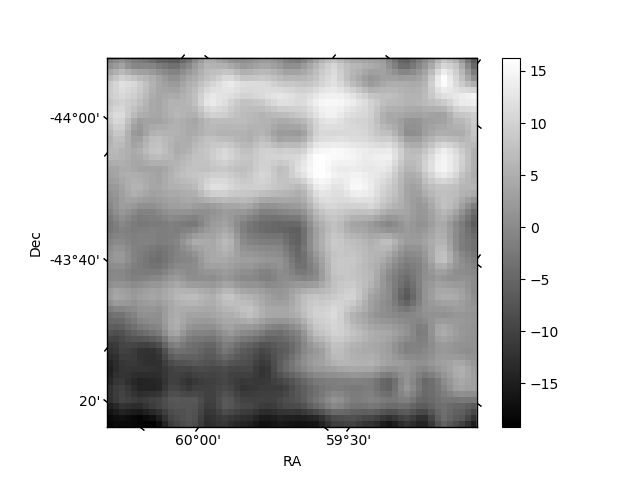
Quadrant B |
|---|---|---|---|
| Quadrant D | 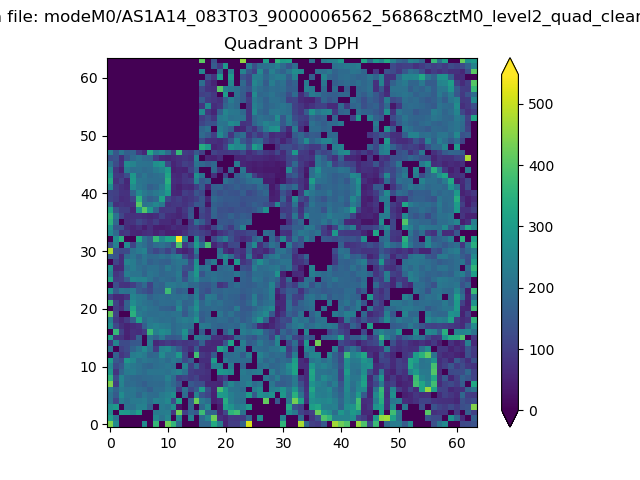 |
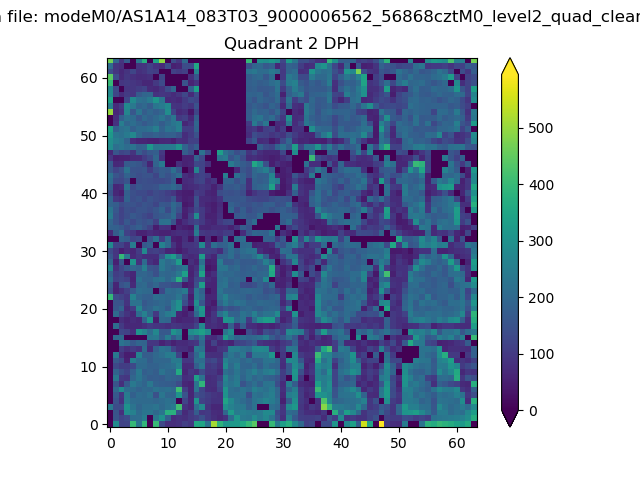 |
Quadrant C |
| Plot type | Count rate plots | Images |
|---|---|---|
| Comparison with Poisson distribution Blue bars denote a histogram of data divided into 1 sec bins. Red curve is a Poisson curve with rate = median count rate of data. |
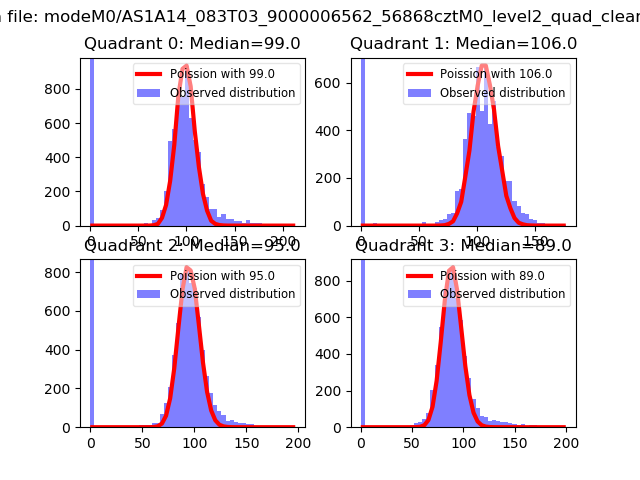 |
 |
| Quadrant-wise count rates Data is divided into 100 sec bins |
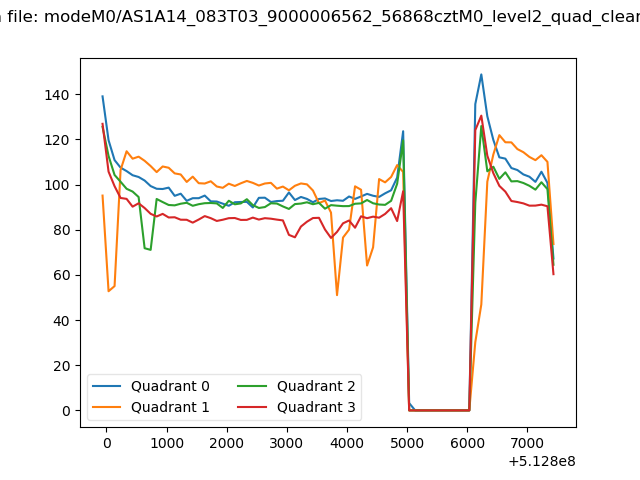 |
|
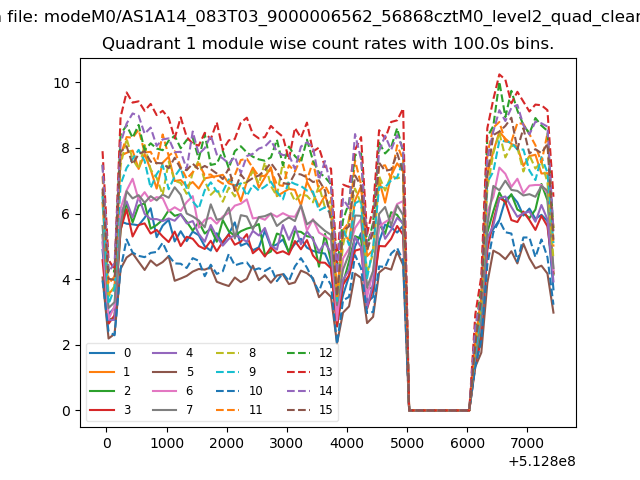
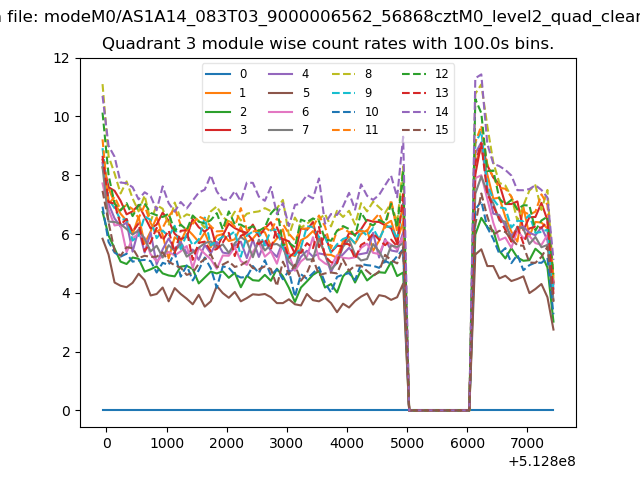
| Module-wise count rates for Quadrant A Data is divided into 100 sec bins |
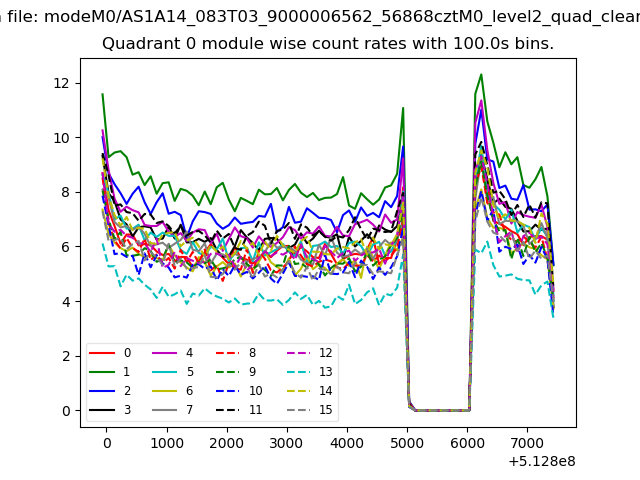 |
 |
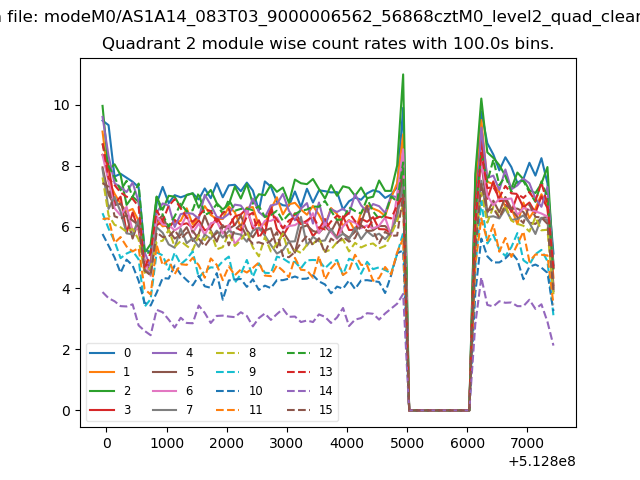
| Module-wise count rates for Quadrant B Data is divided into 100 sec bins |
 |
 |
| Module-wise count rates for Quadrant C Data is divided into 100 sec bins |
 |
 |
| Module-wise count rates for Quadrant D Data is divided into 100 sec bins |
 |
 |
| Parameter | Plot |
|---|---|
| CZT HV Monitor | 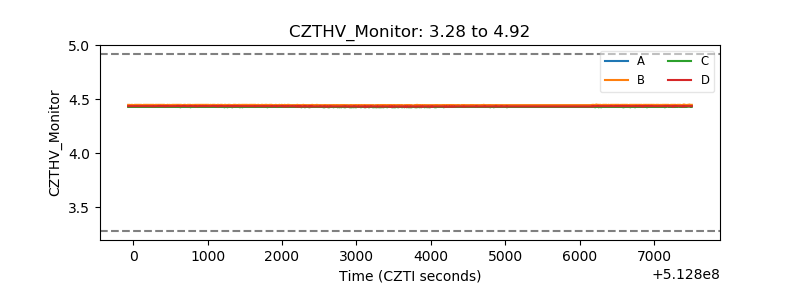 |
| D_VDD | 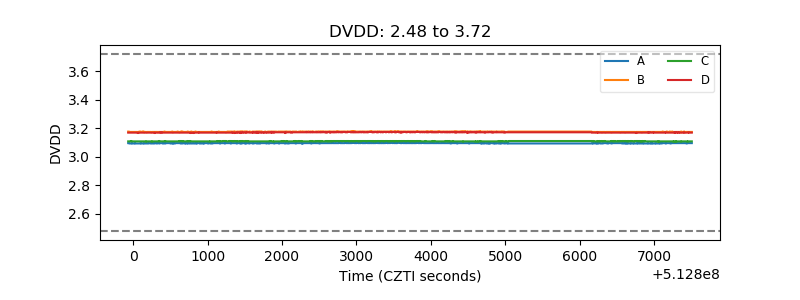 |
| Temperature 1 | 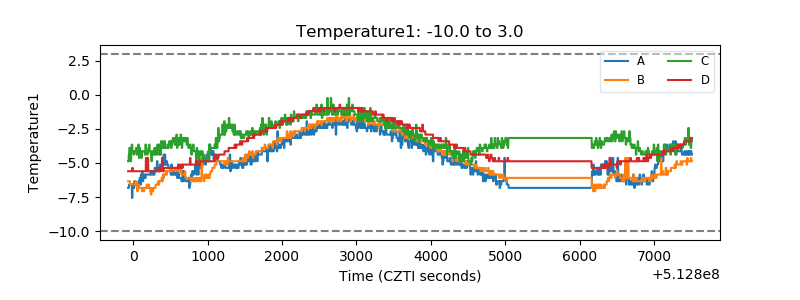 |
| Veto HV Monitor | 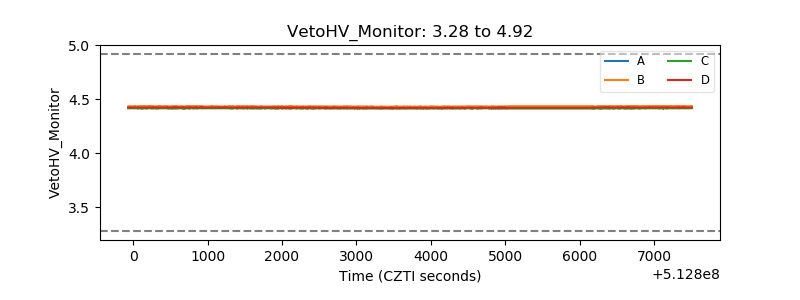 |
| Veto LLD | 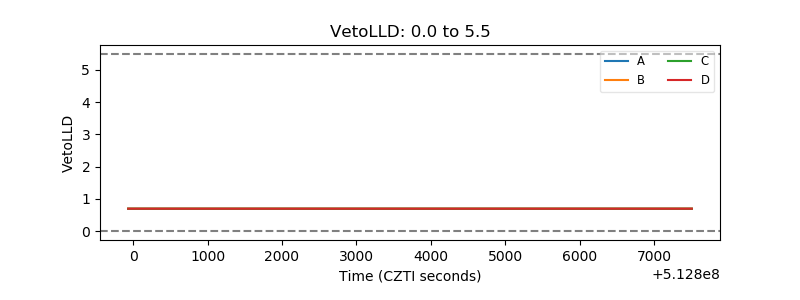 |
| Alpha Counter | 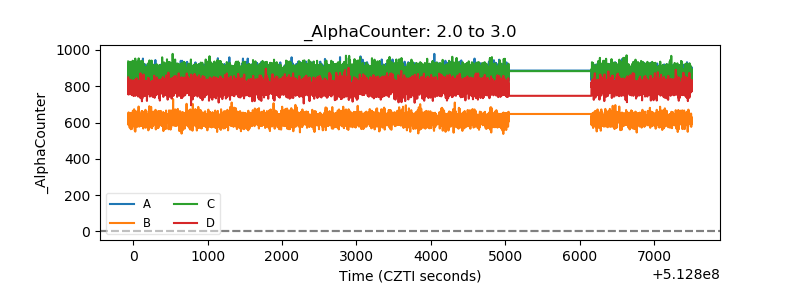 |
| _CPM_Rate | 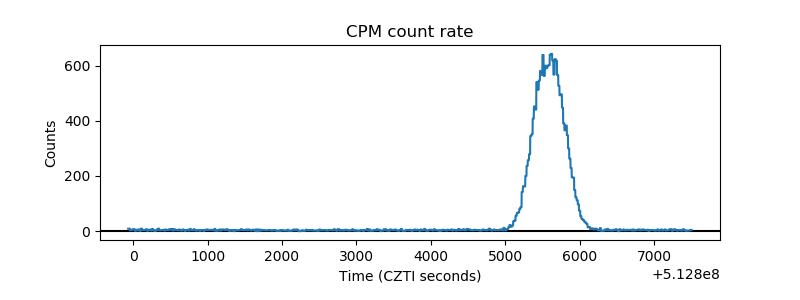 |
| CZT Counter | 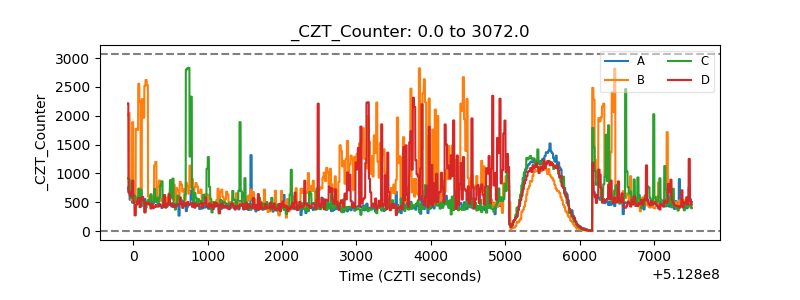 |
| +2.5 Volts monitor | 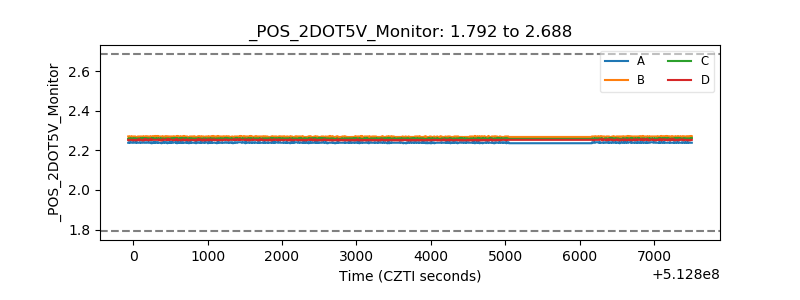 |
| +5 Volts monitor | 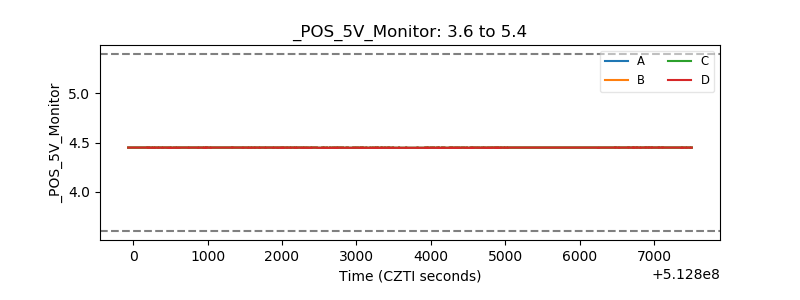 |
| _ROLL_ROT | 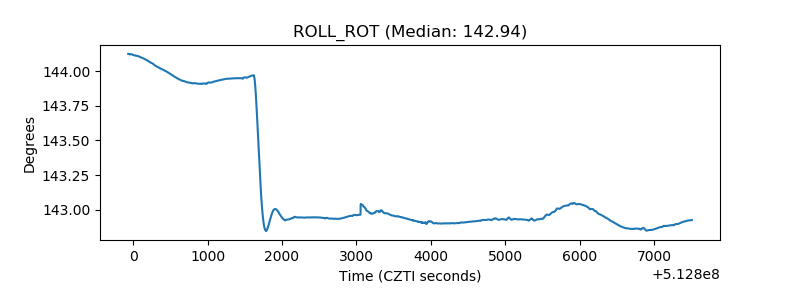 |
| _Roll_DEC | 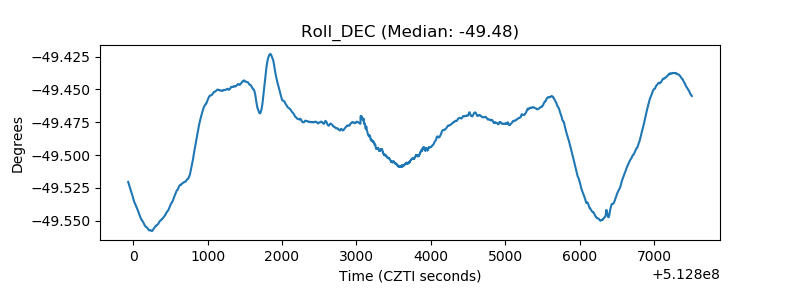 |
| _Roll_RA | 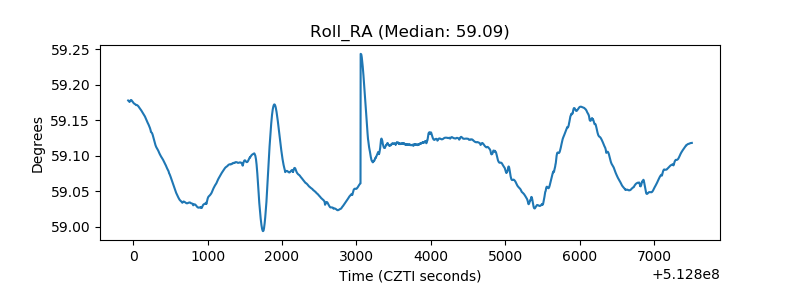 |
| Veto Counter | 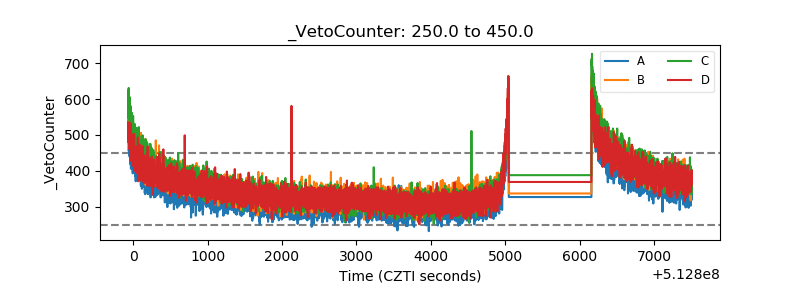 |