| Param | Original file | Final file |
|---|---|---|
| Filename | modeM0/AS1A14_083T03_9000006562_56869cztM0_level2.fits | modeM0/AS1A14_083T03_9000006562_56869cztM0_level2_quad_clean.evt |
| Size (bytes) | 459,371,520 | 89,841,600 |
| Size | 438.1 MB | 85.7 MB |
| Events in quadrant A | 3,353,348 | 607,325 |
| Events in quadrant B | 4,393,872 | 611,824 |
| Events in quadrant C | 3,186,050 | 584,016 |
| Events in quadrant D | 5,597,981 | 492,900 |
| Mode M9 | |||
|---|---|---|---|
| Quadrant | BADHDUFLAG | Total packets | Discarded packets |
| A | 0 | 11 | 0 |
| B | 0 | 11 | 0 |
| C | 0 | 11 | 0 |
| D | 0 | 11 | 0 |
| Mode SS | |||
|---|---|---|---|
| Quadrant | BADHDUFLAG | Total packets | Discarded packets |
| A | 0 | 122 | 0 |
| B | 0 | 122 | 0 |
| C | 0 | 122 | 0 |
| D | 0 | 122 | 0 |
| Mode M0 | |||
|---|---|---|---|
| Quadrant | BADHDUFLAG | Total packets | Discarded packets |
| A | 0 | 14087 | 1 |
| B | 0 | 17196 | 1 |
| C | 0 | 13661 | 1 |
| D | 0 | 20749 | 1 |
| Quadrant | Total seconds | Saturated seconds | Saturation percentage |
|---|---|---|---|
| A | 6084 | 138 | 2.268245% |
| B | 6083 | 558 | 9.173105% |
| C | 6083 | 131 | 2.153543% |
| D | 6084 | 845 | 13.888889% |
Noise dominated data is calculated using 1-second bins in cleaned event files. If a bin has >2000 counts, and if more than 50% of those come from <1% of pixels, then it is considered to be noise-dominated and hence unusable.
| Quadrant | # 1 sec bins | Bins with >0 counts | Bins with >2000 counts | High rate bins dominated by noise | Noise dominated (total time) | Noise dominated (detector-on time) | Marked lightcurve |
|---|---|---|---|---|---|---|---|
| A | 7164 | 6084 | 44 | 44 | 0.61% | 0.72% | 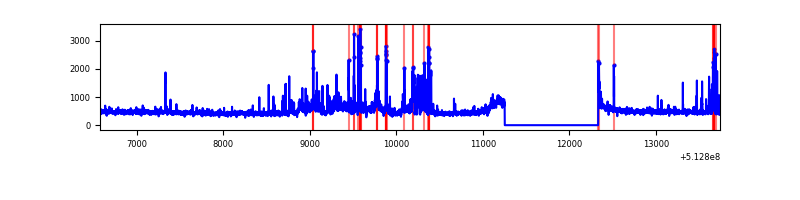 |
| B | 7163 | 6083 | 378 | 378 | 5.28% | 6.21% | 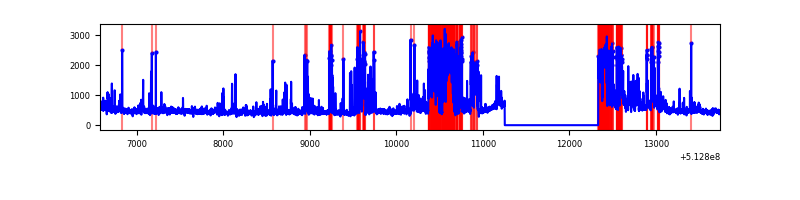 |
| C | 7163 | 6083 | 48 | 48 | 0.67% | 0.79% | 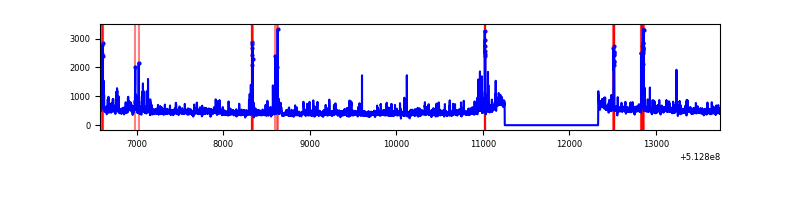 |
| D | 7164 | 6084 | 815 | 815 | 11.38% | 13.40% | 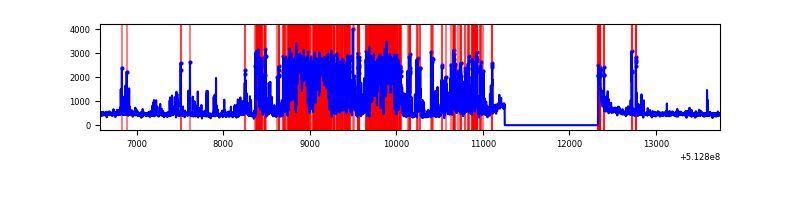 |
Top three noisy pixels from each quadrant. If the there are fewer than three noisy pixels in the level2.evt file, extra rows are filled as -1
| Pixel properties | Quadrant properties | ||||||
|---|---|---|---|---|---|---|---|
| Quadrant | DetID | PixID | Counts | Sigma | Mean | Median | Sigma |
| A | 7 | 64 | 311750 | 1872.0 | 677 | 660 | 166.2 |
| A | 3 | 14 | 162207 | 972.12 | 677 | 660 | 166.2 |
| A | 10 | 251 | 105300 | 629.68 | 677 | 660 | 166.2 |
| B | 5 | 185 | 1204489 | 8746.04 | 640 | 619 | 137.6 |
| B | 10 | 16 | 413032 | 2996.15 | 640 | 619 | 137.6 |
| B | 0 | 63 | 86684 | 625.26 | 640 | 619 | 137.6 |
| C | 1 | 16 | 279991 | 1559.72 | 656 | 651 | 179.1 |
| C | 13 | 3 | 97898 | 542.99 | 656 | 651 | 179.1 |
| C | 14 | 254 | 93172 | 516.6 | 656 | 651 | 179.1 |
| D | 2 | 249 | 1990385 | 11248.7 | 626 | 597 | 176.9 |
| D | 8 | 240 | 778897 | 4399.9 | 626 | 597 | 176.9 |
| D | 7 | 96 | 130974 | 737.05 | 626 | 597 | 176.9 |
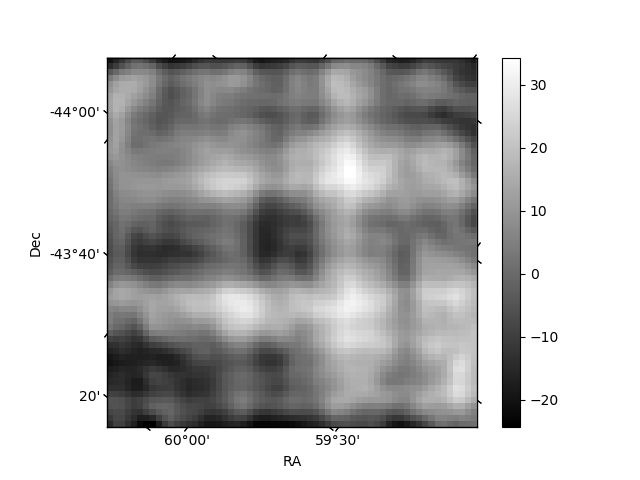
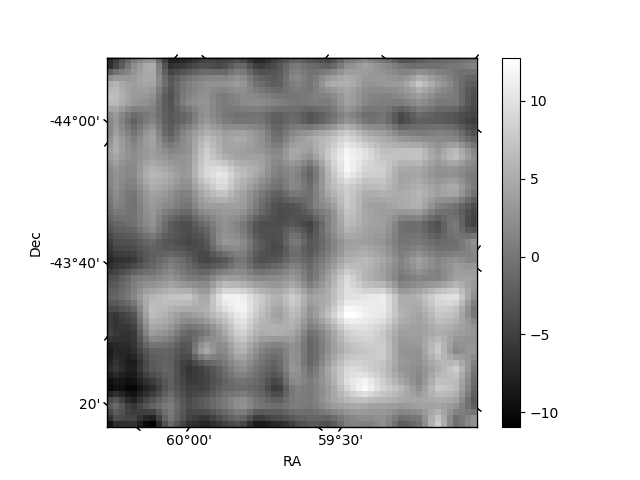
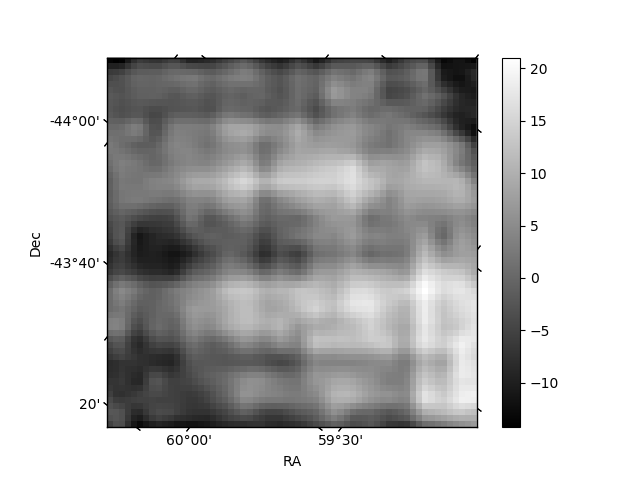
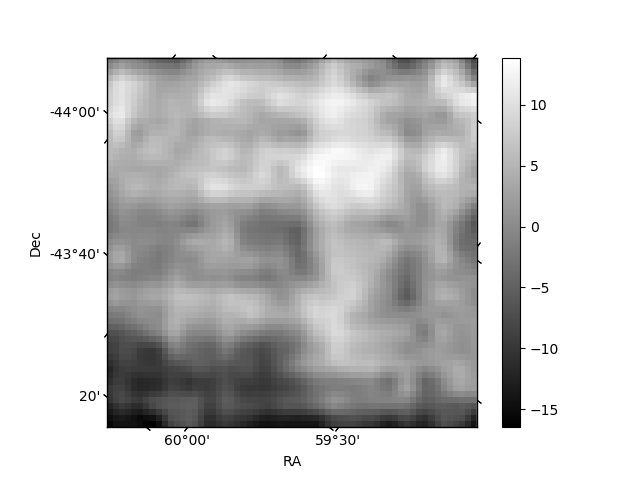
Histogram calculated using DETX and DETY for each event in the final _common_clean file
| Quadrant A | 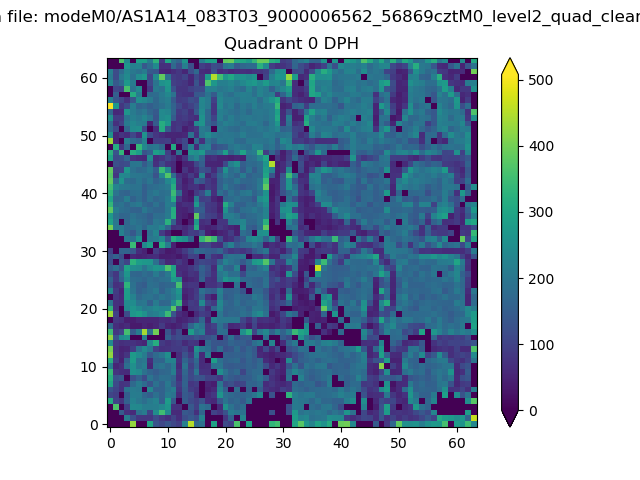 |
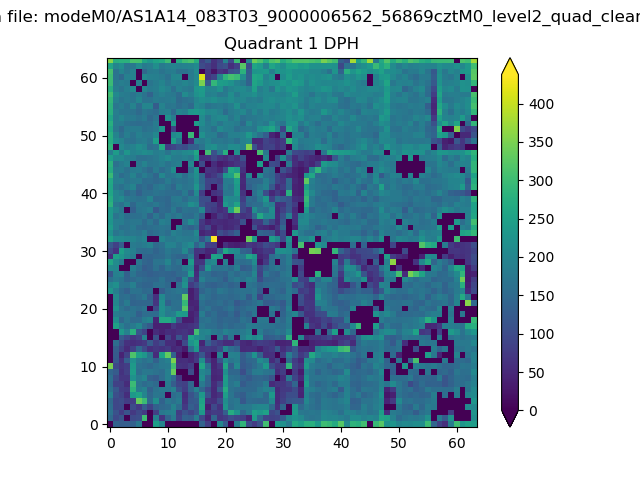 |
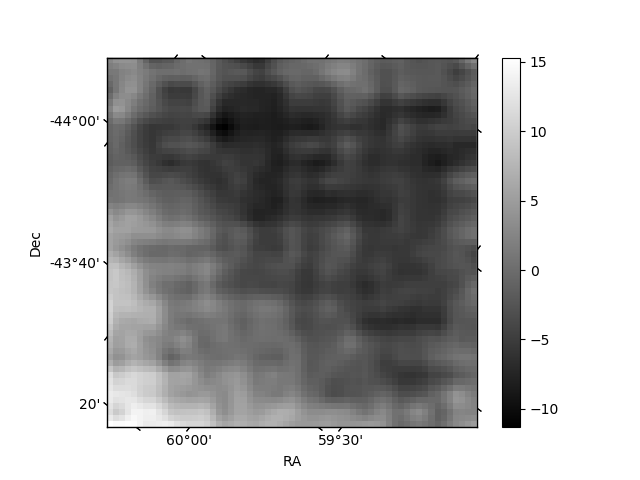
Quadrant B |
|---|---|---|---|
| Quadrant D | 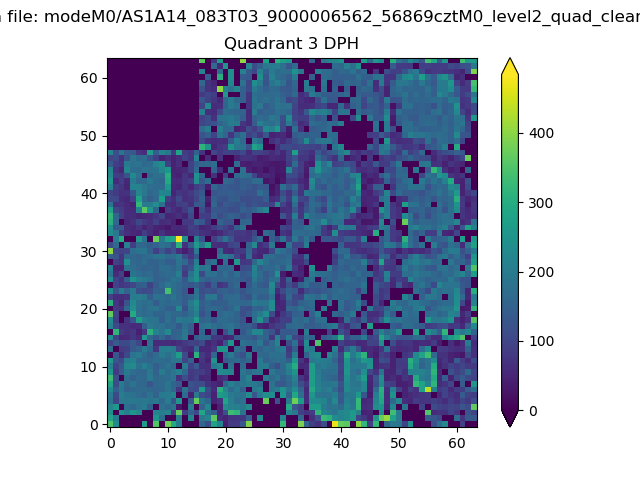 |
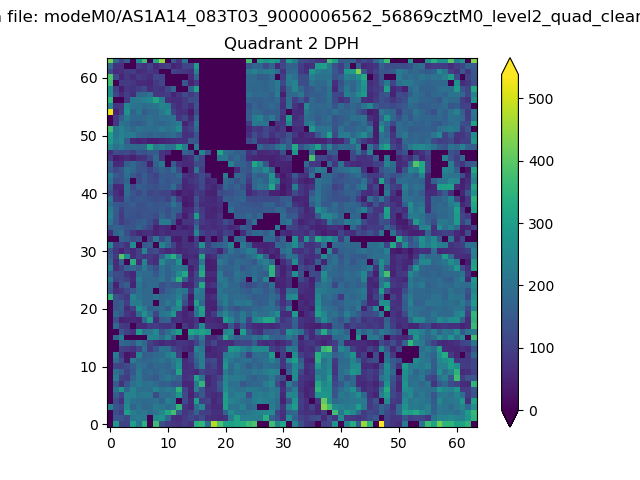 |
Quadrant C |
| Plot type | Count rate plots | Images |
|---|---|---|
| Comparison with Poisson distribution Blue bars denote a histogram of data divided into 1 sec bins. Red curve is a Poisson curve with rate = median count rate of data. |
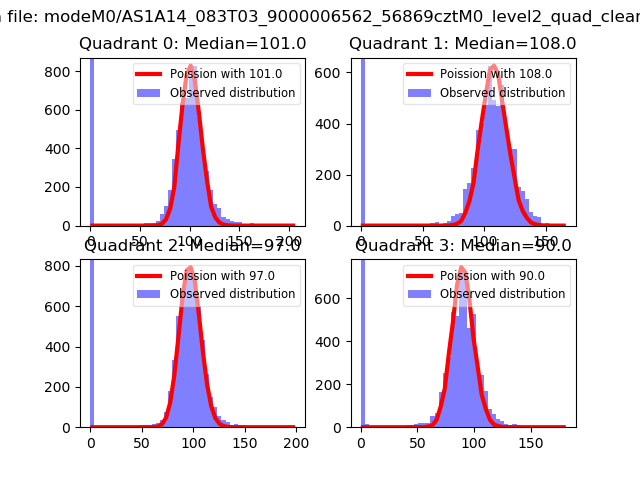 |
 |
| Quadrant-wise count rates Data is divided into 100 sec bins |
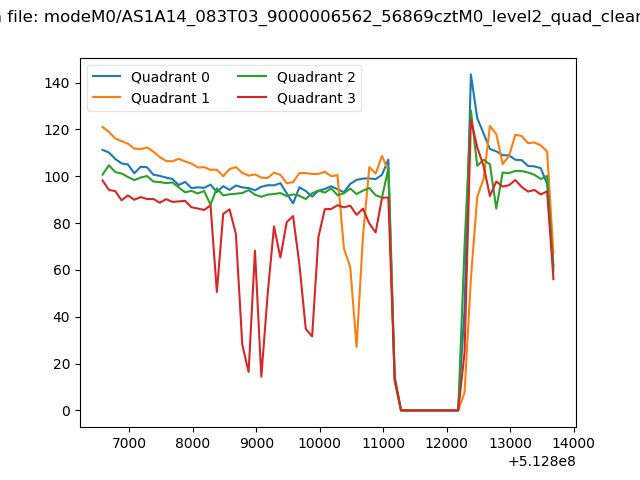 |
|
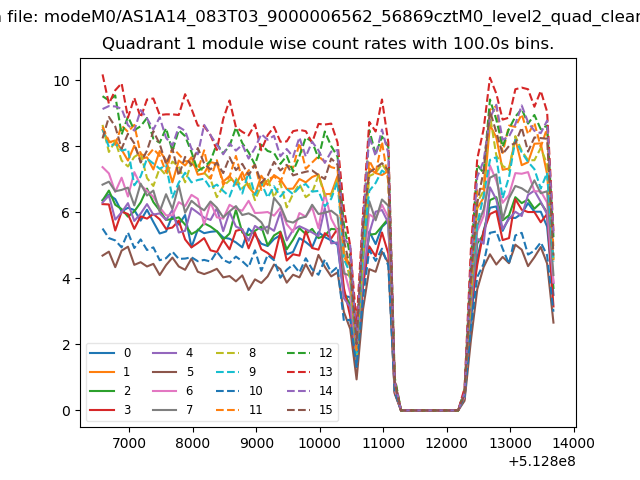
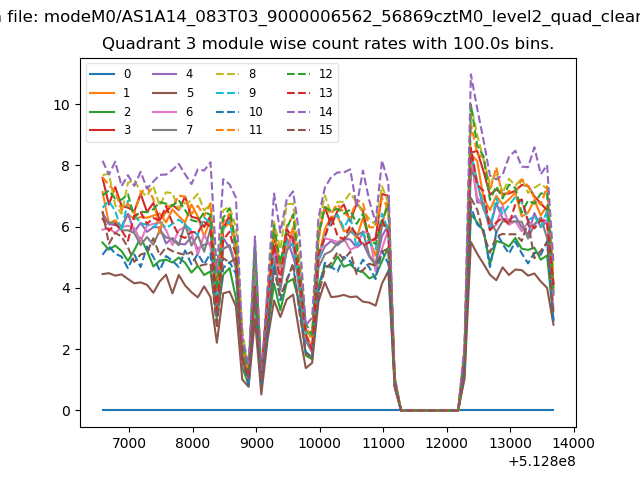
| Module-wise count rates for Quadrant A Data is divided into 100 sec bins |
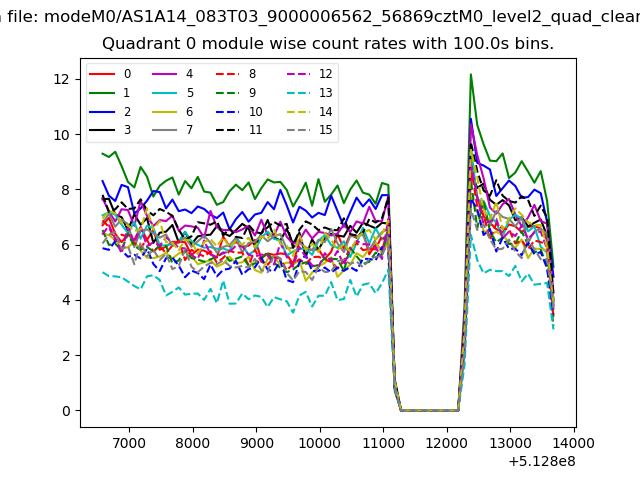 |
 |
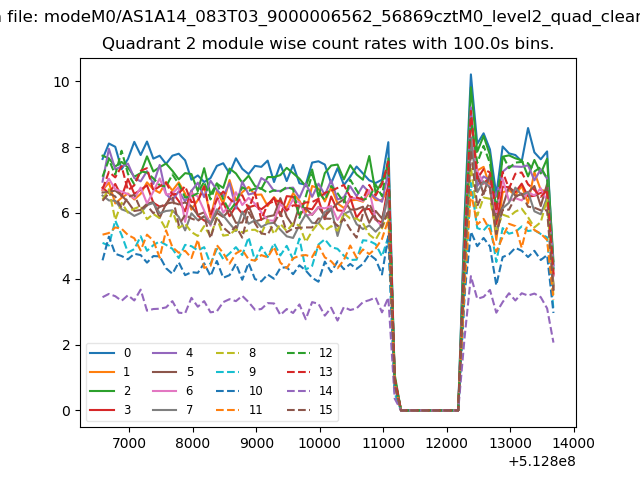
| Module-wise count rates for Quadrant B Data is divided into 100 sec bins |
 |
 |
| Module-wise count rates for Quadrant C Data is divided into 100 sec bins |
 |
 |
| Module-wise count rates for Quadrant D Data is divided into 100 sec bins |
 |
 |
| Parameter | Plot |
|---|---|
| CZT HV Monitor | 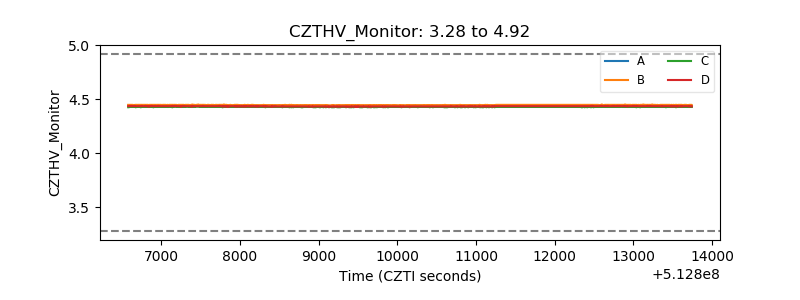 |
| D_VDD | 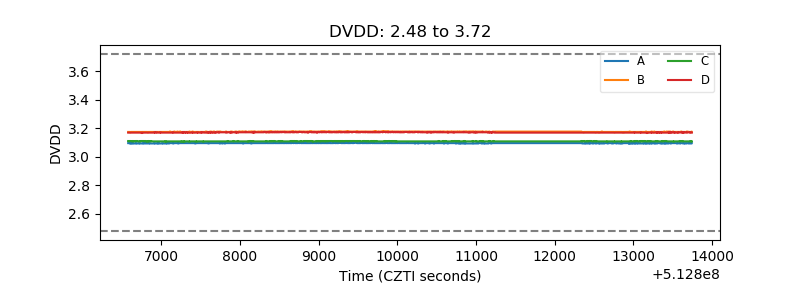 |
| Temperature 1 | 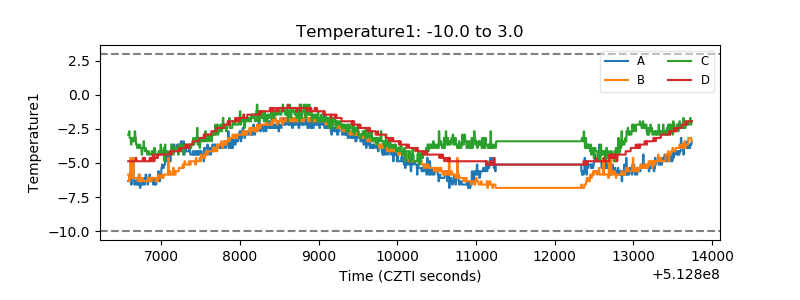 |
| Veto HV Monitor | 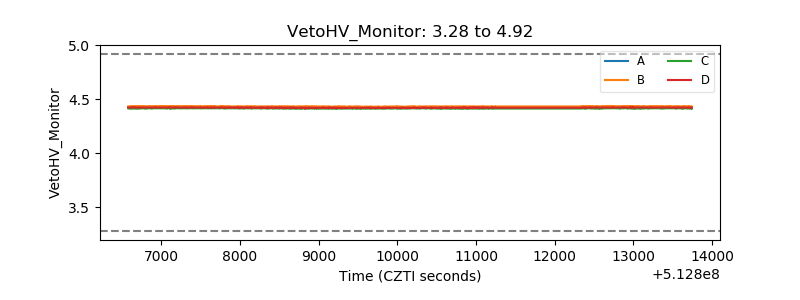 |
| Veto LLD | 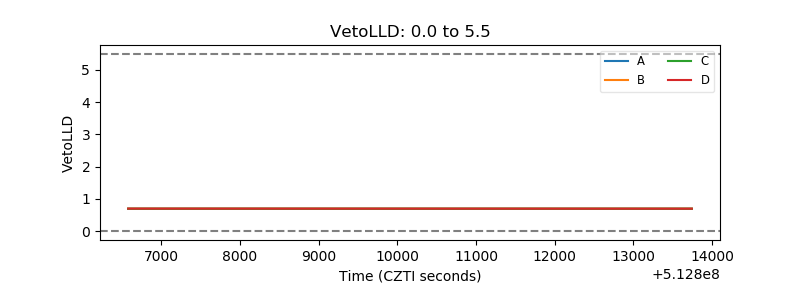 |
| Alpha Counter | 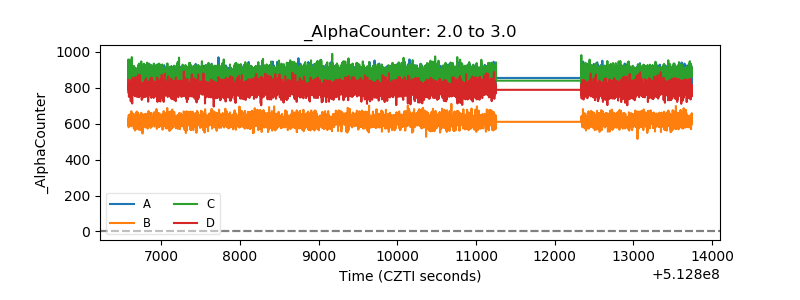 |
| _CPM_Rate | 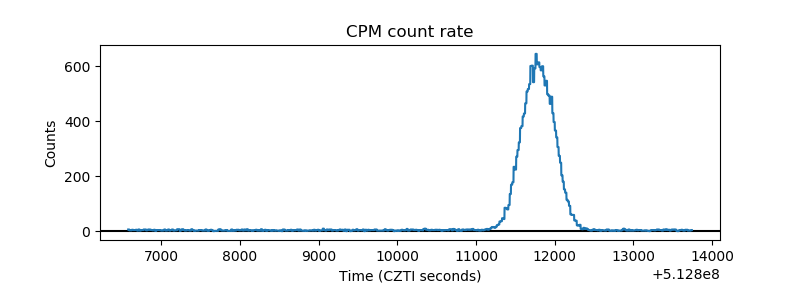 |
| CZT Counter | 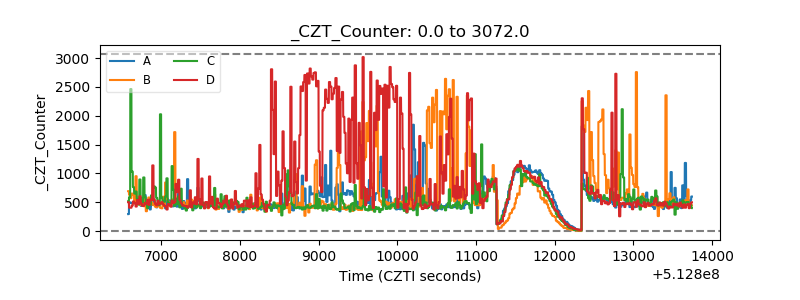 |
| +2.5 Volts monitor | 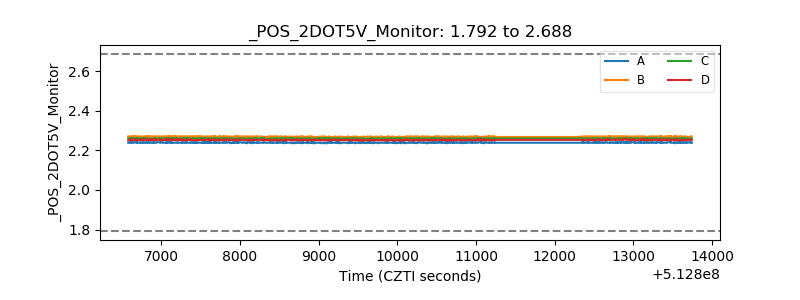 |
| +5 Volts monitor | 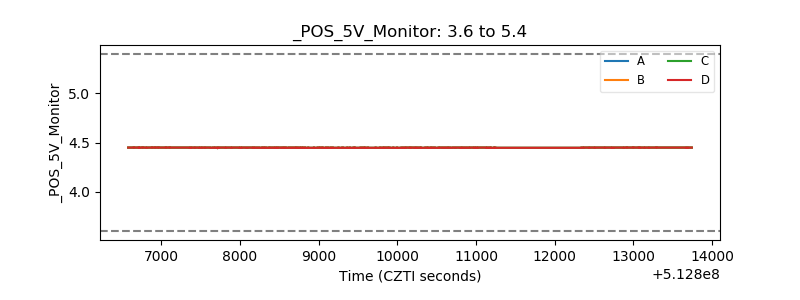 |
| _ROLL_ROT | 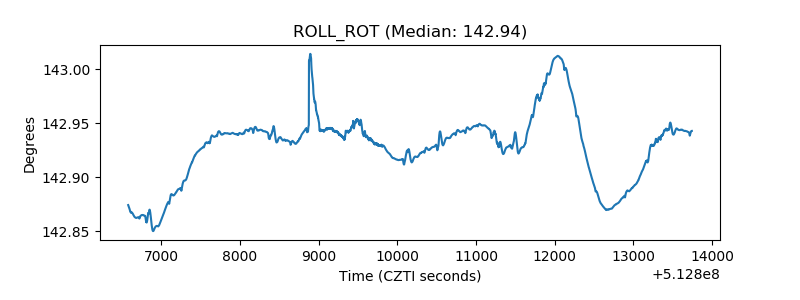 |
| _Roll_DEC | 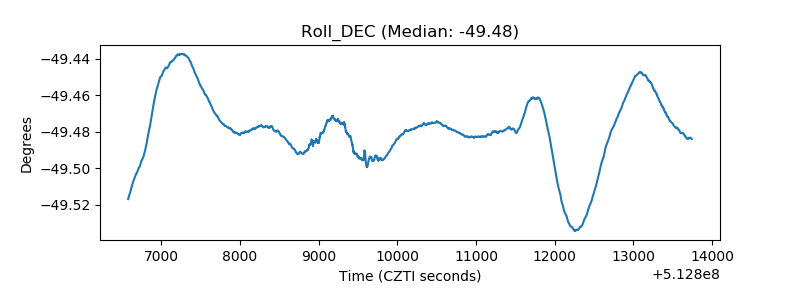 |
| _Roll_RA | 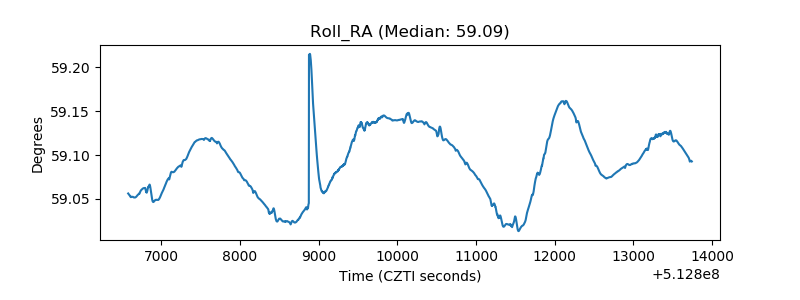 |
| Veto Counter | 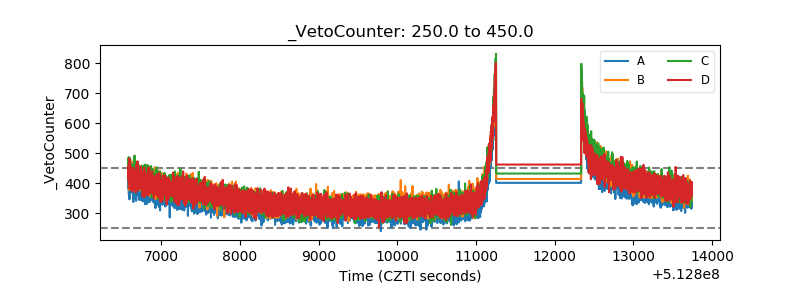 |