| Param | Original file | Final file |
|---|---|---|
| Filename | modeM0/AS1A14_083T03_9000006562_56870cztM0_level2.fits | modeM0/AS1A14_083T03_9000006562_56870cztM0_level2_quad_clean.evt |
| Size (bytes) | 492,819,840 | 102,096,000 |
| Size | 470.0 MB | 97.4 MB |
| Events in quadrant A | 3,867,314 | 685,804 |
| Events in quadrant B | 4,386,476 | 704,201 |
| Events in quadrant C | 3,750,426 | 658,396 |
| Events in quadrant D | 5,706,858 | 566,261 |
| Mode M9 | |||
|---|---|---|---|
| Quadrant | BADHDUFLAG | Total packets | Discarded packets |
| A | 0 | 10 | 0 |
| B | 0 | 10 | 0 |
| C | 0 | 10 | 0 |
| D | 0 | 10 | 0 |
| Mode SS | |||
|---|---|---|---|
| Quadrant | BADHDUFLAG | Total packets | Discarded packets |
| A | 0 | 140 | 0 |
| B | 0 | 140 | 0 |
| C | 0 | 140 | 0 |
| D | 0 | 140 | 0 |
| Mode M0 | |||
|---|---|---|---|
| Quadrant | BADHDUFLAG | Total packets | Discarded packets |
| A | 0 | 16258 | 2 |
| B | 0 | 17697 | 3 |
| C | 0 | 15707 | 2 |
| D | 0 | 21625 | 2 |
| Quadrant | Total seconds | Saturated seconds | Saturation percentage |
|---|---|---|---|
| A | 6837 | 209 | 3.056896% |
| B | 6836 | 448 | 6.553540% |
| C | 6837 | 128 | 1.872166% |
| D | 6837 | 781 | 11.423139% |
Noise dominated data is calculated using 1-second bins in cleaned event files. If a bin has >2000 counts, and if more than 50% of those come from <1% of pixels, then it is considered to be noise-dominated and hence unusable.
| Quadrant | # 1 sec bins | Bins with >0 counts | Bins with >2000 counts | High rate bins dominated by noise | Noise dominated (total time) | Noise dominated (detector-on time) | Marked lightcurve |
|---|---|---|---|---|---|---|---|
| A | 7897 | 6837 | 102 | 102 | 1.29% | 1.49% | 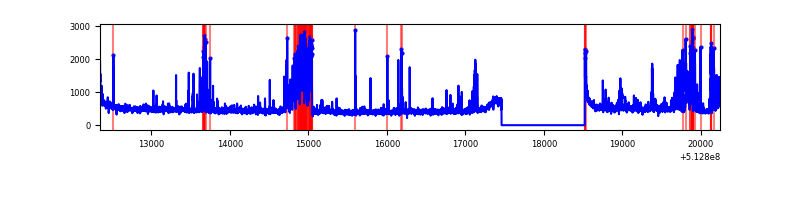 |
| B | 7896 | 6836 | 241 | 241 | 3.05% | 3.53% | 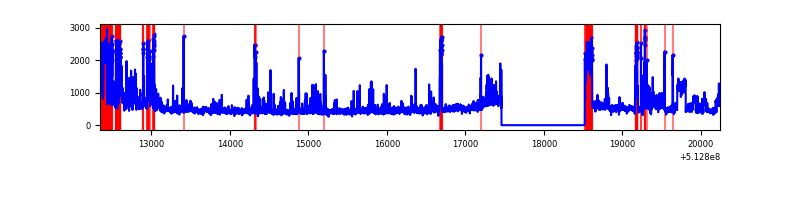 |
| C | 7897 | 6837 | 36 | 36 | 0.46% | 0.53% | 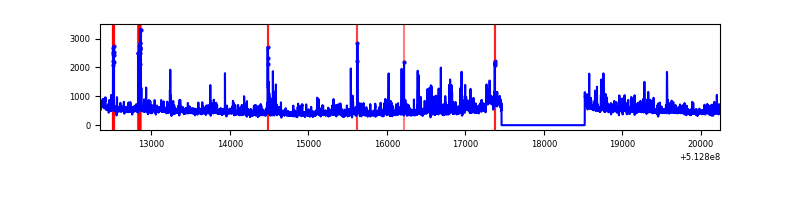 |
| D | 7897 | 6837 | 731 | 731 | 9.26% | 10.69% | 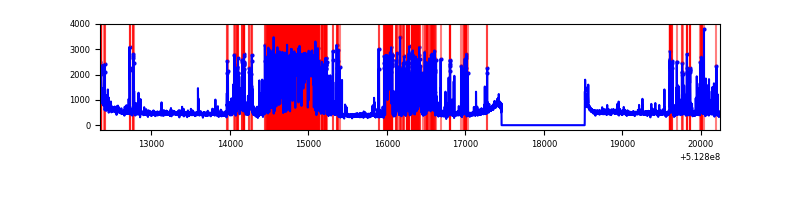 |
Top three noisy pixels from each quadrant. If the there are fewer than three noisy pixels in the level2.evt file, extra rows are filled as -1
| Pixel properties | Quadrant properties | ||||||
|---|---|---|---|---|---|---|---|
| Quadrant | DetID | PixID | Counts | Sigma | Mean | Median | Sigma |
| A | 7 | 64 | 654020 | 3467.7 | 771 | 752 | 188.4 |
| A | 10 | 251 | 96468 | 508.08 | 771 | 752 | 188.4 |
| A | 4 | 13 | 48648 | 254.24 | 771 | 752 | 188.4 |
| B | 10 | 16 | 554429 | 3515.15 | 730 | 703 | 157.5 |
| B | 5 | 185 | 529630 | 3357.72 | 730 | 703 | 157.5 |
| B | 0 | 197 | 78419 | 493.35 | 730 | 703 | 157.5 |
| C | 1 | 16 | 414914 | 2035.39 | 745 | 736 | 203.5 |
| C | 14 | 254 | 107873 | 526.5 | 745 | 736 | 203.5 |
| C | 6 | 223 | 82176 | 400.22 | 745 | 736 | 203.5 |
| D | 2 | 249 | 1904454 | 9330.05 | 723 | 690 | 204.0 |
| D | 8 | 240 | 548685 | 2685.64 | 723 | 690 | 204.0 |
| D | 2 | 31 | 102993 | 501.37 | 723 | 690 | 204.0 |
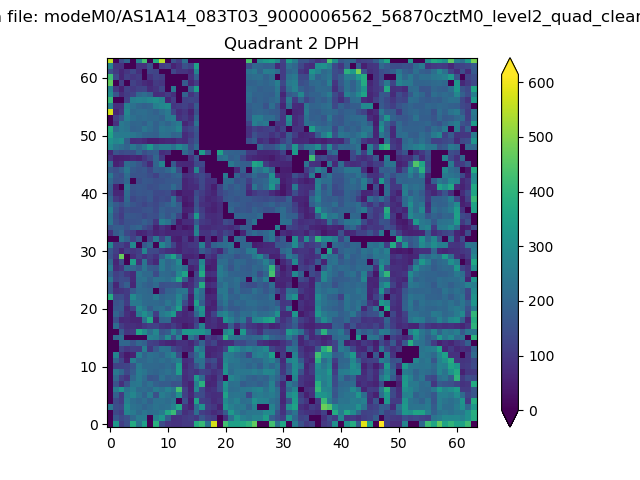
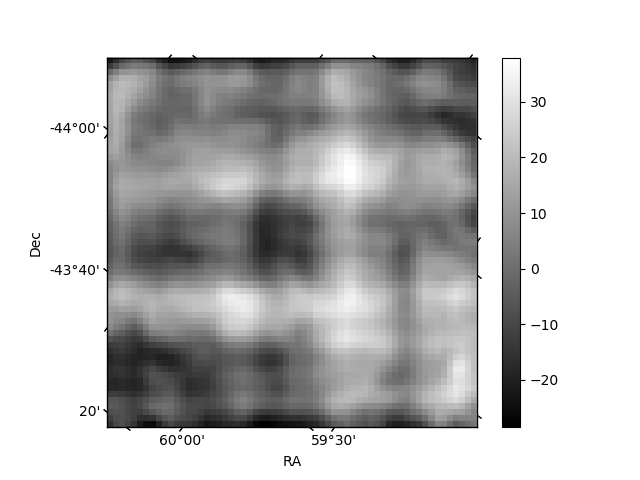
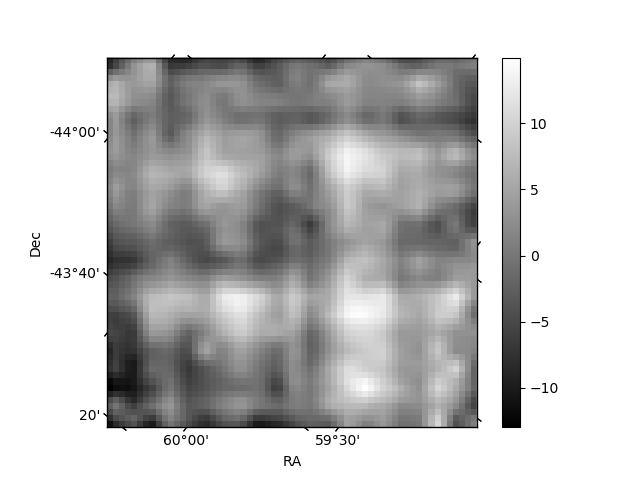
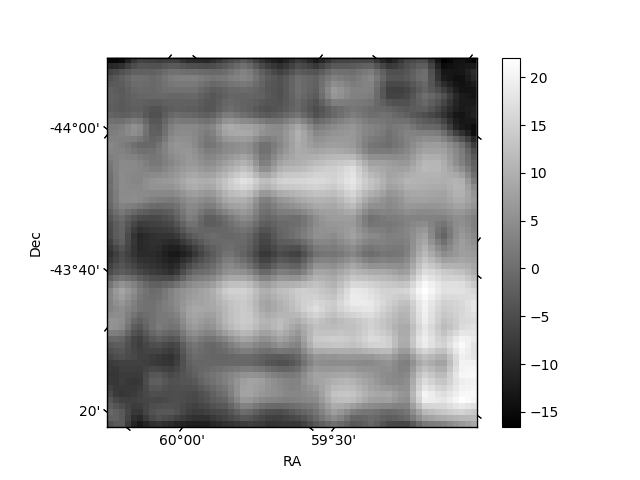
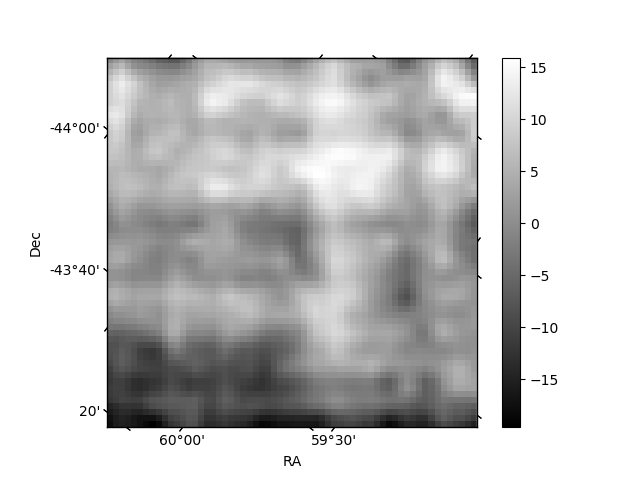
Histogram calculated using DETX and DETY for each event in the final _common_clean file
| Quadrant A | 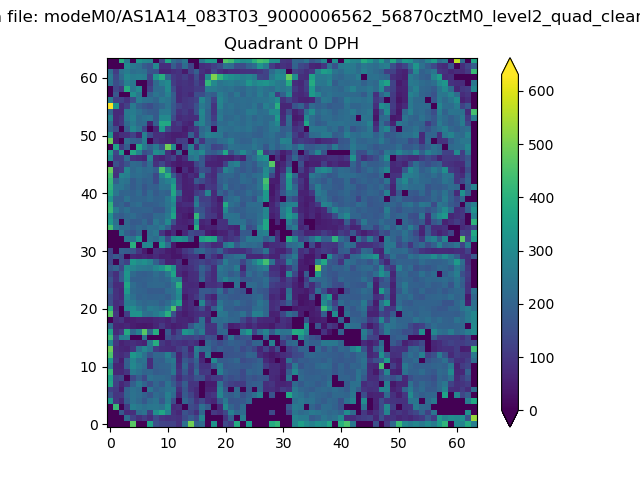 |
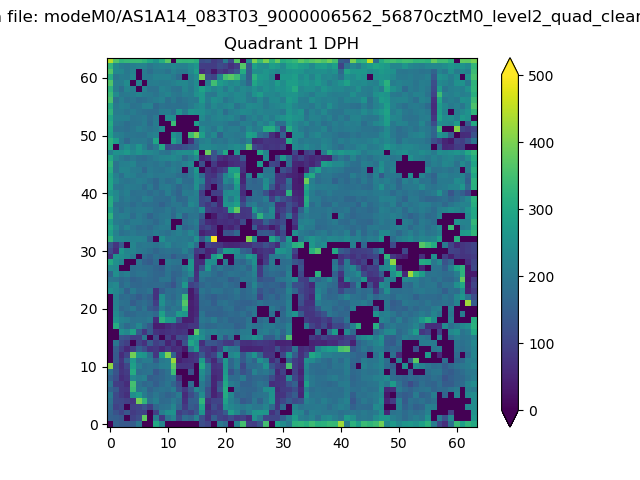 |
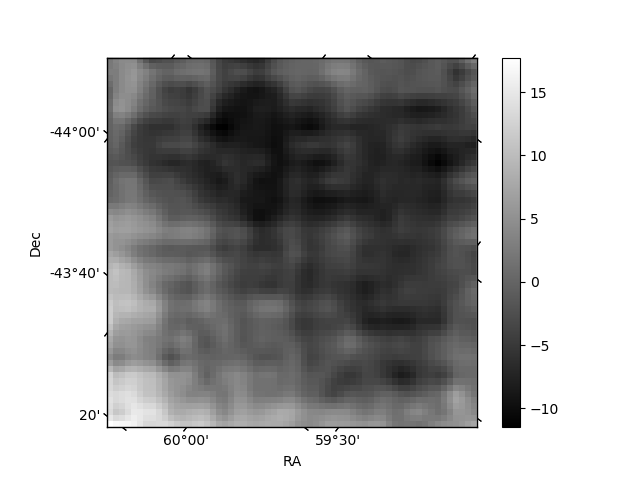
Quadrant B |
|---|---|---|---|
| Quadrant D | 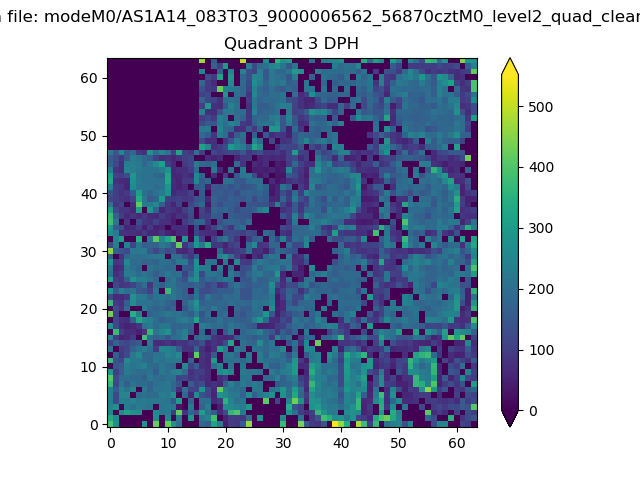 |
 |
Quadrant C |
| Plot type | Count rate plots | Images |
|---|---|---|
| Comparison with Poisson distribution Blue bars denote a histogram of data divided into 1 sec bins. Red curve is a Poisson curve with rate = median count rate of data. |
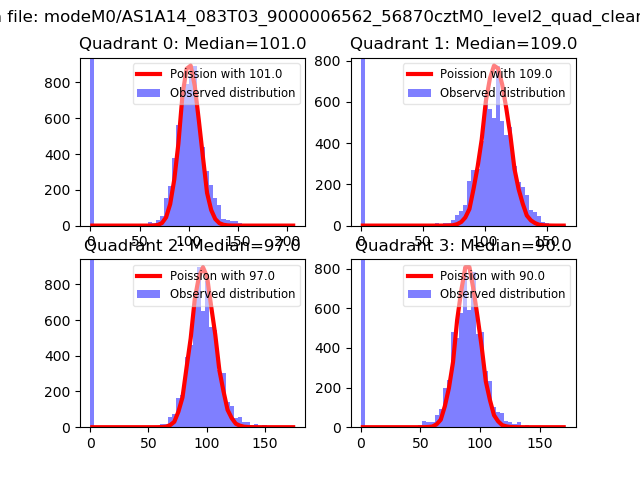 |
 |
| Quadrant-wise count rates Data is divided into 100 sec bins |
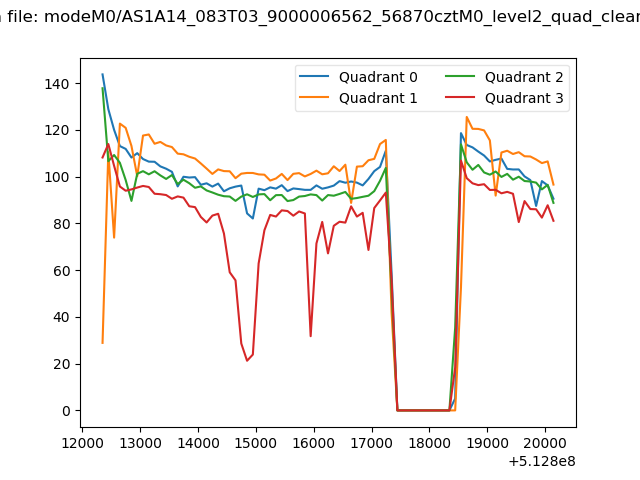 |
|
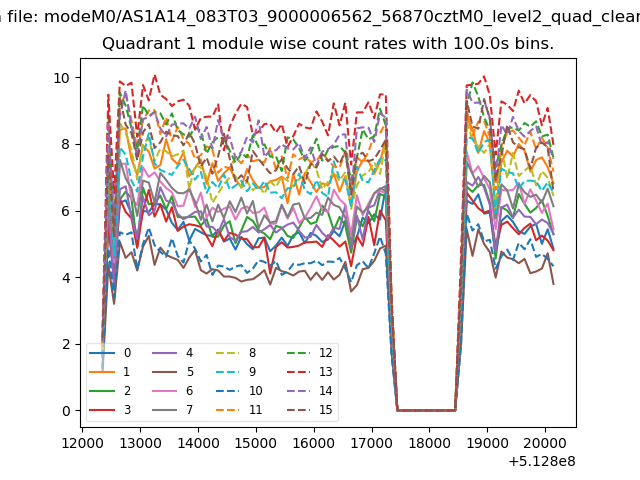
| Module-wise count rates for Quadrant A Data is divided into 100 sec bins |
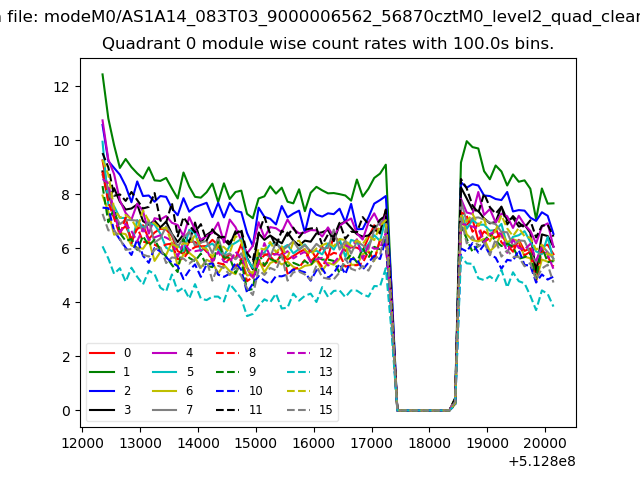 |
 |
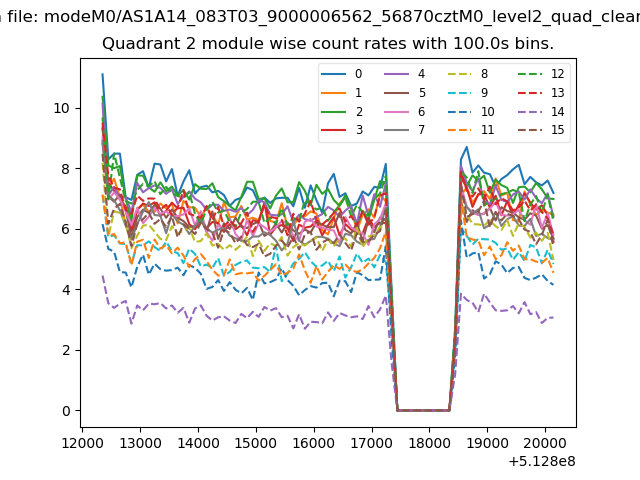
| Module-wise count rates for Quadrant B Data is divided into 100 sec bins |
 |
 |
| Module-wise count rates for Quadrant C Data is divided into 100 sec bins |
 |
 |
| Module-wise count rates for Quadrant D Data is divided into 100 sec bins |
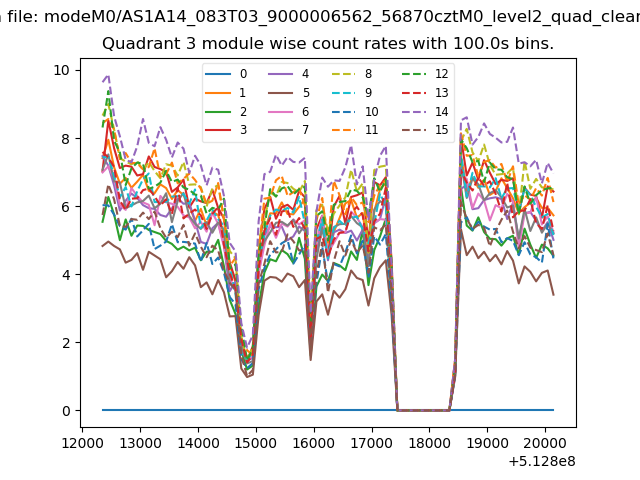 |
 |
| Parameter | Plot |
|---|---|
| CZT HV Monitor | 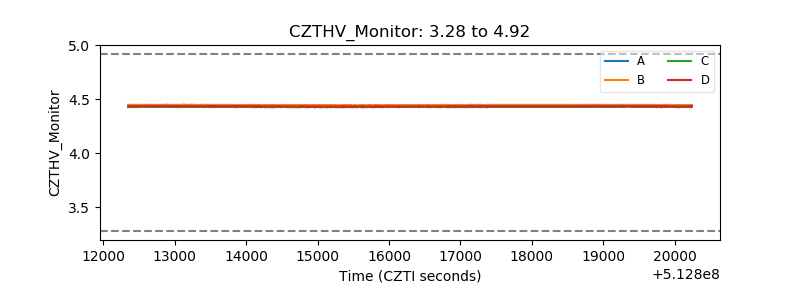 |
| D_VDD | 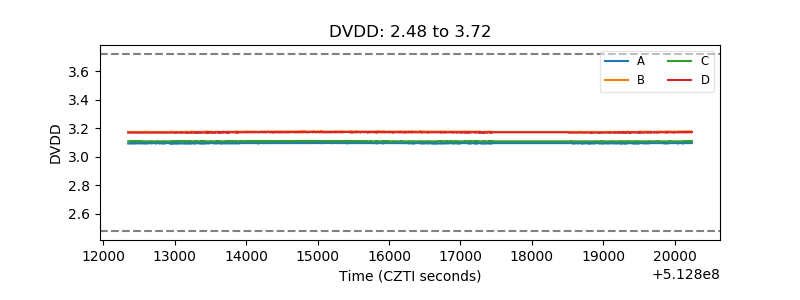 |
| Temperature 1 |  |
| Veto HV Monitor | 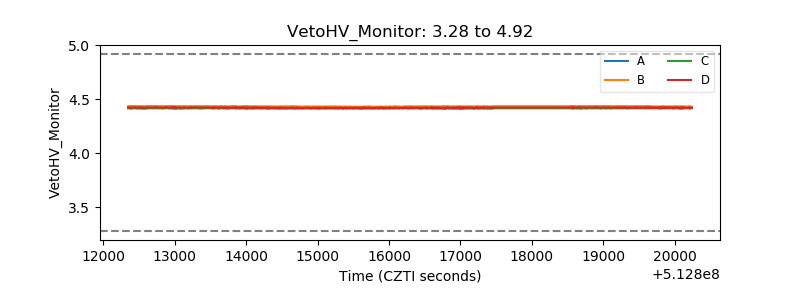 |
| Veto LLD | 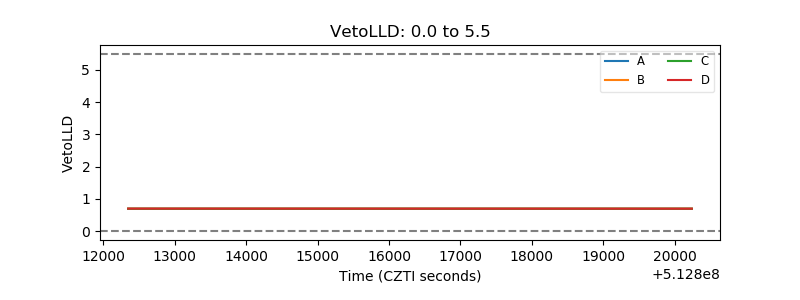 |
| Alpha Counter | 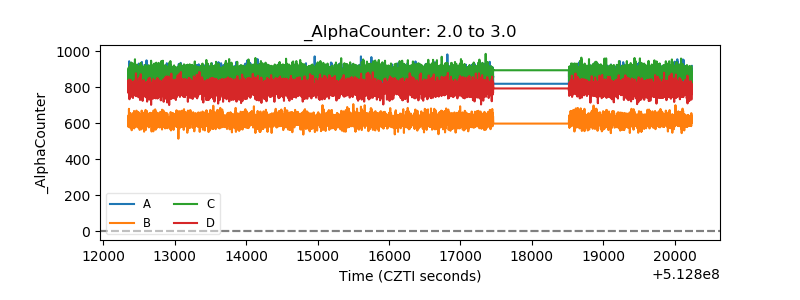 |
| _CPM_Rate | 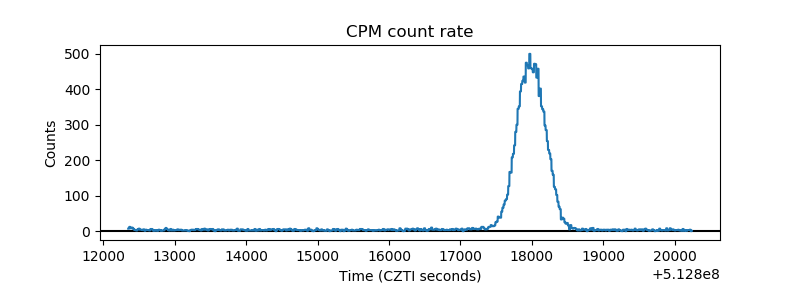 |
| CZT Counter | 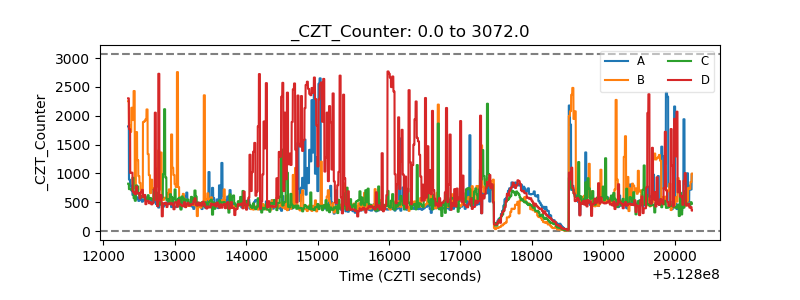 |
| +2.5 Volts monitor | 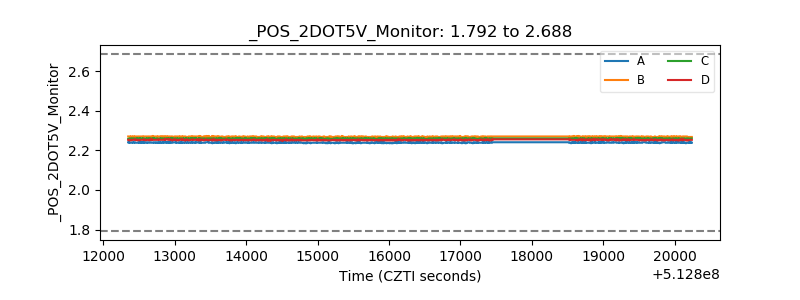 |
| +5 Volts monitor | 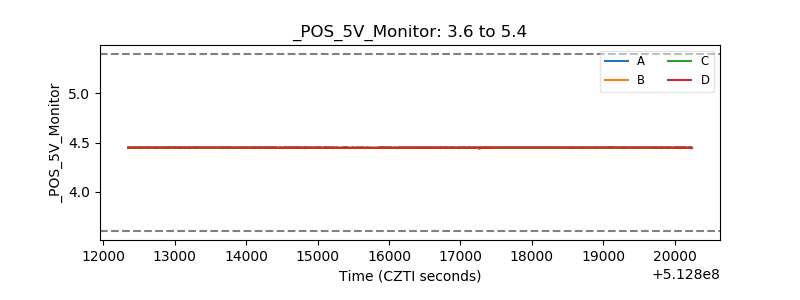 |
| _ROLL_ROT | 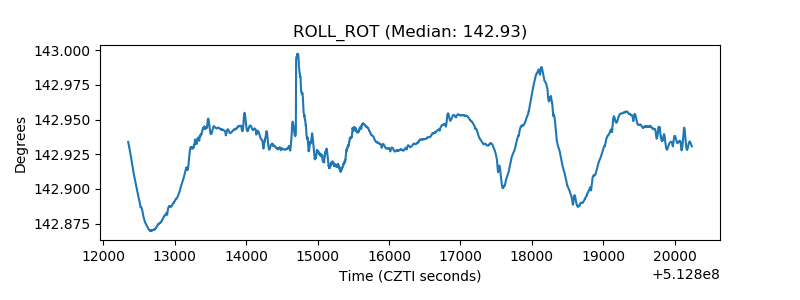 |
| _Roll_DEC | 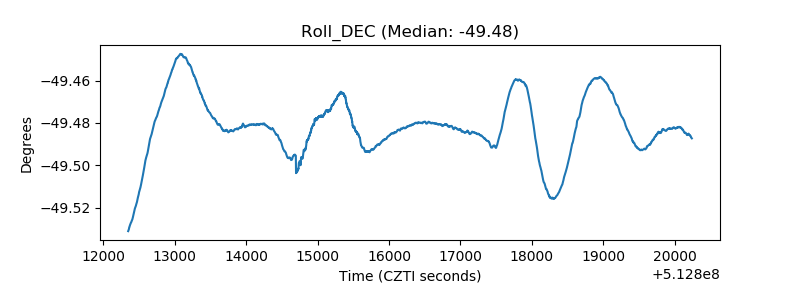 |
| _Roll_RA | 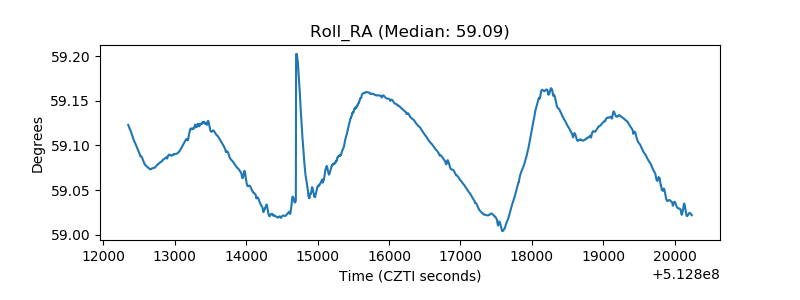 |
| Veto Counter | 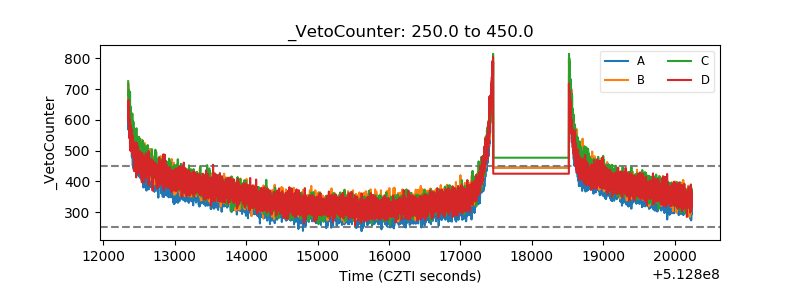 |