| Param | Original file | Final file |
|---|---|---|
| Filename | modeM0/AS1A14_083T03_9000006562_56872cztM0_level2.fits | modeM0/AS1A14_083T03_9000006562_56872cztM0_level2_quad_clean.evt |
| Size (bytes) | 557,706,240 | 92,332,800 |
| Size | 531.9 MB | 88.1 MB |
| Events in quadrant A | 2,903,817 | 645,692 |
| Events in quadrant B | 8,621,915 | 524,382 |
| Events in quadrant C | 4,581,745 | 583,880 |
| Events in quadrant D | 4,016,411 | 574,225 |
| Mode M9 | |||
|---|---|---|---|
| Quadrant | BADHDUFLAG | Total packets | Discarded packets |
| A | 0 | 8 | 0 |
| B | 0 | 8 | 0 |
| C | 0 | 8 | 0 |
| D | 0 | 8 | 0 |
| Mode SS | |||
|---|---|---|---|
| Quadrant | BADHDUFLAG | Total packets | Discarded packets |
| A | 0 | 138 | 0 |
| B | 0 | 138 | 0 |
| C | 0 | 138 | 0 |
| D | 0 | 138 | 0 |
| Mode M0 | |||
|---|---|---|---|
| Quadrant | BADHDUFLAG | Total packets | Discarded packets |
| A | 0 | 13784 | 2 |
| B | 0 | 30163 | 2 |
| C | 0 | 18503 | 2 |
| D | 0 | 16722 | 2 |
| Quadrant | Total seconds | Saturated seconds | Saturation percentage |
|---|---|---|---|
| A | 6700 | 70 | 1.044776% |
| B | 6700 | 1938 | 28.925373% |
| C | 6700 | 455 | 6.791045% |
| D | 6701 | 177 | 2.641397% |
Noise dominated data is calculated using 1-second bins in cleaned event files. If a bin has >2000 counts, and if more than 50% of those come from <1% of pixels, then it is considered to be noise-dominated and hence unusable.
| Quadrant | # 1 sec bins | Bins with >0 counts | Bins with >2000 counts | High rate bins dominated by noise | Noise dominated (total time) | Noise dominated (detector-on time) | Marked lightcurve |
|---|---|---|---|---|---|---|---|
| A | 7595 | 6700 | 2 | 2 | 0.03% | 0.03% | 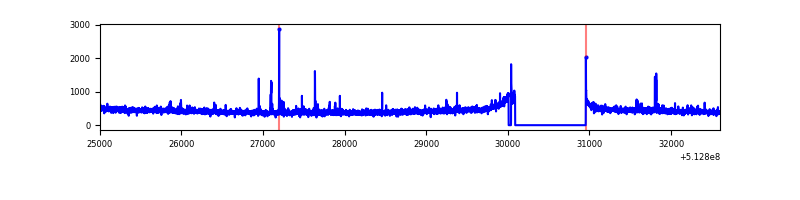 |
| B | 7594 | 6700 | 1662 | 1662 | 21.89% | 24.81% | 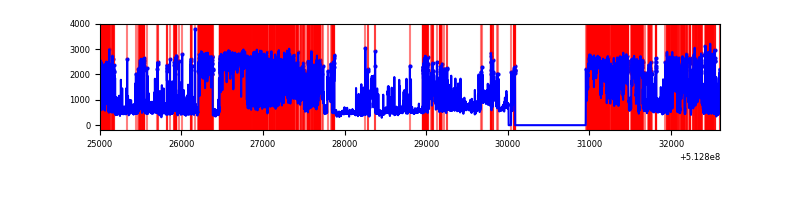 |
| C | 7595 | 6701 | 423 | 423 | 5.57% | 6.31% | 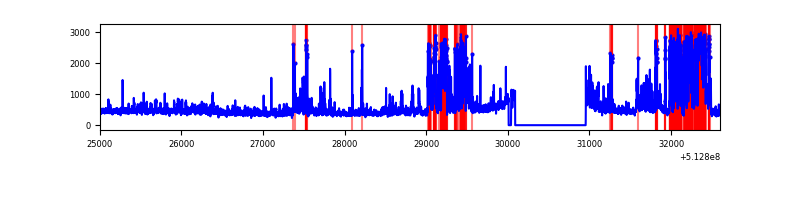 |
| D | 7596 | 6702 | 141 | 141 | 1.86% | 2.10% | 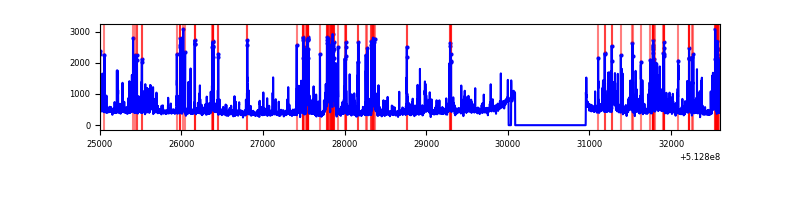 |
Top three noisy pixels from each quadrant. If the there are fewer than three noisy pixels in the level2.evt file, extra rows are filled as -1
| Pixel properties | Quadrant properties | ||||||
|---|---|---|---|---|---|---|---|
| Quadrant | DetID | PixID | Counts | Sigma | Mean | Median | Sigma |
| A | 7 | 64 | 26384 | 143.58 | 724 | 706 | 178.8 |
| A | 3 | 62 | 23624 | 128.14 | 724 | 706 | 178.8 |
| A | 4 | 13 | 16544 | 88.56 | 724 | 706 | 178.8 |
| B | 5 | 185 | 4538638 | 35068.87 | 602 | 580 | 129.4 |
| B | 10 | 16 | 1045296 | 8073.28 | 602 | 580 | 129.4 |
| B | 0 | 197 | 459059 | 3543.0 | 602 | 580 | 129.4 |
| C | 13 | 3 | 968526 | 5166.17 | 681 | 672 | 187.3 |
| C | 12 | 2 | 471205 | 2511.59 | 681 | 672 | 187.3 |
| C | 1 | 16 | 201478 | 1071.85 | 681 | 672 | 187.3 |
| D | 8 | 240 | 398974 | 2043.19 | 692 | 660 | 194.9 |
| D | 2 | 31 | 305219 | 1562.27 | 692 | 660 | 194.9 |
| D | 2 | 249 | 169060 | 863.82 | 692 | 660 | 194.9 |
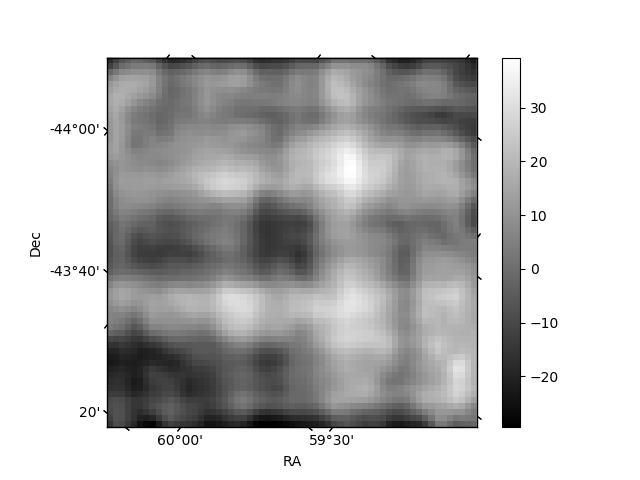
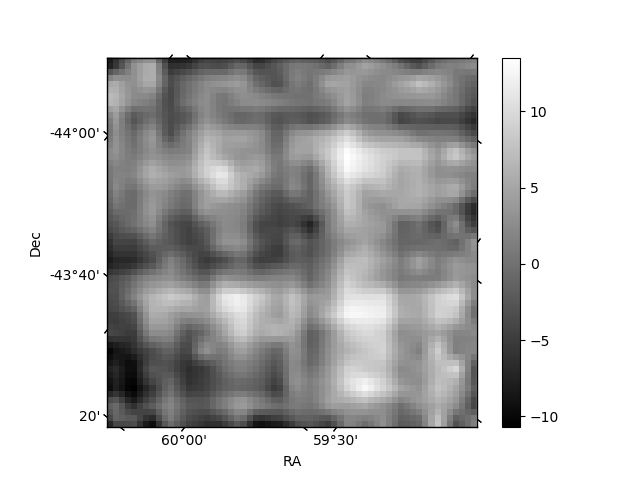
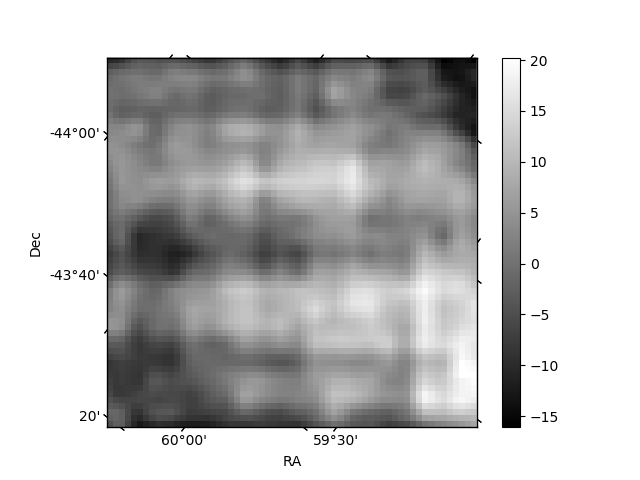
Histogram calculated using DETX and DETY for each event in the final _common_clean file
| Quadrant A | 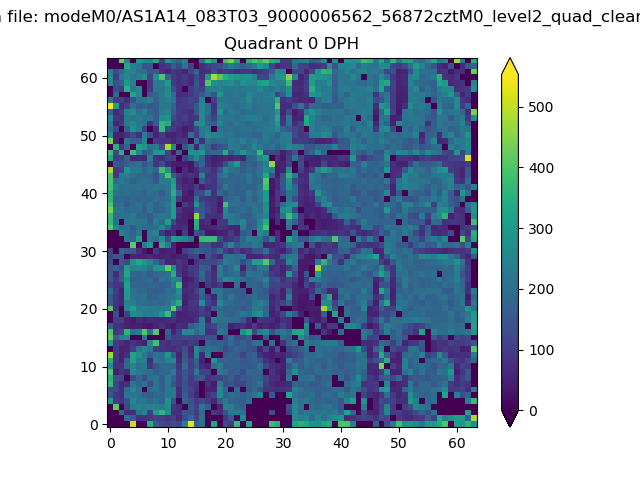 |
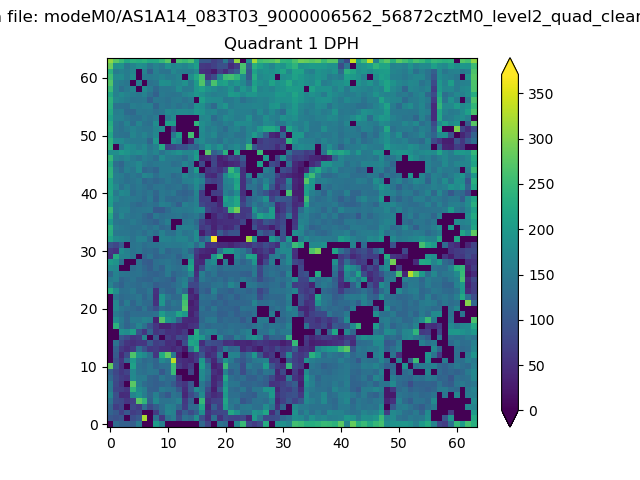 |
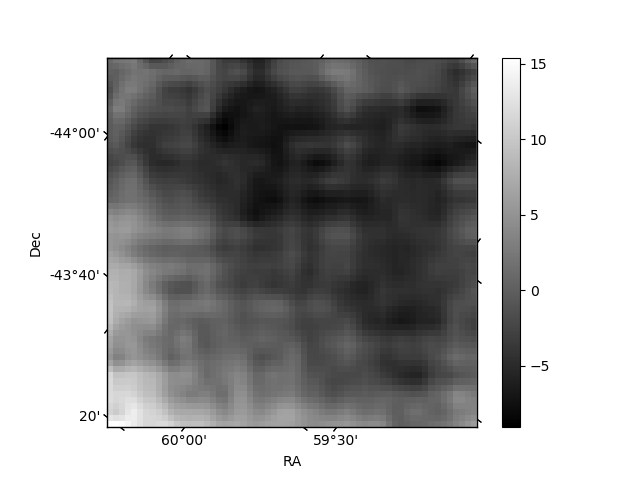
Quadrant B |
|---|---|---|---|
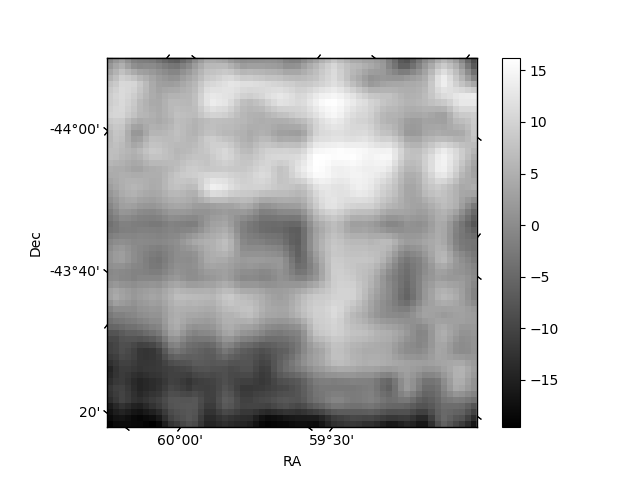
| Quadrant D | 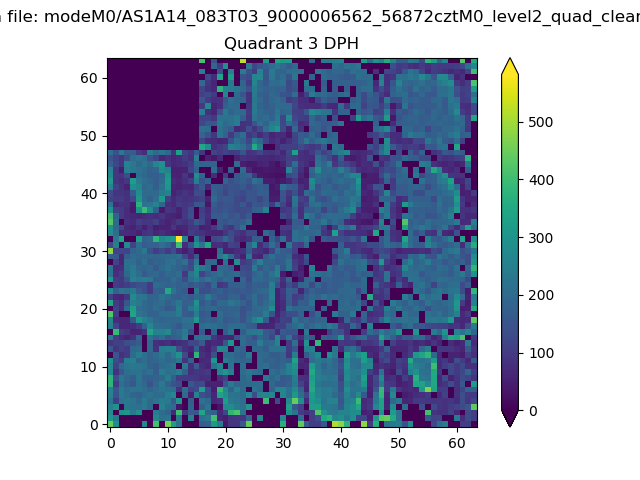 |
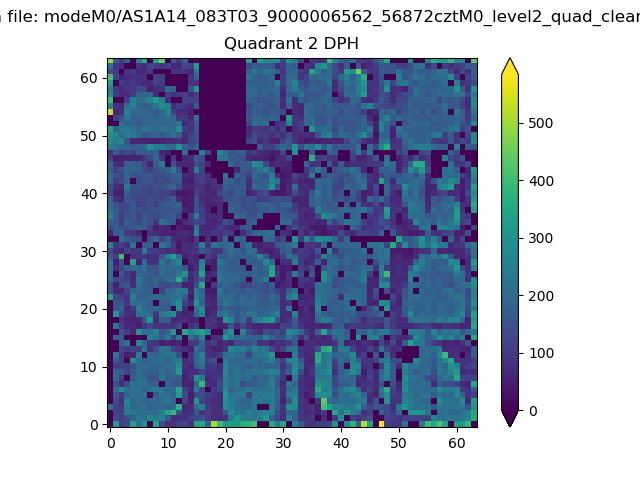 |
Quadrant C |
| Plot type | Count rate plots | Images |
|---|---|---|
| Comparison with Poisson distribution Blue bars denote a histogram of data divided into 1 sec bins. Red curve is a Poisson curve with rate = median count rate of data. |
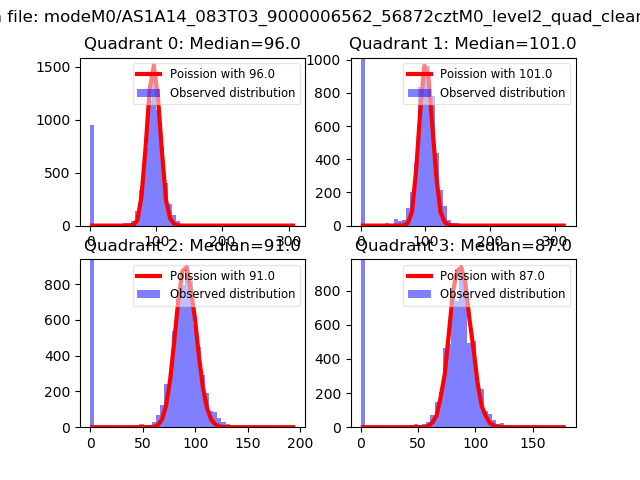 |
 |
| Quadrant-wise count rates Data is divided into 100 sec bins |
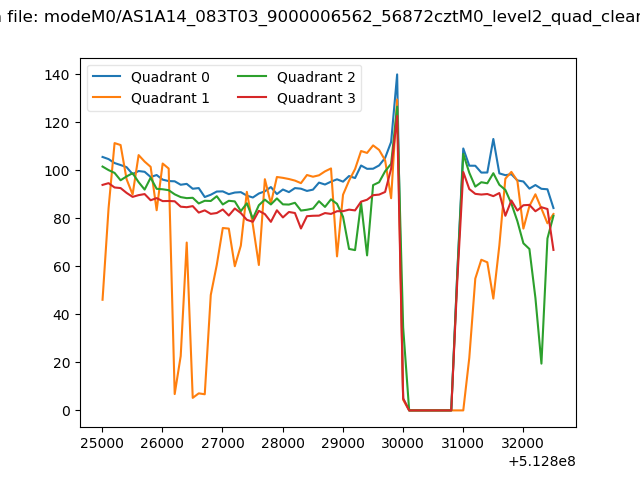 |
|
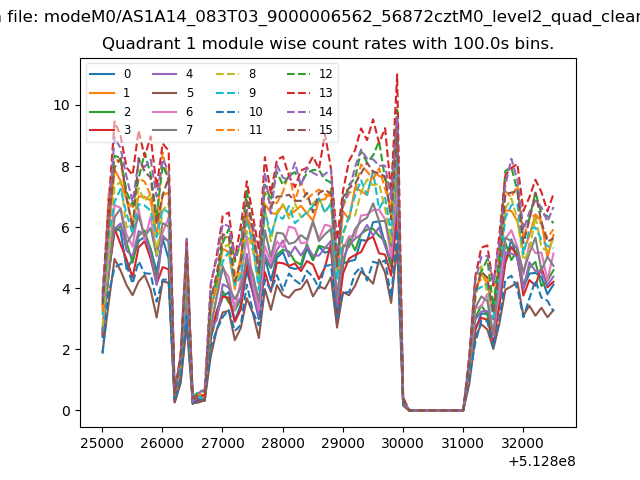
| Module-wise count rates for Quadrant A Data is divided into 100 sec bins |
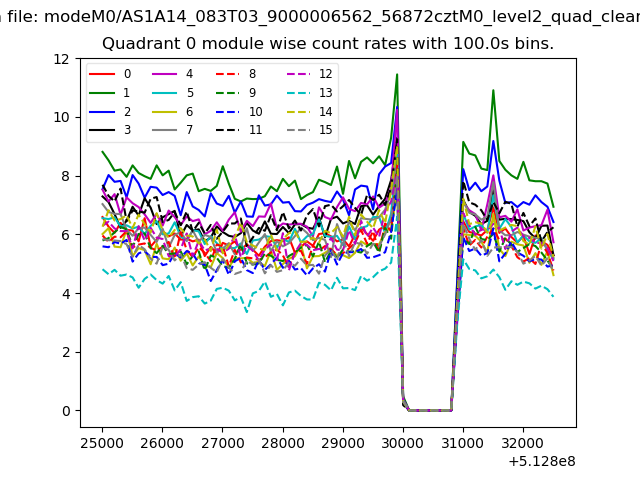 |
 |
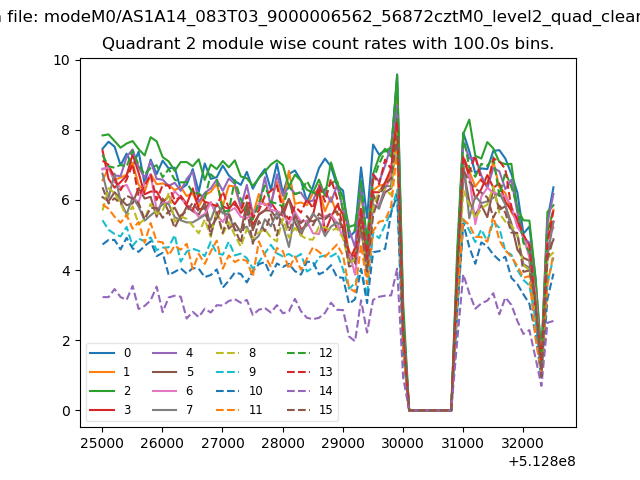
| Module-wise count rates for Quadrant B Data is divided into 100 sec bins |
 |
 |
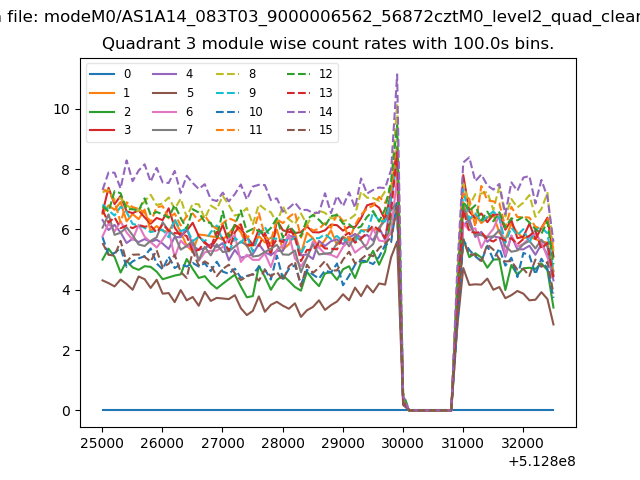
| Module-wise count rates for Quadrant C Data is divided into 100 sec bins |
 |
 |
| Module-wise count rates for Quadrant D Data is divided into 100 sec bins |
 |
 |
| Parameter | Plot |
|---|---|
| CZT HV Monitor | 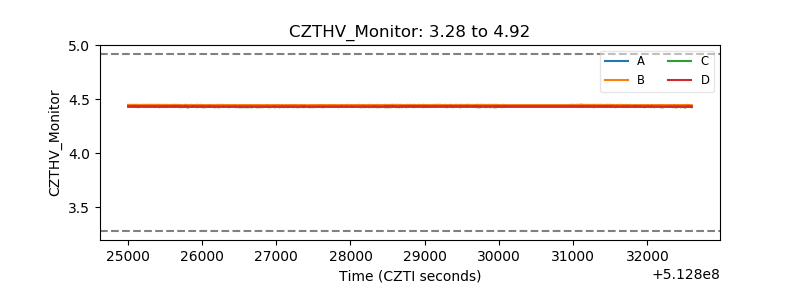 |
| D_VDD | 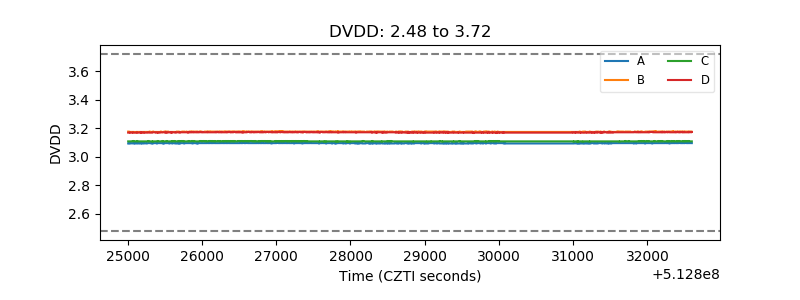 |
| Temperature 1 | 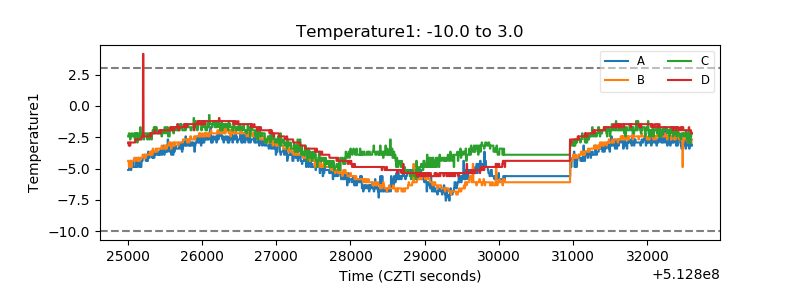 |
| Veto HV Monitor | 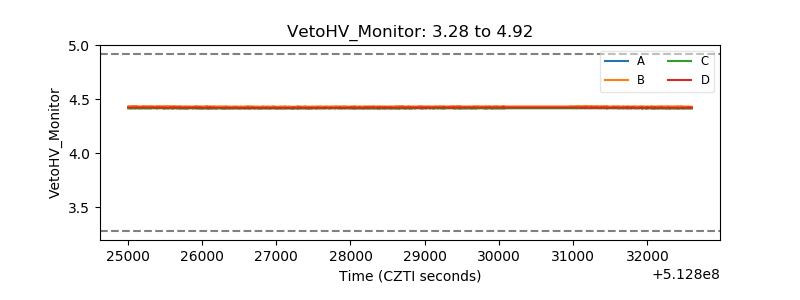 |
| Veto LLD | 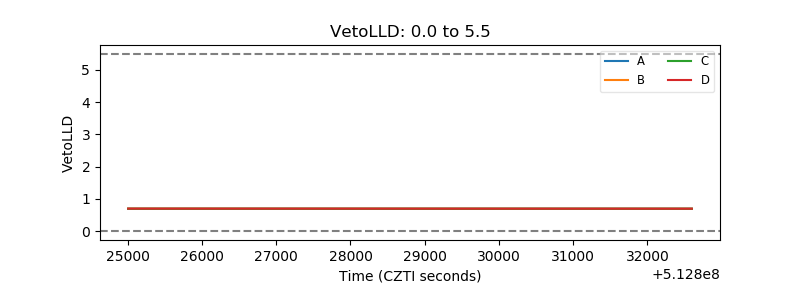 |
| Alpha Counter | 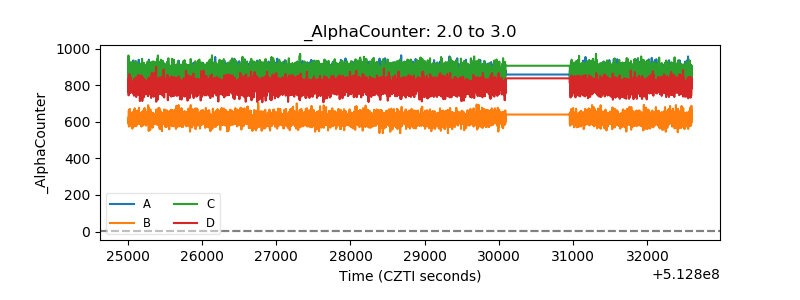 |
| _CPM_Rate | 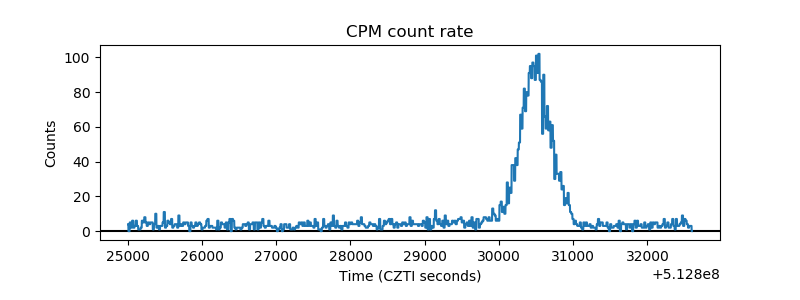 |
| CZT Counter | 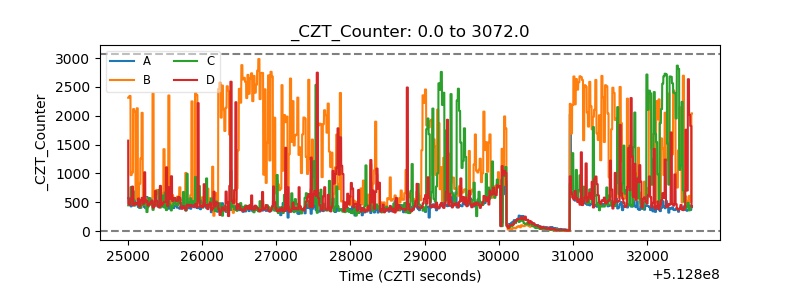 |
| +2.5 Volts monitor | 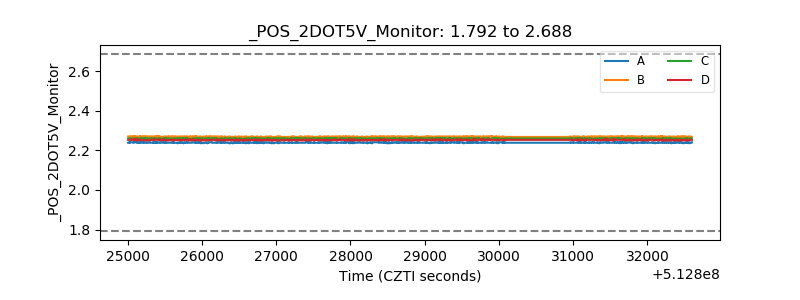 |
| +5 Volts monitor | 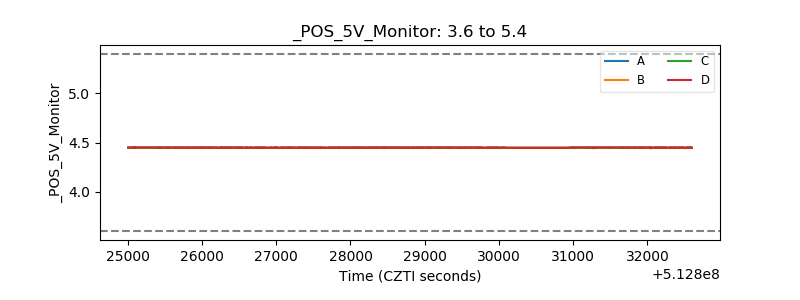 |
| _ROLL_ROT | 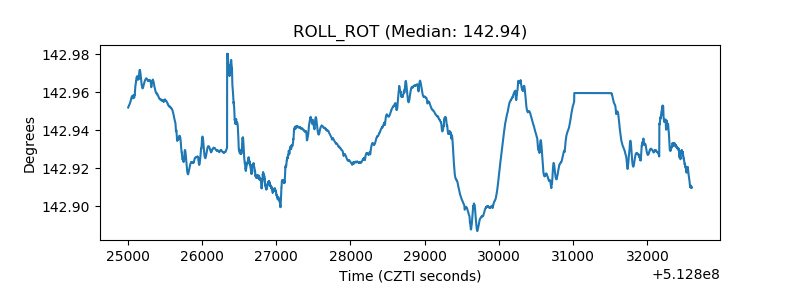 |
| _Roll_DEC | 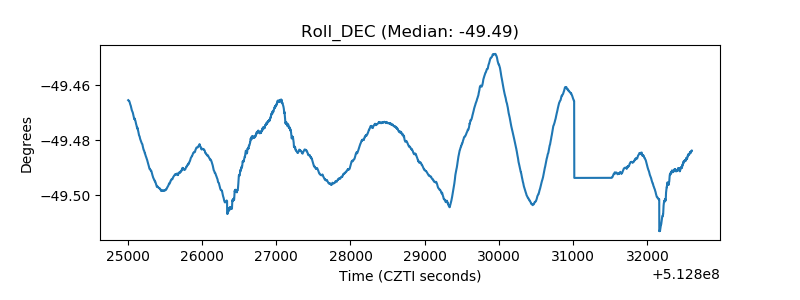 |
| _Roll_RA | 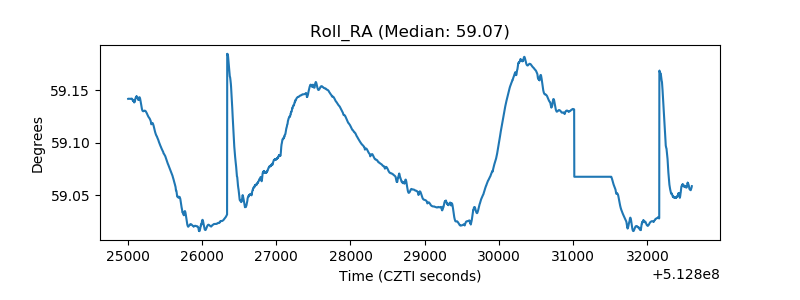 |
| Veto Counter | 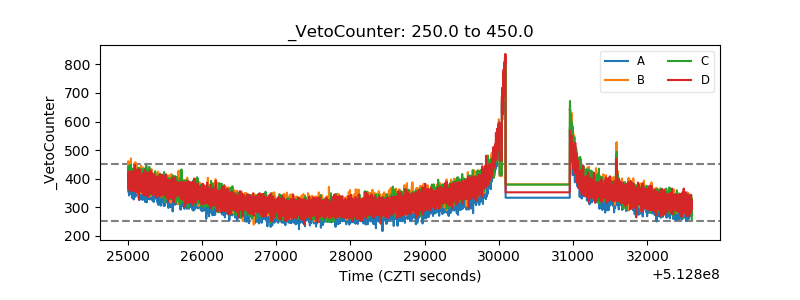 |