| Param | Original file | Final file |
|---|---|---|
| Filename | modeM0/AS1A14_083T03_9000006562_56873cztM0_level2.fits | modeM0/AS1A14_083T03_9000006562_56873cztM0_level2_quad_clean.evt |
| Size (bytes) | 463,484,160 | 102,242,880 |
| Size | 442.0 MB | 97.5 MB |
| Events in quadrant A | 3,270,097 | 692,342 |
| Events in quadrant B | 5,199,765 | 663,754 |
| Events in quadrant C | 4,161,856 | 633,302 |
| Events in quadrant D | 3,990,869 | 628,352 |
| Mode M9 | |||
|---|---|---|---|
| Quadrant | BADHDUFLAG | Total packets | Discarded packets |
| A | 0 | 5 | 0 |
| B | 0 | 5 | 0 |
| C | 0 | 5 | 0 |
| D | 0 | 5 | 0 |
| Mode SS | |||
|---|---|---|---|
| Quadrant | BADHDUFLAG | Total packets | Discarded packets |
| A | 0 | 138 | 0 |
| B | 0 | 138 | 0 |
| C | 0 | 138 | 0 |
| D | 0 | 138 | 0 |
| Mode M0 | |||
|---|---|---|---|
| Quadrant | BADHDUFLAG | Total packets | Discarded packets |
| A | 0 | 15108 | 1 |
| B | 0 | 20133 | 1 |
| C | 0 | 17424 | 2 |
| D | 0 | 16956 | 1 |
| Quadrant | Total seconds | Saturated seconds | Saturation percentage |
|---|---|---|---|
| A | 6867 | 70 | 1.019368% |
| B | 6867 | 701 | 10.208242% |
| C | 6867 | 282 | 4.106597% |
| D | 6867 | 164 | 2.388234% |
Noise dominated data is calculated using 1-second bins in cleaned event files. If a bin has >2000 counts, and if more than 50% of those come from <1% of pixels, then it is considered to be noise-dominated and hence unusable.
| Quadrant | # 1 sec bins | Bins with >0 counts | Bins with >2000 counts | High rate bins dominated by noise | Noise dominated (total time) | Noise dominated (detector-on time) | Marked lightcurve |
|---|---|---|---|---|---|---|---|
| A | 7317 | 6867 | 7 | 7 | 0.10% | 0.10% | 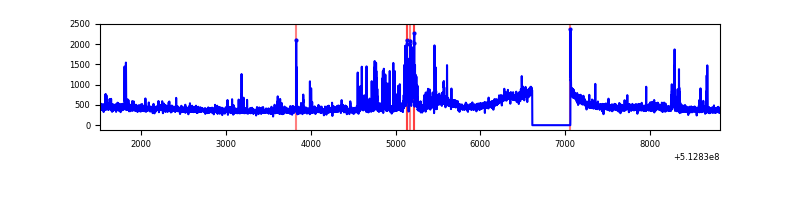 |
| B | 7317 | 6867 | 571 | 571 | 7.80% | 8.32% | 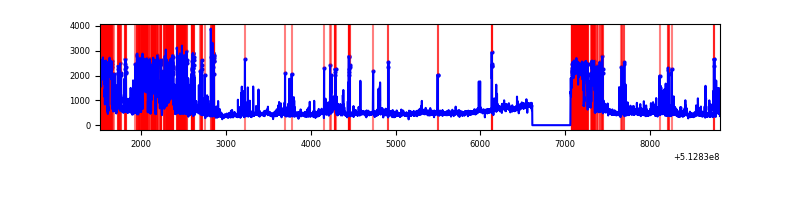 |
| C | 7317 | 6868 | 293 | 293 | 4.00% | 4.27% | 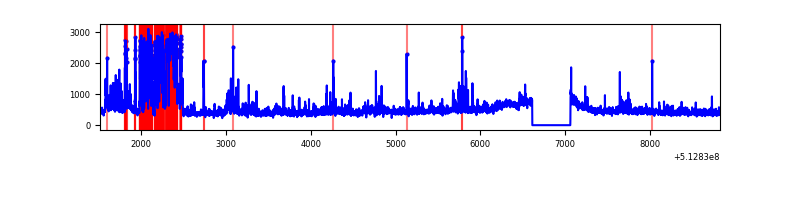 |
| D | 7317 | 6868 | 167 | 167 | 2.28% | 2.43% | 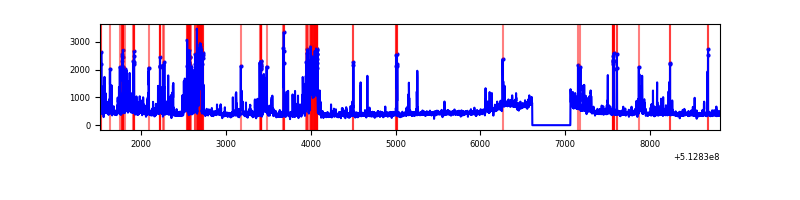 |
Top three noisy pixels from each quadrant. If the there are fewer than three noisy pixels in the level2.evt file, extra rows are filled as -1
| Pixel properties | Quadrant properties | ||||||
|---|---|---|---|---|---|---|---|
| Quadrant | DetID | PixID | Counts | Sigma | Mean | Median | Sigma |
| A | 3 | 14 | 262911 | 1410.24 | 749 | 731 | 185.9 |
| A | 4 | 13 | 32905 | 173.06 | 749 | 731 | 185.9 |
| A | 10 | 251 | 20126 | 104.32 | 749 | 731 | 185.9 |
| B | 5 | 185 | 1478055 | 9941.41 | 687 | 664 | 148.6 |
| B | 10 | 16 | 611698 | 4111.67 | 687 | 664 | 148.6 |
| B | 0 | 197 | 216893 | 1455.01 | 687 | 664 | 148.6 |
| C | 13 | 3 | 1013719 | 5159.7 | 707 | 700 | 196.3 |
| C | 1 | 16 | 133038 | 674.05 | 707 | 700 | 196.3 |
| C | 14 | 254 | 80875 | 408.36 | 707 | 700 | 196.3 |
| D | 8 | 240 | 394304 | 1898.68 | 719 | 685 | 207.3 |
| D | 2 | 249 | 273472 | 1315.83 | 719 | 685 | 207.3 |
| D | 2 | 31 | 232993 | 1120.57 | 719 | 685 | 207.3 |
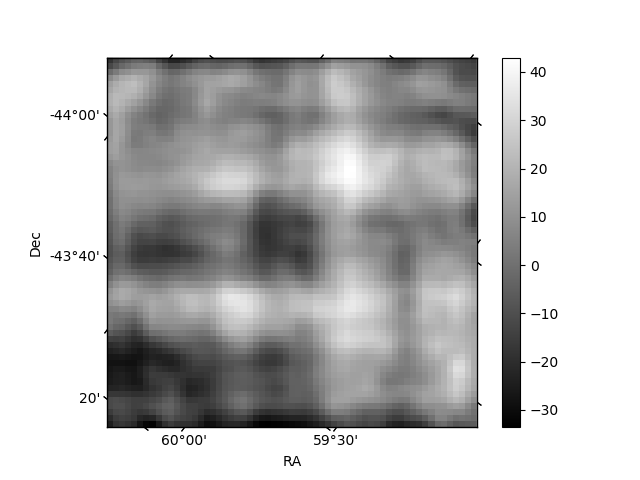
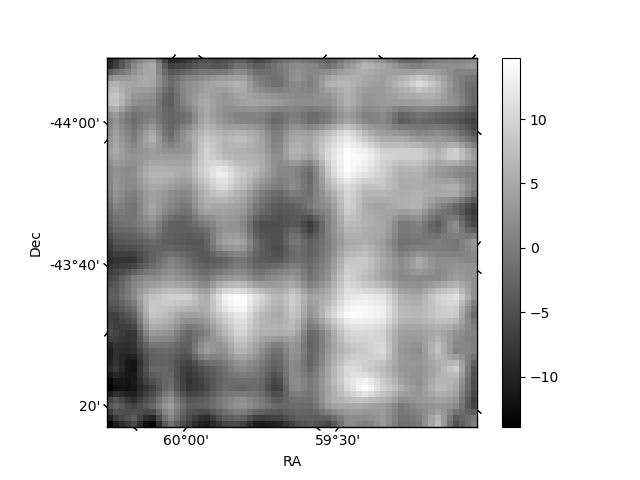
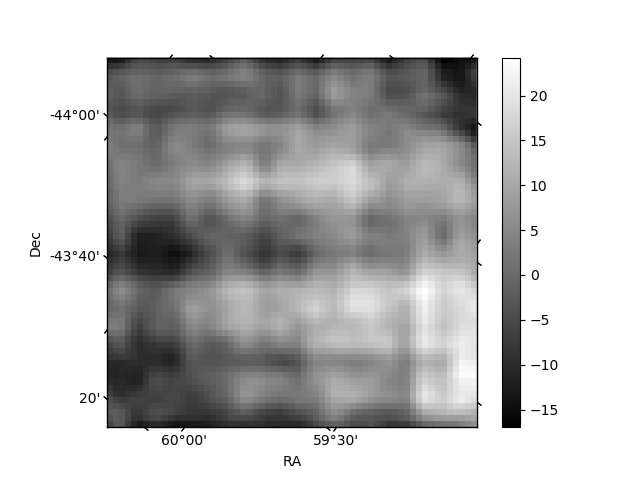
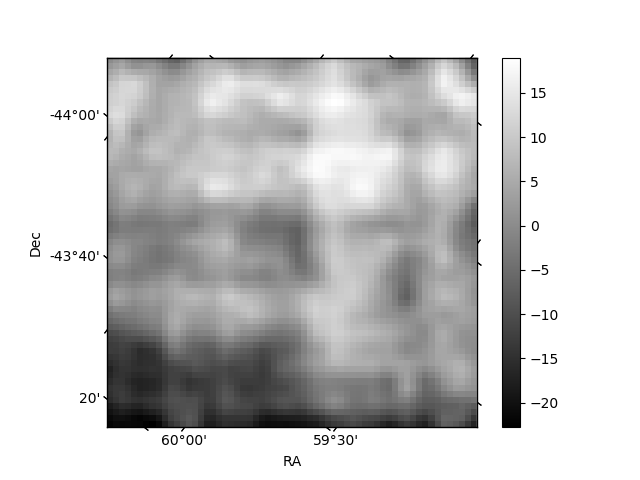
Histogram calculated using DETX and DETY for each event in the final _common_clean file
| Quadrant A | 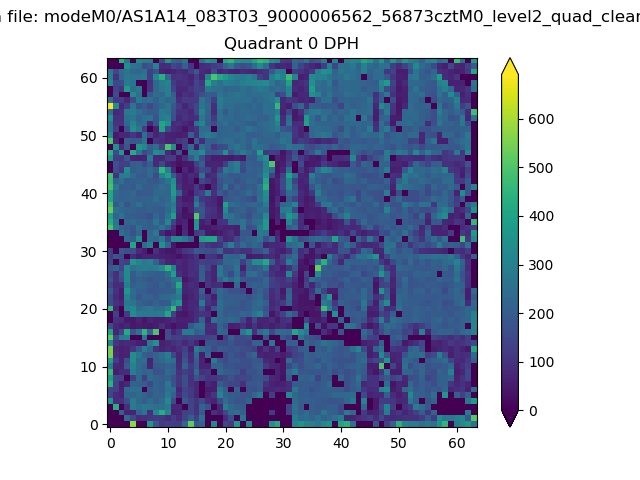 |
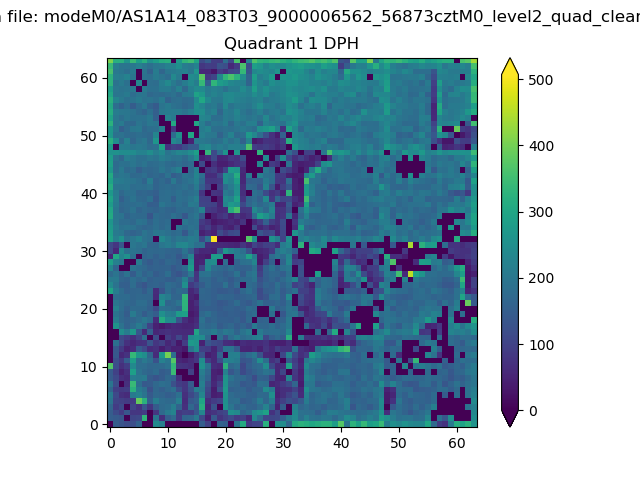 |
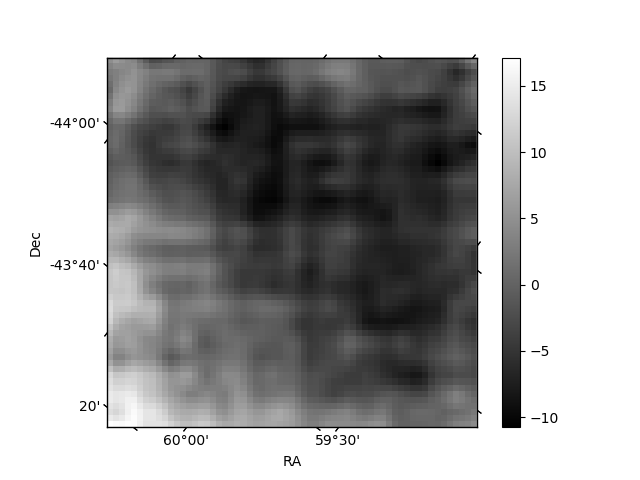
Quadrant B |
|---|---|---|---|
| Quadrant D | 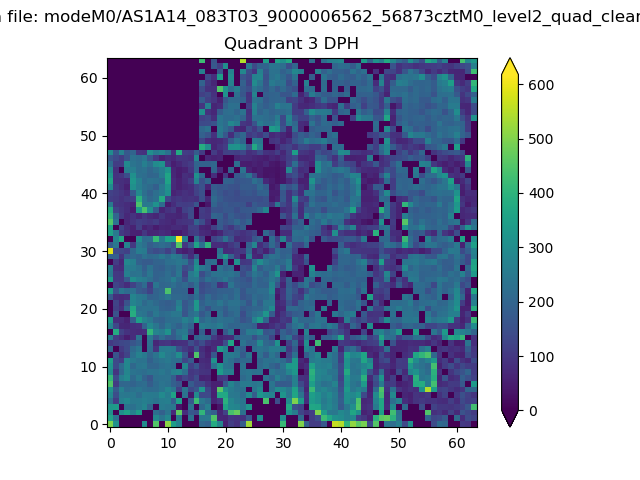 |
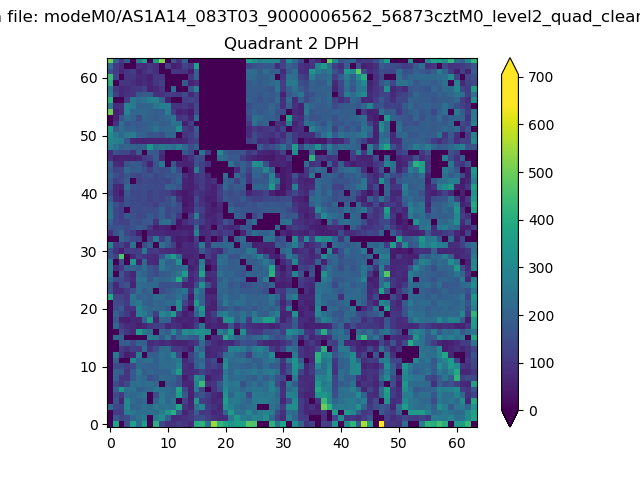 |
Quadrant C |
| Plot type | Count rate plots | Images |
|---|---|---|
| Comparison with Poisson distribution Blue bars denote a histogram of data divided into 1 sec bins. Red curve is a Poisson curve with rate = median count rate of data. |
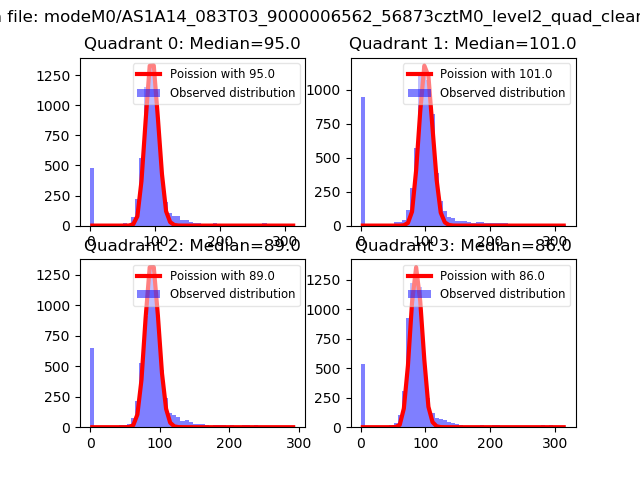 |
 |
| Quadrant-wise count rates Data is divided into 100 sec bins |
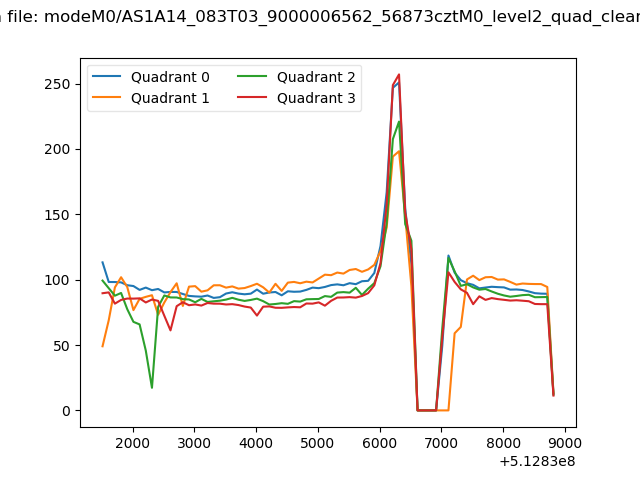 |
|
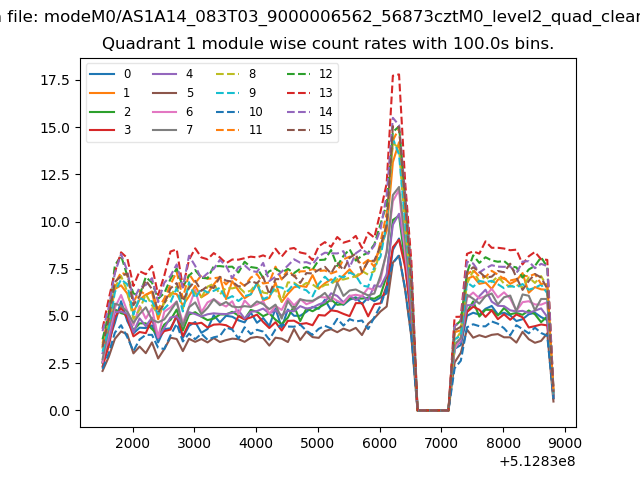
| Module-wise count rates for Quadrant A Data is divided into 100 sec bins |
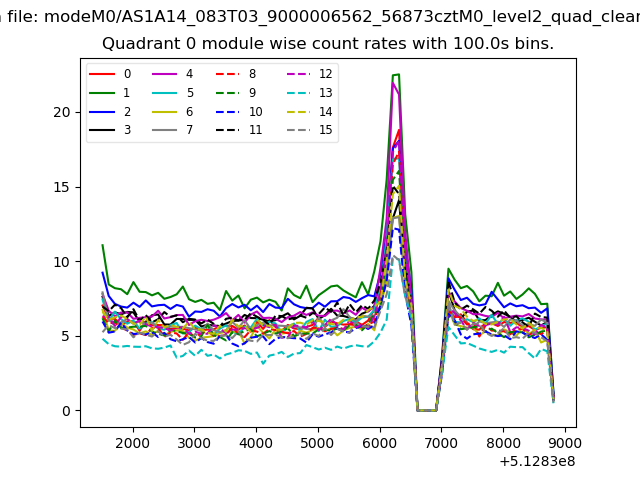 |
 |
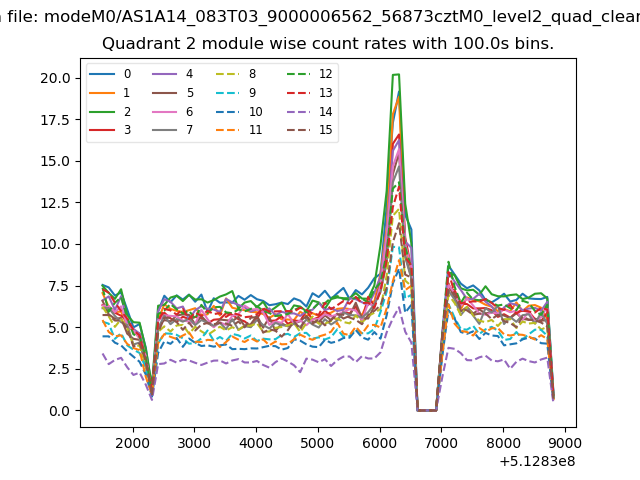
| Module-wise count rates for Quadrant B Data is divided into 100 sec bins |
 |
 |
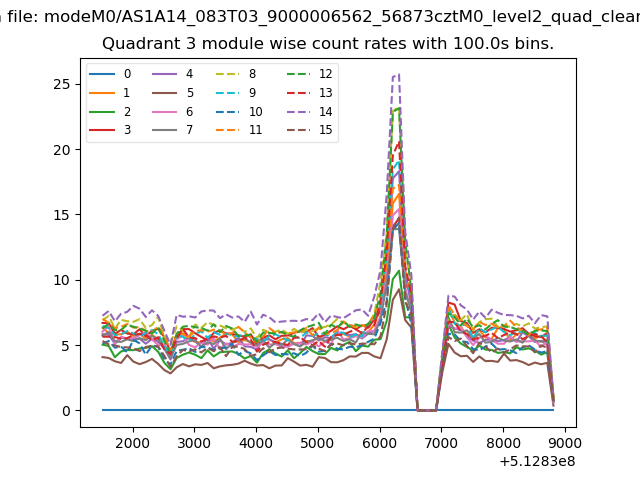
| Module-wise count rates for Quadrant C Data is divided into 100 sec bins |
 |
 |
| Module-wise count rates for Quadrant D Data is divided into 100 sec bins |
 |
 |
| Parameter | Plot |
|---|---|
| CZT HV Monitor | 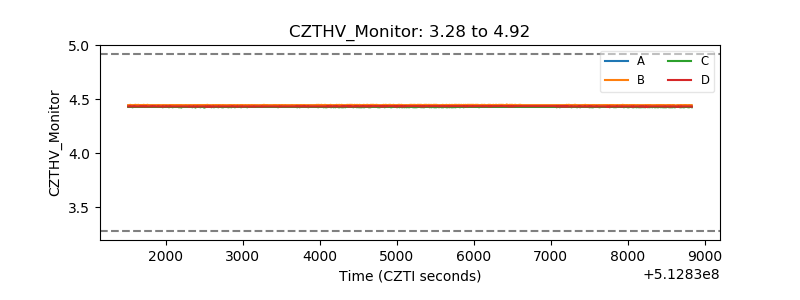 |
| D_VDD | 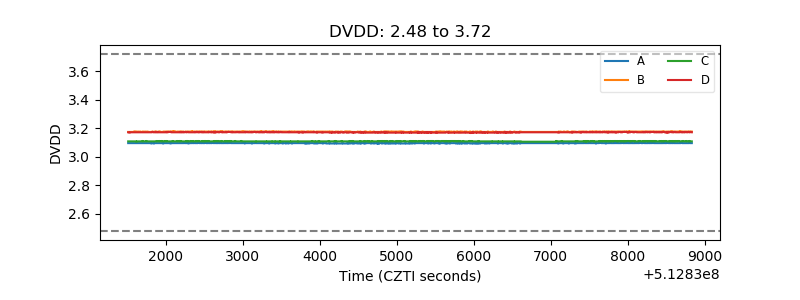 |
| Temperature 1 | 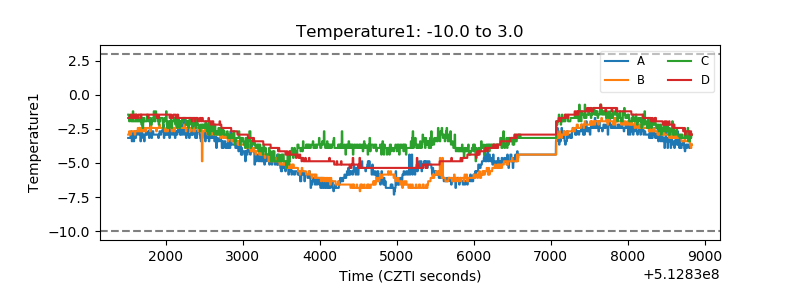 |
| Veto HV Monitor | 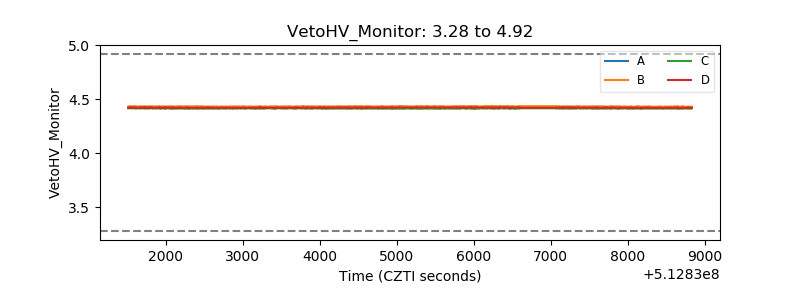 |
| Veto LLD | 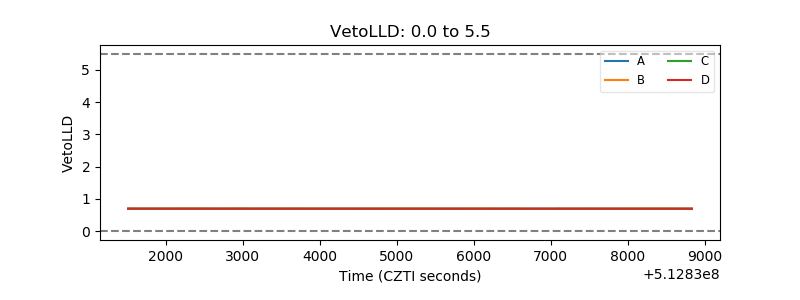 |
| Alpha Counter | 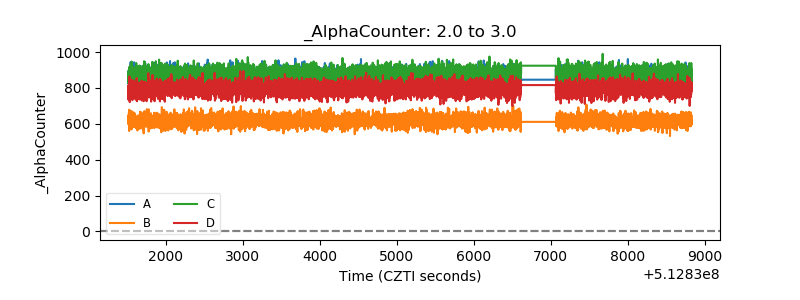 |
| _CPM_Rate | 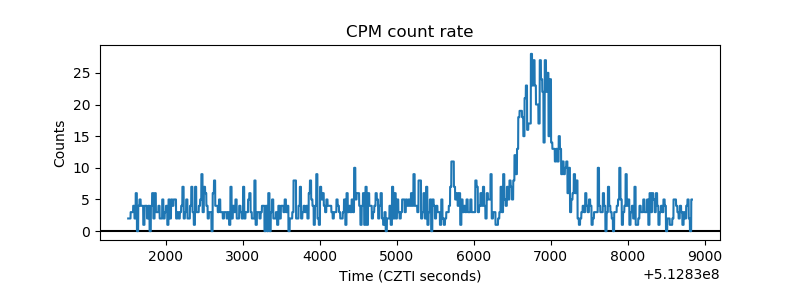 |
| CZT Counter | 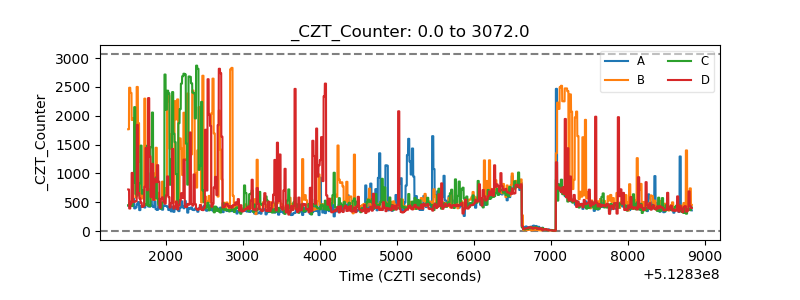 |
| +2.5 Volts monitor | 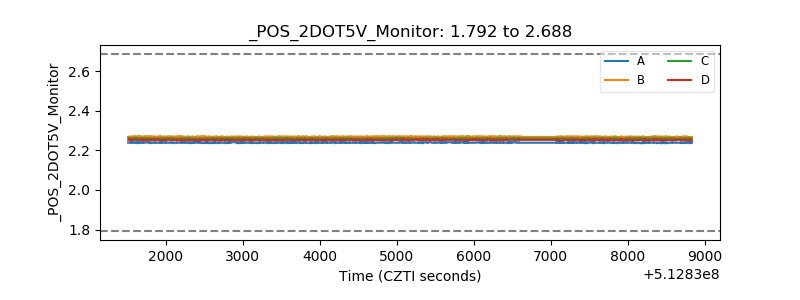 |
| +5 Volts monitor | 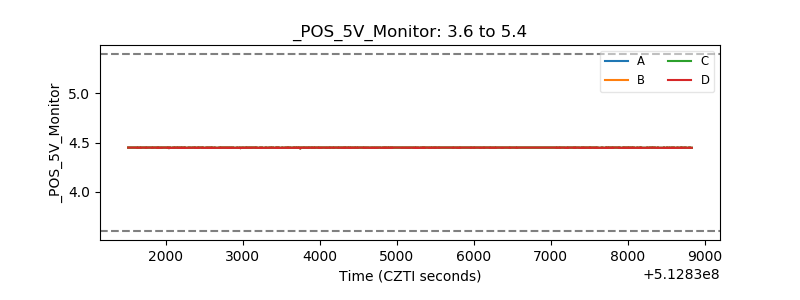 |
| _ROLL_ROT | 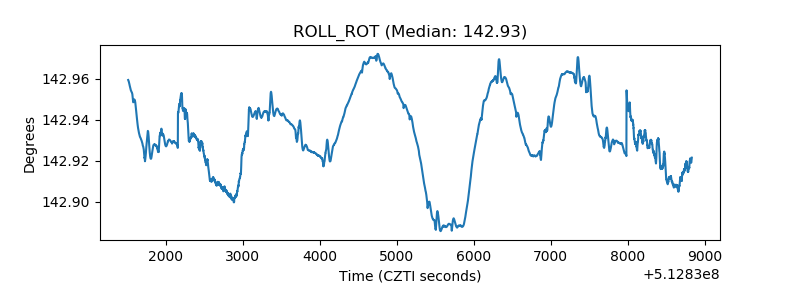 |
| _Roll_DEC | 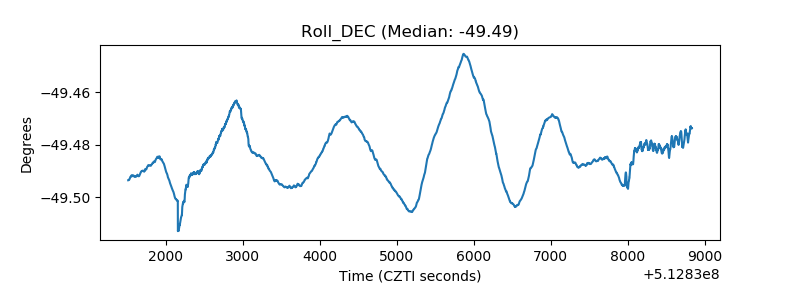 |
| _Roll_RA | 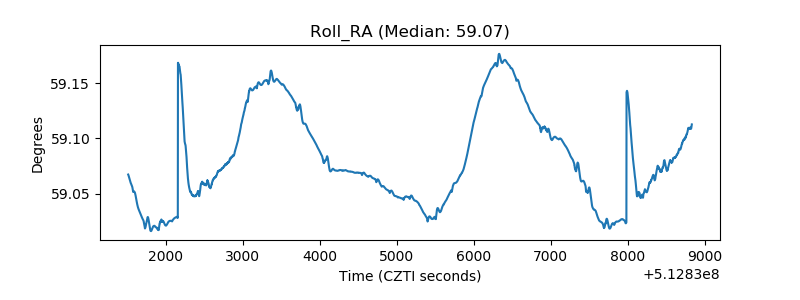 |
| Veto Counter | 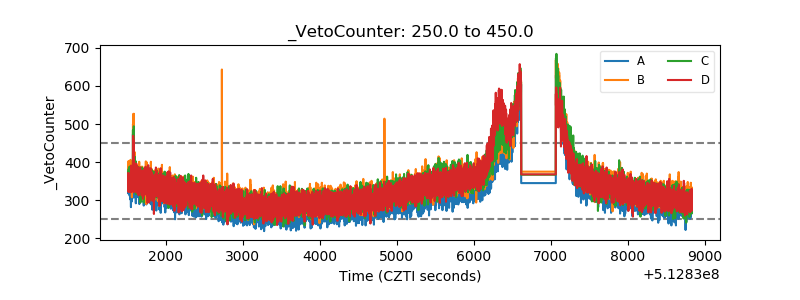 |