| Param | Original file | Final file |
|---|---|---|
| Filename | modeM0/AS1A14_083T03_9000006562_56876cztM0_level2.fits | modeM0/AS1A14_083T03_9000006562_56876cztM0_level2_quad_clean.evt |
| Size (bytes) | 736,032,960 | 98,760,960 |
| Size | 701.9 MB | 94.2 MB |
| Events in quadrant A | 8,800,678 | 564,065 |
| Events in quadrant B | 6,695,178 | 651,440 |
| Events in quadrant C | 4,041,011 | 669,281 |
| Events in quadrant D | 7,118,191 | 575,127 |
| Mode SS | |||
|---|---|---|---|
| Quadrant | BADHDUFLAG | Total packets | Discarded packets |
| A | 0 | 152 | 0 |
| B | 0 | 152 | 0 |
| C | 0 | 152 | 0 |
| D | 0 | 152 | 0 |
| Mode M0 | |||
|---|---|---|---|
| Quadrant | BADHDUFLAG | Total packets | Discarded packets |
| A | 0 | 31697 | 0 |
| B | 0 | 25269 | 0 |
| C | 0 | 17509 | 0 |
| D | 0 | 26583 | 0 |
| Quadrant | Total seconds | Saturated seconds | Saturation percentage |
|---|---|---|---|
| A | 7621 | 1783 | 23.395880% |
| B | 7621 | 1150 | 15.089883% |
| C | 7621 | 104 | 1.364650% |
| D | 7622 | 967 | 12.686959% |
Noise dominated data is calculated using 1-second bins in cleaned event files. If a bin has >2000 counts, and if more than 50% of those come from <1% of pixels, then it is considered to be noise-dominated and hence unusable.
| Quadrant | # 1 sec bins | Bins with >0 counts | Bins with >2000 counts | High rate bins dominated by noise | Noise dominated (total time) | Noise dominated (detector-on time) | Marked lightcurve |
|---|---|---|---|---|---|---|---|
| A | 7620 | 7620 | 1643 | 1643 | 21.56% | 21.56% | 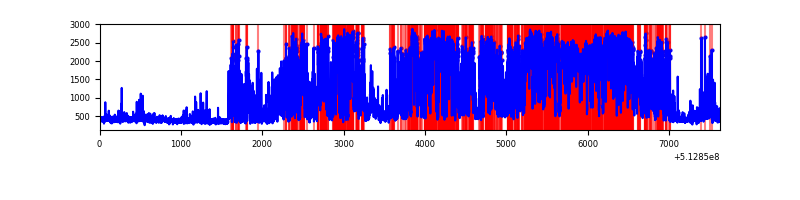 |
| B | 7621 | 7621 | 770 | 770 | 10.10% | 10.10% | 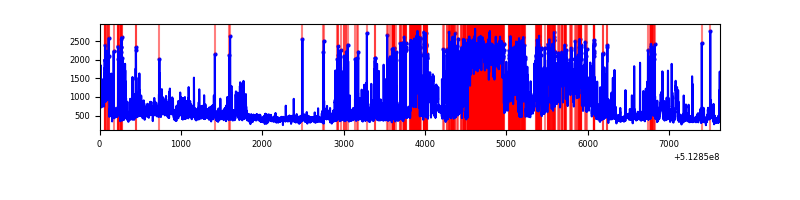 |
| C | 7620 | 7620 | 126 | 126 | 1.65% | 1.65% | 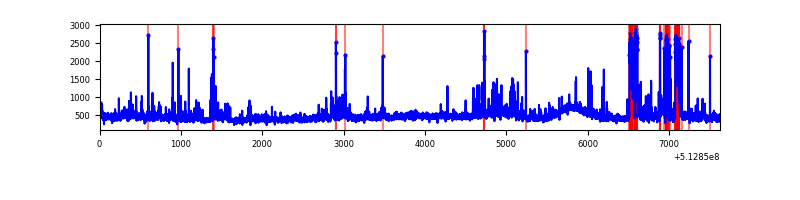 |
| D | 7622 | 7622 | 1041 | 1041 | 13.66% | 13.66% | 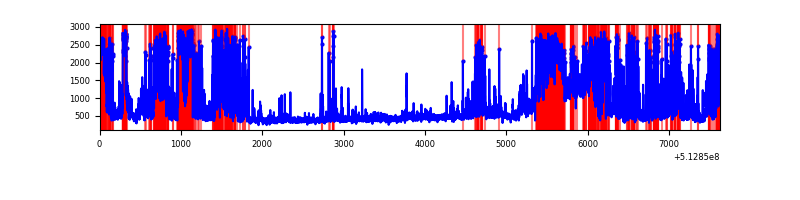 |
Top three noisy pixels from each quadrant. If the there are fewer than three noisy pixels in the level2.evt file, extra rows are filled as -1
| Pixel properties | Quadrant properties | ||||||
|---|---|---|---|---|---|---|---|
| Quadrant | DetID | PixID | Counts | Sigma | Mean | Median | Sigma |
| A | 10 | 251 | 5846015 | 32668.29 | 720 | 701 | 178.9 |
| A | 8 | 249 | 71519 | 395.79 | 720 | 701 | 178.9 |
| A | 8 | 206 | 18305 | 98.39 | 720 | 701 | 178.9 |
| B | 5 | 185 | 2168188 | 13430.41 | 748 | 722 | 161.4 |
| B | 5 | 172 | 1206750 | 7472.99 | 748 | 722 | 161.4 |
| B | 0 | 197 | 130252 | 802.62 | 748 | 722 | 161.4 |
| C | 13 | 3 | 609713 | 2869.84 | 766 | 759 | 212.2 |
| C | 1 | 16 | 121193 | 567.57 | 766 | 759 | 212.2 |
| C | 15 | 148 | 116763 | 546.7 | 766 | 759 | 212.2 |
| D | 2 | 249 | 1679112 | 8110.63 | 729 | 698 | 206.9 |
| D | 2 | 207 | 760342 | 3670.84 | 729 | 698 | 206.9 |
| D | 8 | 160 | 457465 | 2207.24 | 729 | 698 | 206.9 |
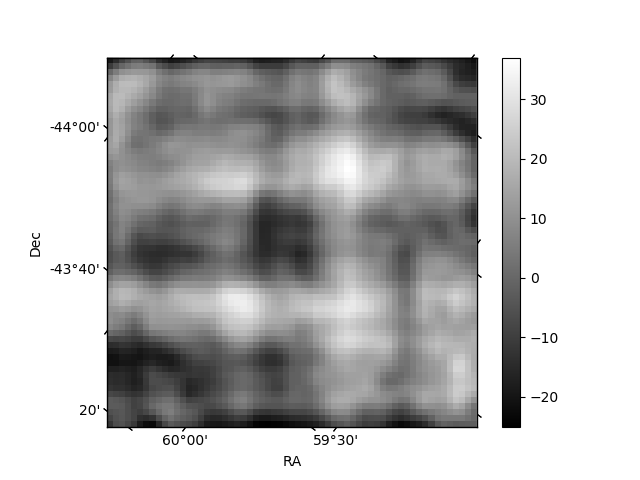
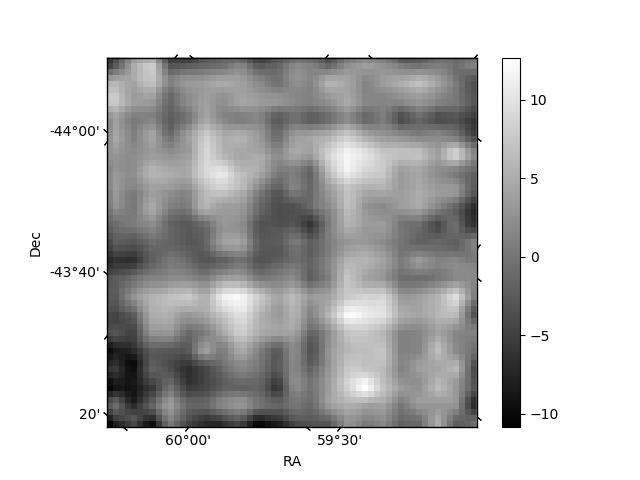
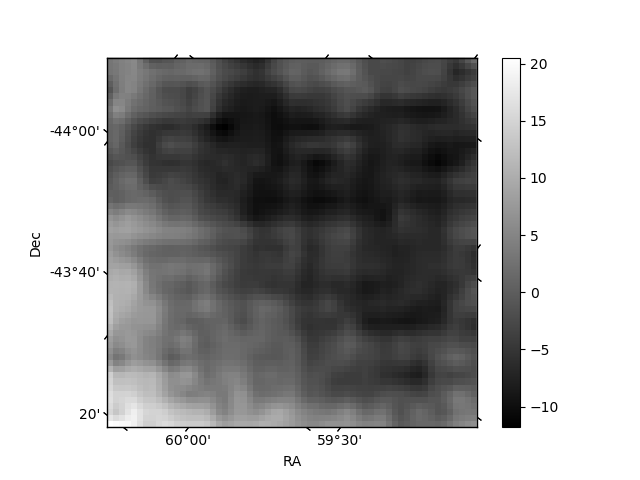
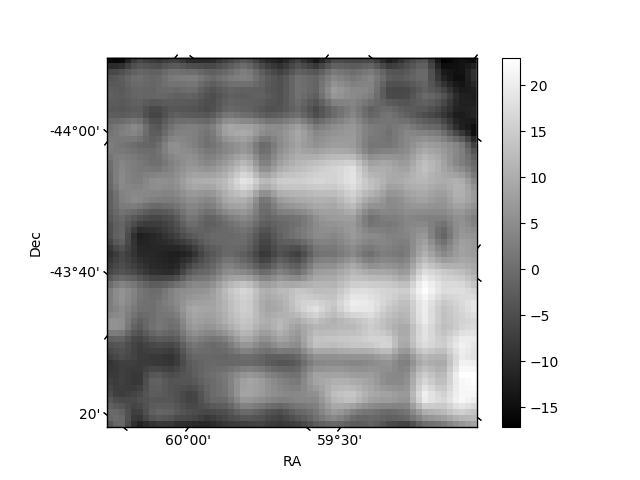
Histogram calculated using DETX and DETY for each event in the final _common_clean file
| Quadrant A | 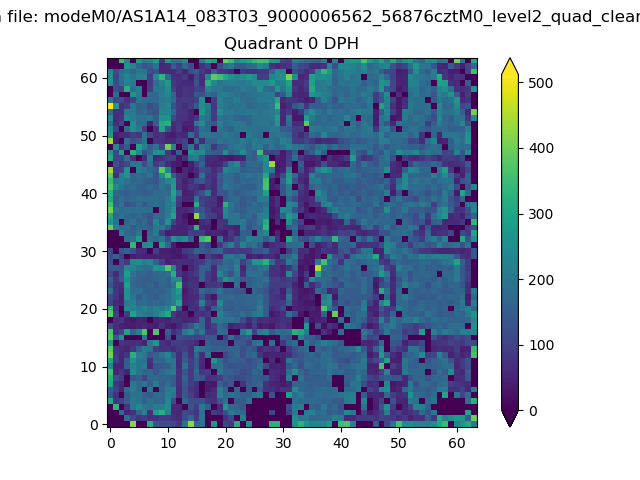 |
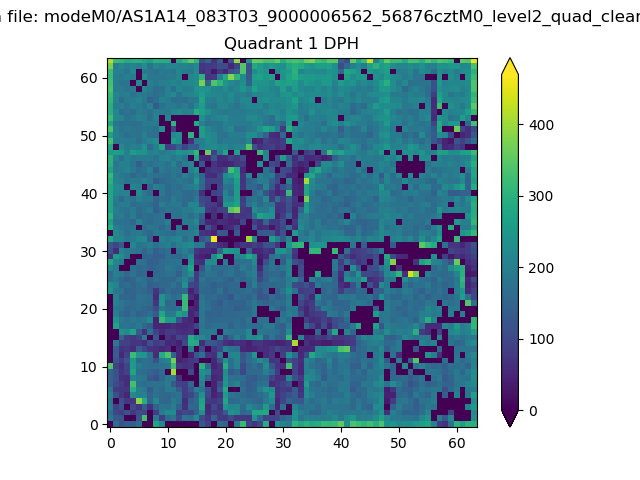 |
Quadrant B |
|---|---|---|---|
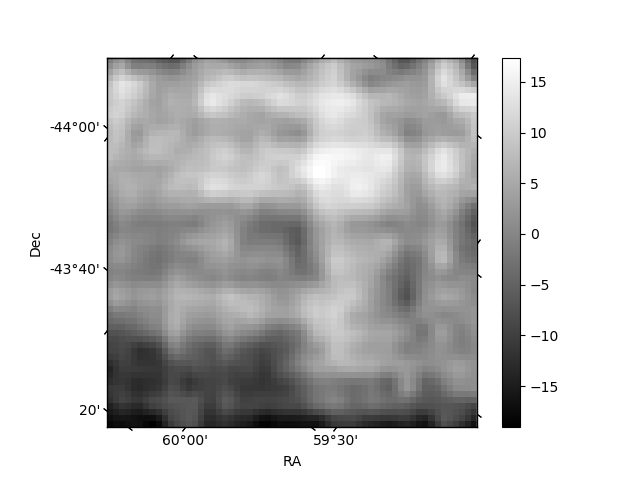
| Quadrant D | 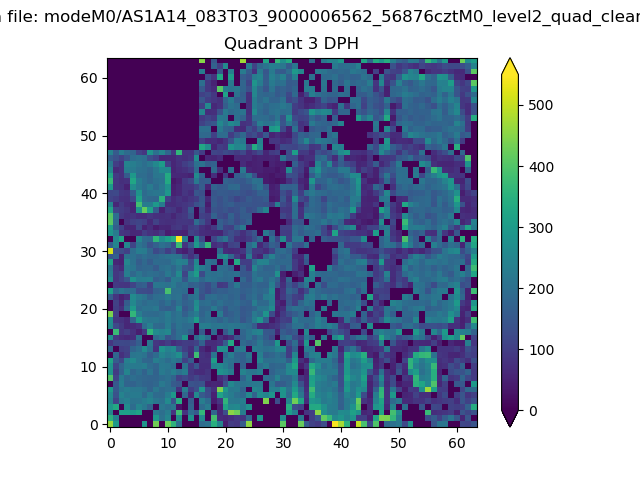 |
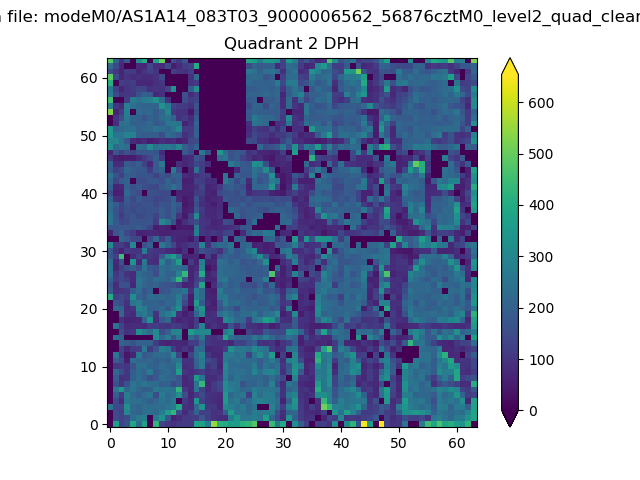 |
Quadrant C |
| Plot type | Count rate plots | Images |
|---|---|---|
| Comparison with Poisson distribution Blue bars denote a histogram of data divided into 1 sec bins. Red curve is a Poisson curve with rate = median count rate of data. |
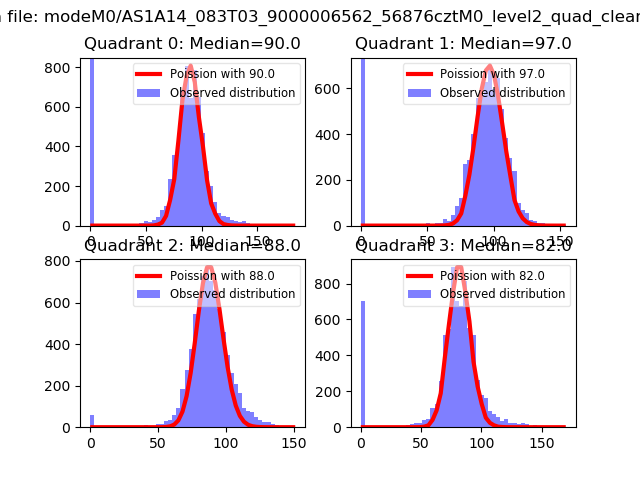 |
 |
| Quadrant-wise count rates Data is divided into 100 sec bins |
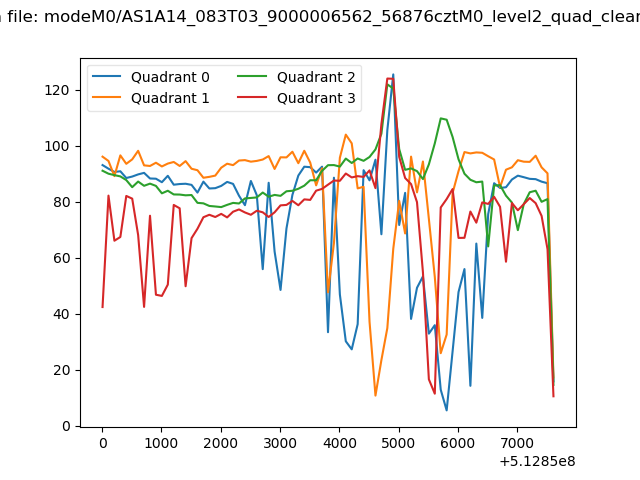 |
|
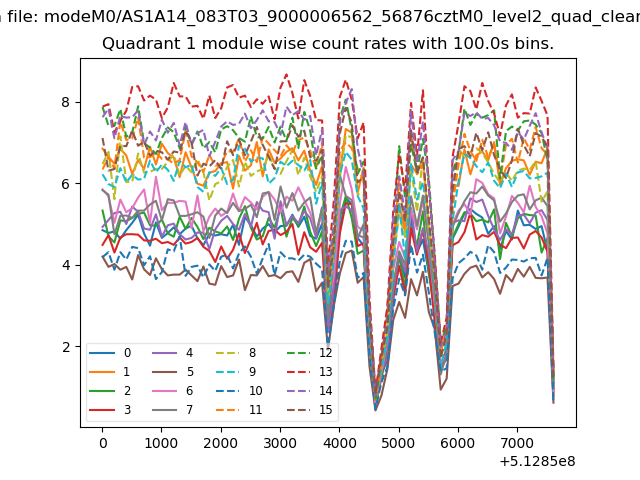
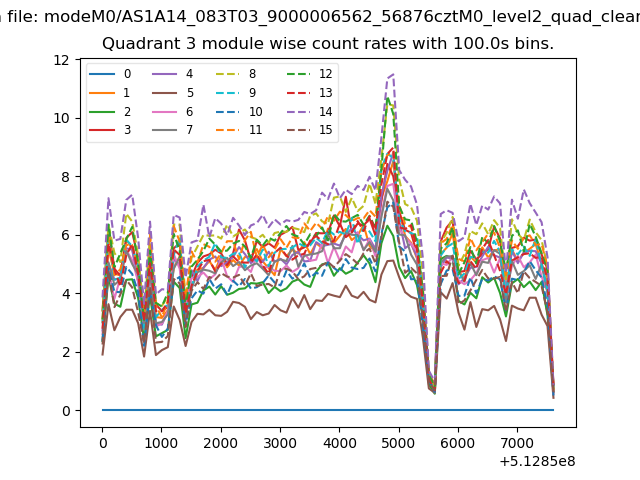
| Module-wise count rates for Quadrant A Data is divided into 100 sec bins |
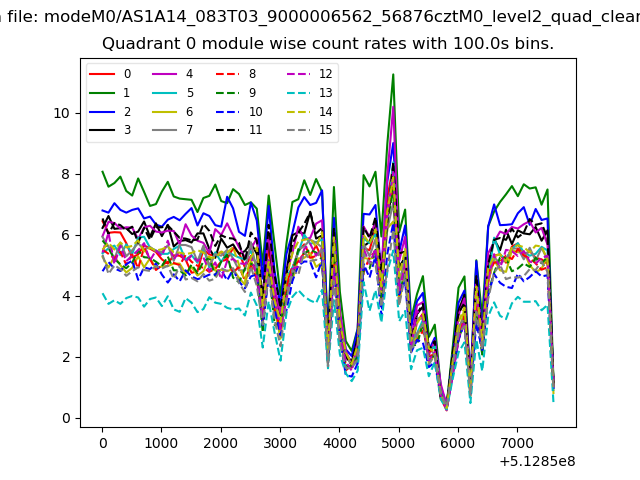 |
 |
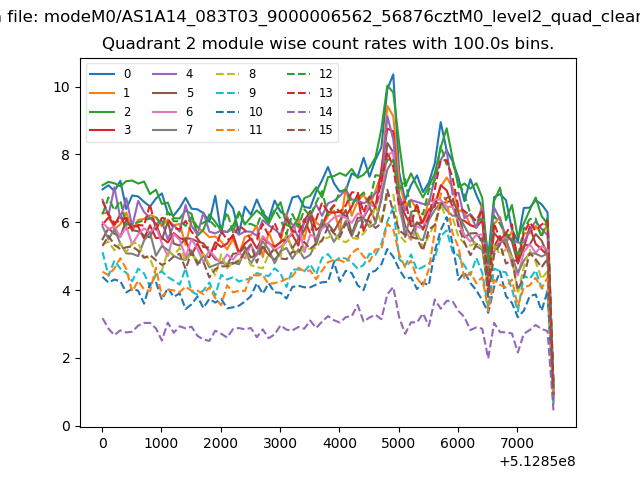
| Module-wise count rates for Quadrant B Data is divided into 100 sec bins |
 |
 |
| Module-wise count rates for Quadrant C Data is divided into 100 sec bins |
 |
 |
| Module-wise count rates for Quadrant D Data is divided into 100 sec bins |
 |
 |
| Parameter | Plot |
|---|---|
| CZT HV Monitor | 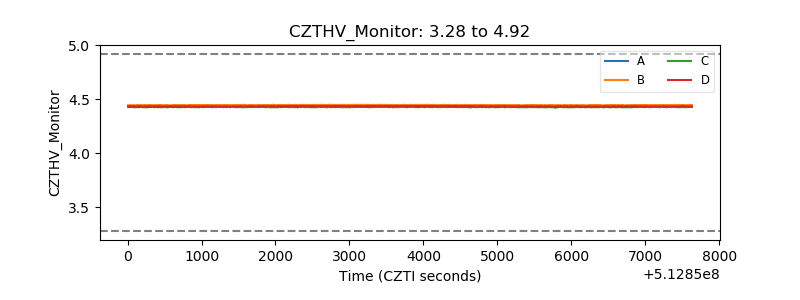 |
| D_VDD | 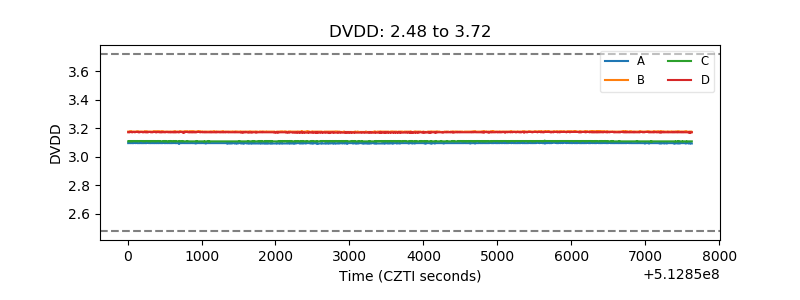 |
| Temperature 1 | 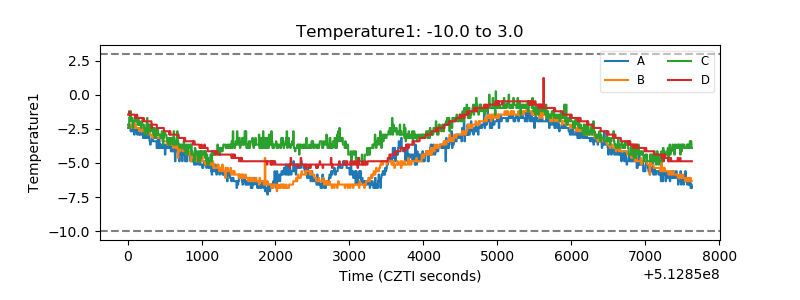 |
| Veto HV Monitor | 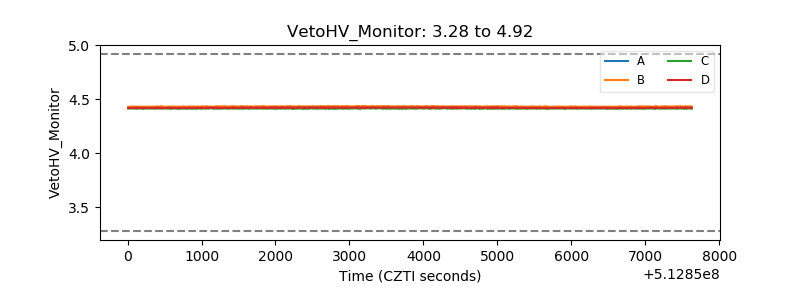 |
| Veto LLD | 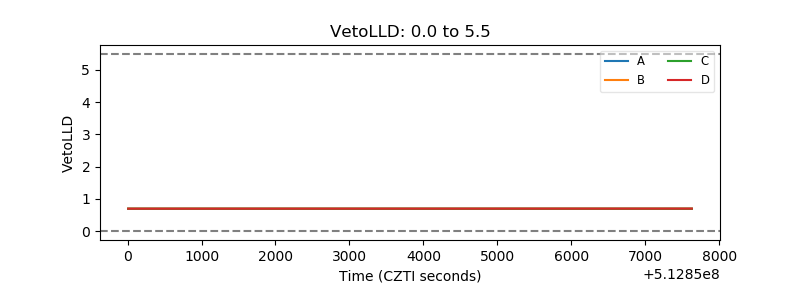 |
| Alpha Counter | 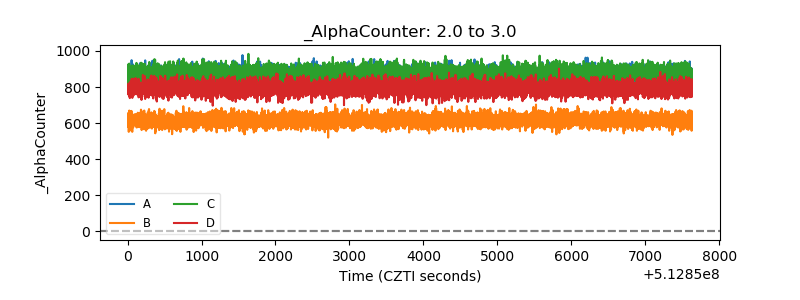 |
| _CPM_Rate | 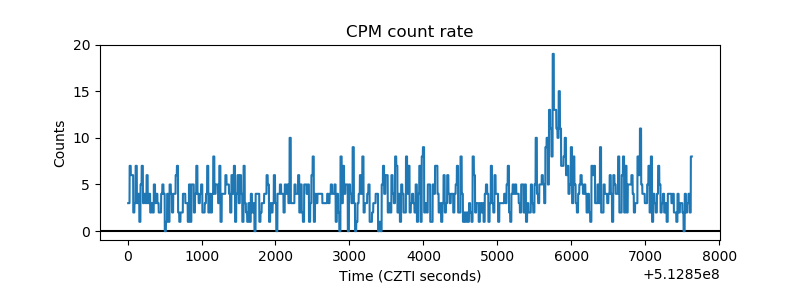 |
| CZT Counter | 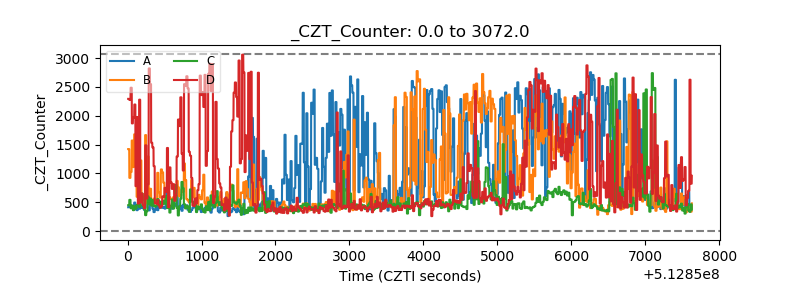 |
| +2.5 Volts monitor | 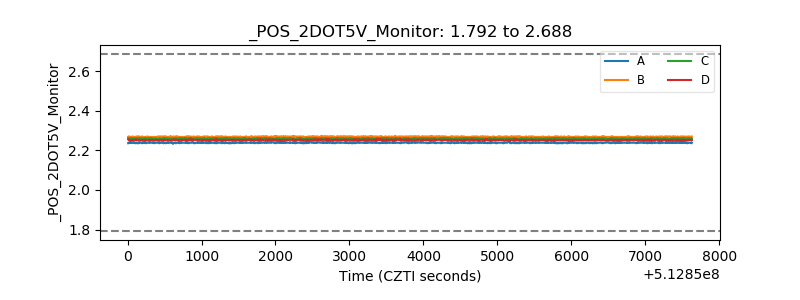 |
| +5 Volts monitor | 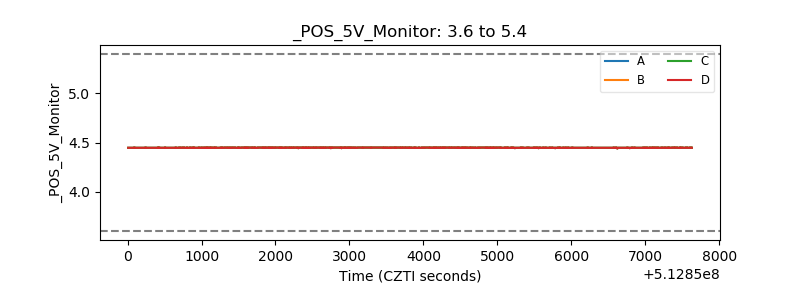 |
| _ROLL_ROT | 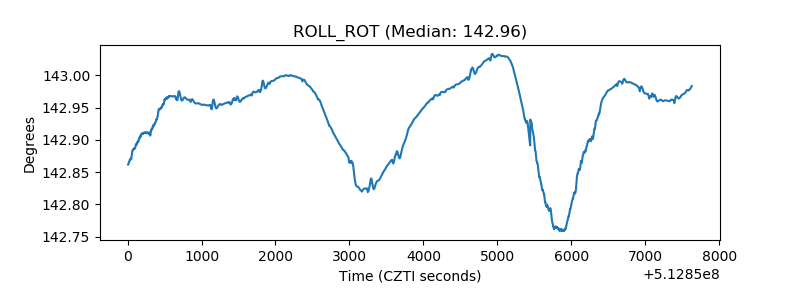 |
| _Roll_DEC | 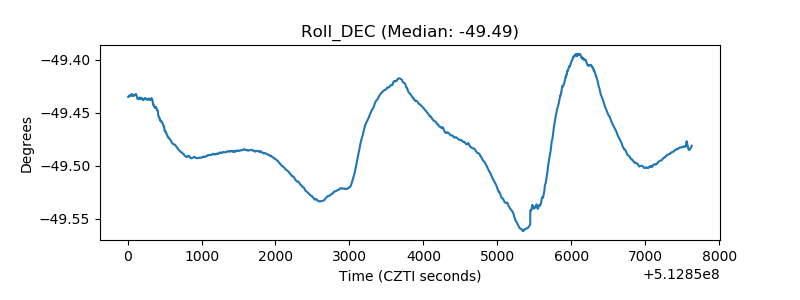 |
| _Roll_RA | 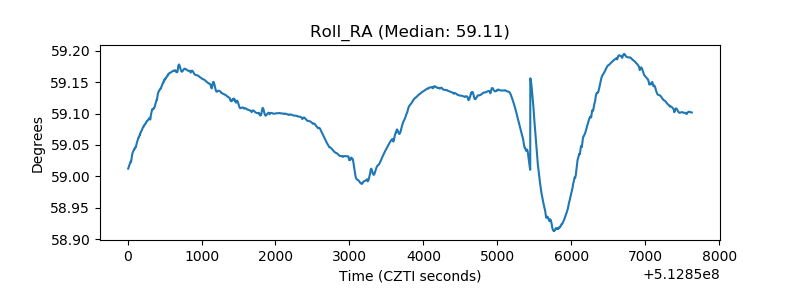 |
| Veto Counter | 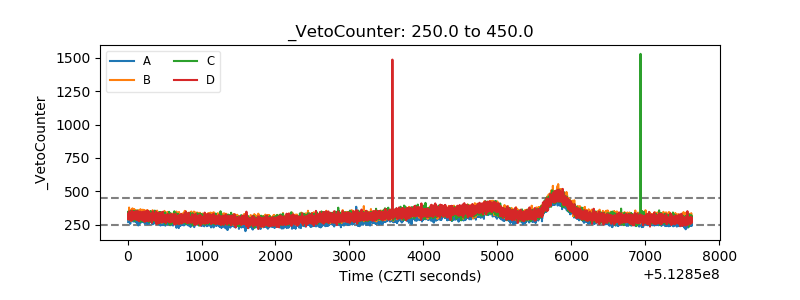 |