| Param | Original file | Final file |
|---|---|---|
| Filename | modeM0/AS1A14_083T03_9000006562_56879cztM0_level2.fits | modeM0/AS1A14_083T03_9000006562_56879cztM0_level2_quad_clean.evt |
| Size (bytes) | 1,305,918,720 | 253,172,160 |
| Size | 1.2 GB | 241.4 MB |
| Events in quadrant A | 13,973,186 | 1,572,026 |
| Events in quadrant B | 10,095,228 | 1,769,583 |
| Events in quadrant C | 9,195,540 | 1,606,744 |
| Events in quadrant D | 13,636,316 | 1,434,200 |
| Mode M9 | |||
|---|---|---|---|
| Quadrant | BADHDUFLAG | Total packets | Discarded packets |
| A | 0 | 17 | 0 |
| B | 0 | 17 | 0 |
| C | 0 | 17 | 0 |
| D | 0 | 17 | 0 |
| Mode SS | |||
|---|---|---|---|
| Quadrant | BADHDUFLAG | Total packets | Discarded packets |
| A | 0 | 376 | 0 |
| B | 0 | 376 | 0 |
| C | 0 | 376 | 0 |
| D | 0 | 376 | 0 |
| Mode M0 | |||
|---|---|---|---|
| Quadrant | BADHDUFLAG | Total packets | Discarded packets |
| A | 0 | 55132 | 3 |
| B | 0 | 43801 | 4 |
| C | 0 | 41011 | 3 |
| D | 0 | 53817 | 3 |
| Quadrant | Total seconds | Saturated seconds | Saturation percentage |
|---|---|---|---|
| A | 18619 | 1457 | 7.825340% |
| B | 18618 | 798 | 4.286175% |
| C | 18619 | 170 | 0.913046% |
| D | 18619 | 1143 | 6.138890% |
Noise dominated data is calculated using 1-second bins in cleaned event files. If a bin has >2000 counts, and if more than 50% of those come from <1% of pixels, then it is considered to be noise-dominated and hence unusable.
| Quadrant | # 1 sec bins | Bins with >0 counts | Bins with >2000 counts | High rate bins dominated by noise | Noise dominated (total time) | Noise dominated (detector-on time) | Marked lightcurve |
|---|---|---|---|---|---|---|---|
| A | 20188 | 18619 | 1342 | 1342 | 6.65% | 7.21% | 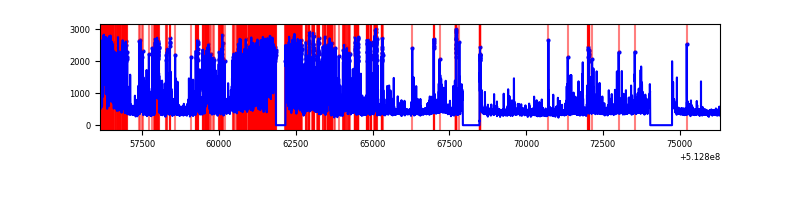 |
| B | 20187 | 18618 | 527 | 527 | 2.61% | 2.83% | 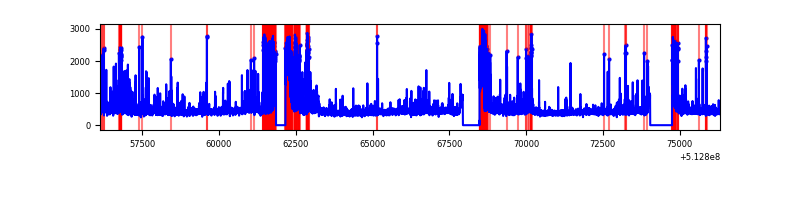 |
| C | 20188 | 18619 | 154 | 154 | 0.76% | 0.83% | 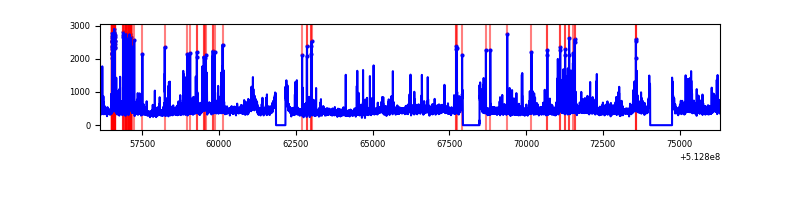 |
| D | 20188 | 18619 | 1104 | 1104 | 5.47% | 5.93% | 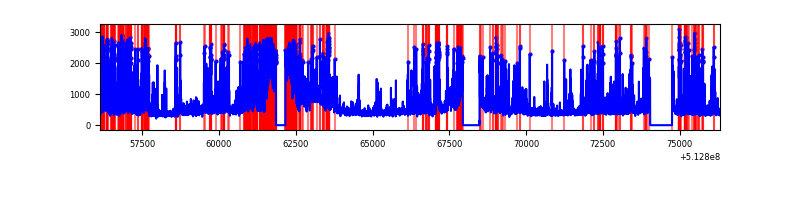 |
Top three noisy pixels from each quadrant. If the there are fewer than three noisy pixels in the level2.evt file, extra rows are filled as -1
| Pixel properties | Quadrant properties | ||||||
|---|---|---|---|---|---|---|---|
| Quadrant | DetID | PixID | Counts | Sigma | Mean | Median | Sigma |
| A | 10 | 251 | 4836055 | 10412.32 | 1883 | 1835 | 464.3 |
| A | 7 | 64 | 1141446 | 2454.58 | 1883 | 1835 | 464.3 |
| A | 3 | 14 | 491349 | 1054.35 | 1883 | 1835 | 464.3 |
| B | 10 | 16 | 1382470 | 3467.32 | 1863 | 1792 | 398.2 |
| B | 5 | 185 | 909125 | 2278.6 | 1863 | 1792 | 398.2 |
| B | 0 | 245 | 96885 | 238.81 | 1863 | 1792 | 398.2 |
| C | 13 | 3 | 892475 | 1745.92 | 1875 | 1857 | 510.1 |
| C | 1 | 16 | 235726 | 458.46 | 1875 | 1857 | 510.1 |
| C | 14 | 254 | 172440 | 334.4 | 1875 | 1857 | 510.1 |
| D | 2 | 249 | 1667365 | 3284.01 | 1815 | 1735 | 507.2 |
| D | 8 | 240 | 1434936 | 2825.74 | 1815 | 1735 | 507.2 |
| D | 11 | 129 | 990666 | 1949.81 | 1815 | 1735 | 507.2 |
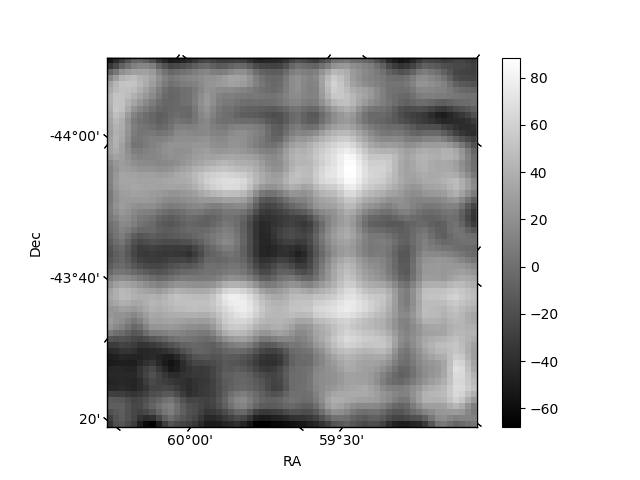
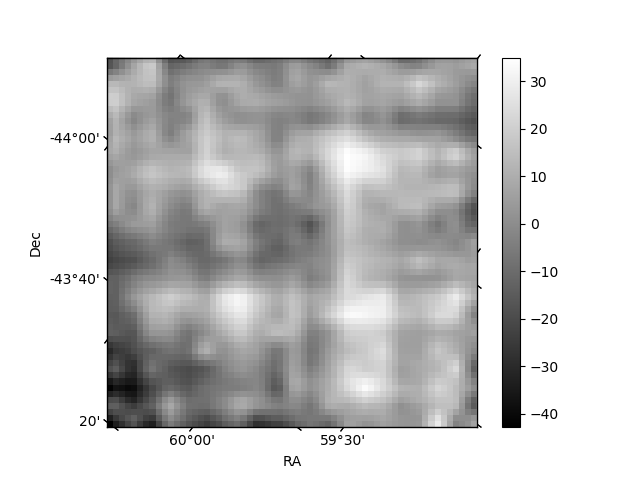
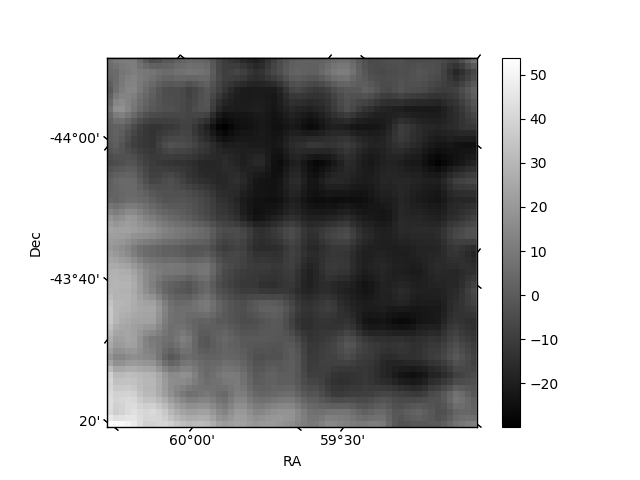
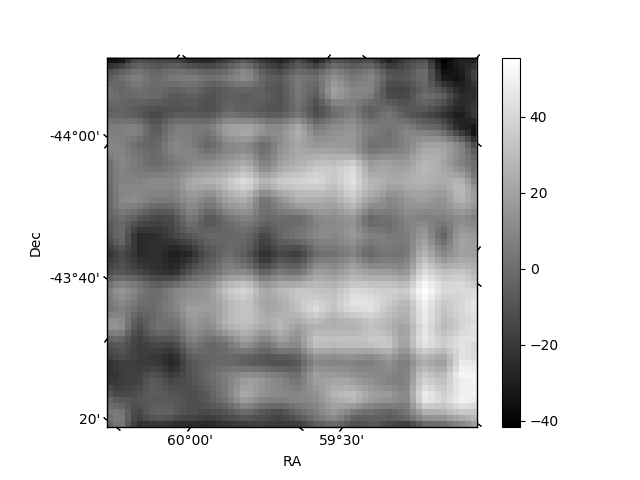
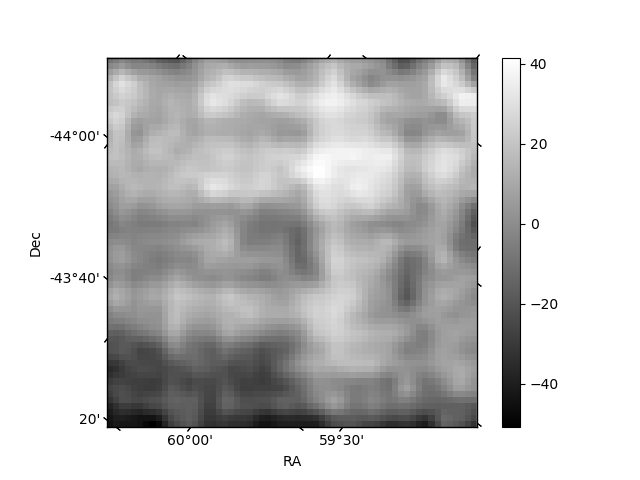
Histogram calculated using DETX and DETY for each event in the final _common_clean file
| Quadrant A | 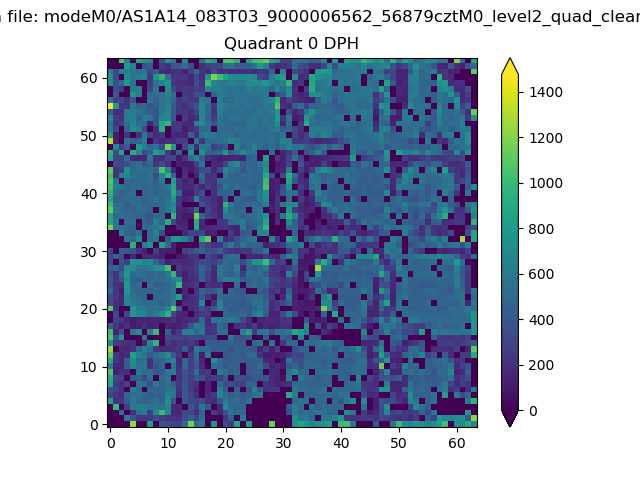 |
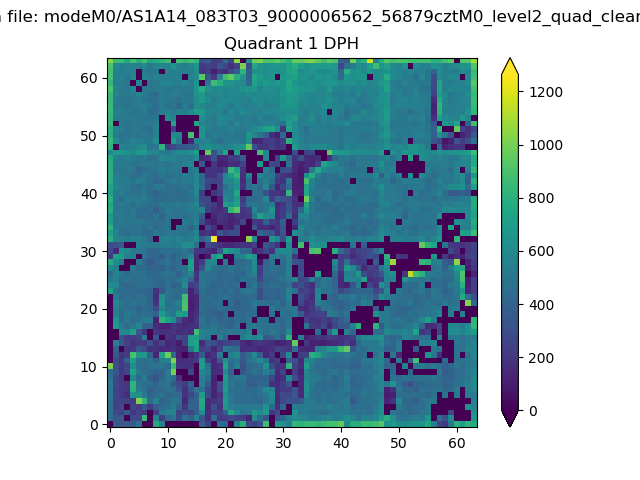 |
Quadrant B |
|---|---|---|---|
| Quadrant D | 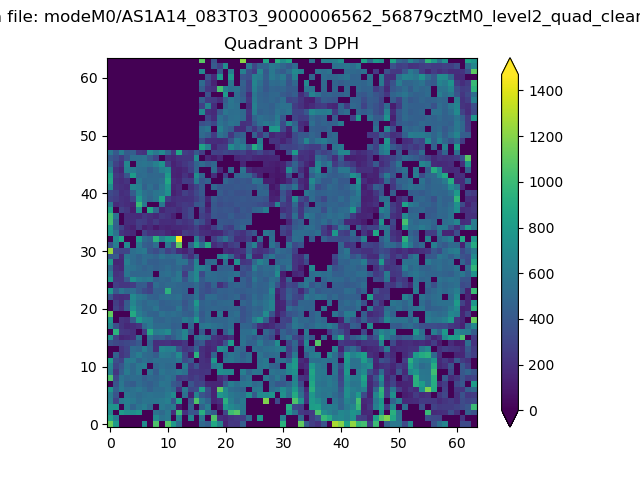 |
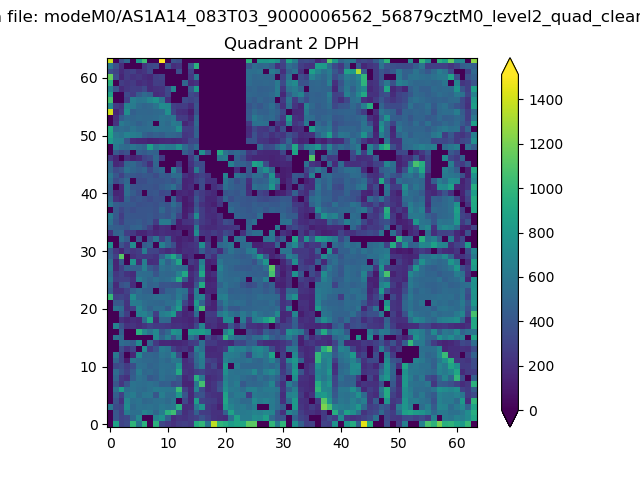 |
Quadrant C |
| Plot type | Count rate plots | Images |
|---|---|---|
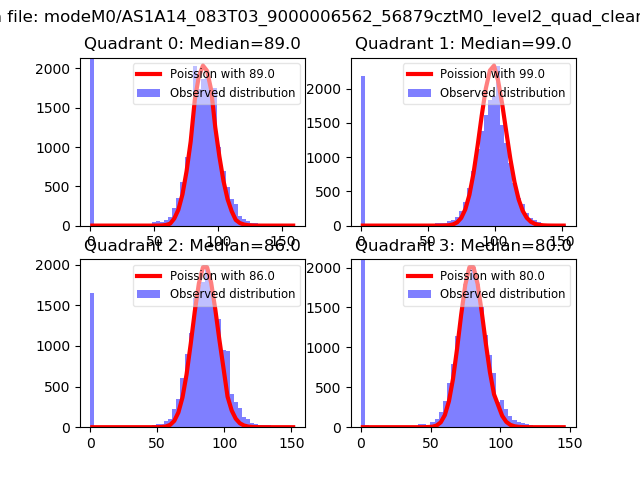
| Comparison with Poisson distribution Blue bars denote a histogram of data divided into 1 sec bins. Red curve is a Poisson curve with rate = median count rate of data. |
 |
 |
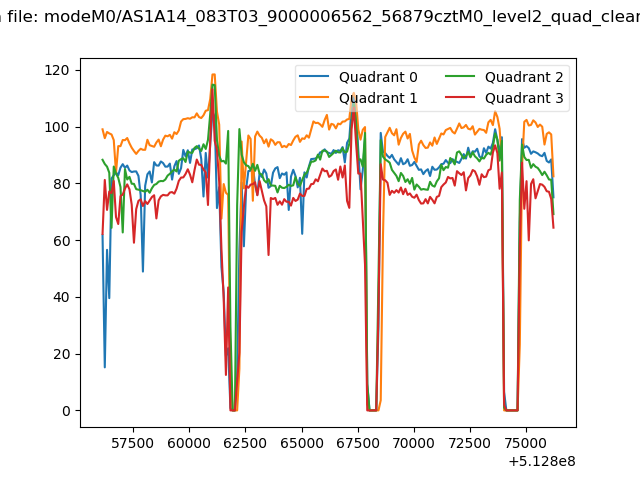
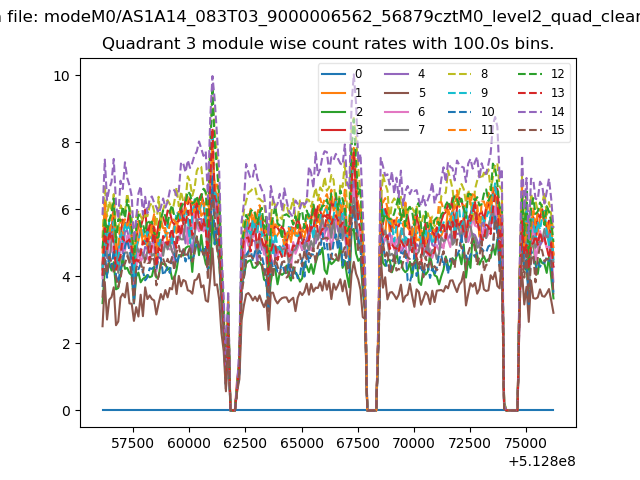
| Quadrant-wise count rates Data is divided into 100 sec bins |
 |
|
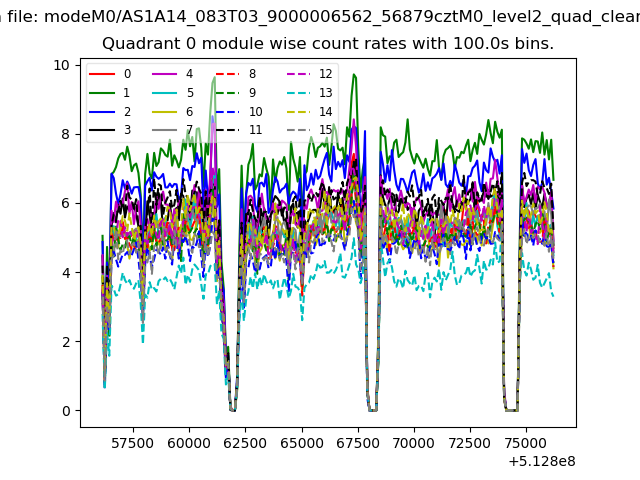
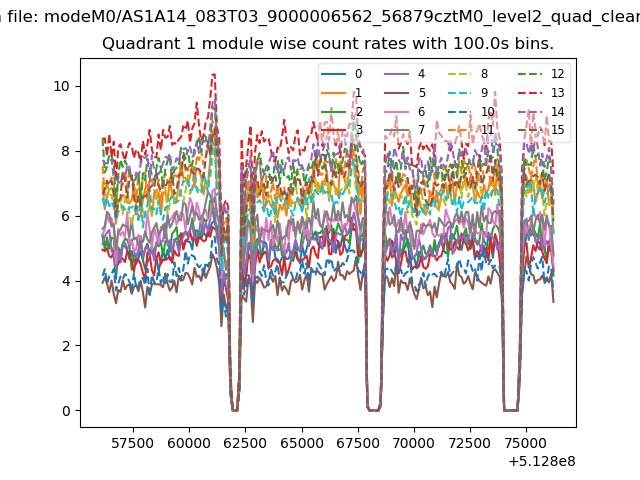
| Module-wise count rates for Quadrant A Data is divided into 100 sec bins |
 |
 |
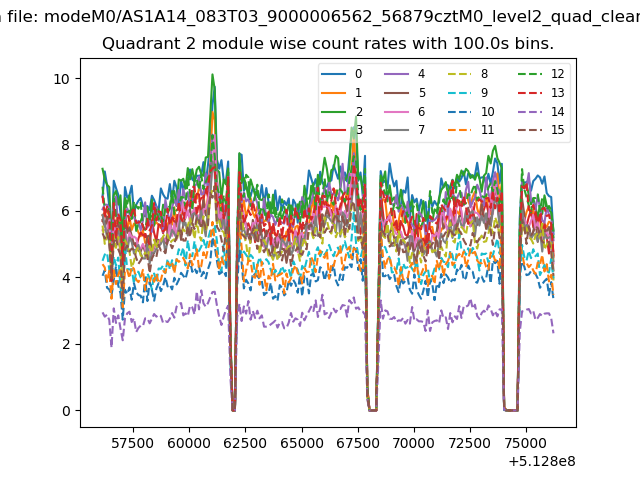
| Module-wise count rates for Quadrant B Data is divided into 100 sec bins |
 |
 |
| Module-wise count rates for Quadrant C Data is divided into 100 sec bins |
 |
 |
| Module-wise count rates for Quadrant D Data is divided into 100 sec bins |
 |
 |
| Parameter | Plot |
|---|---|
| CZT HV Monitor | 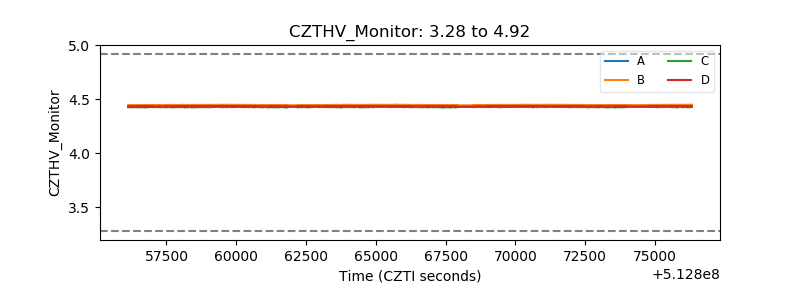 |
| D_VDD | 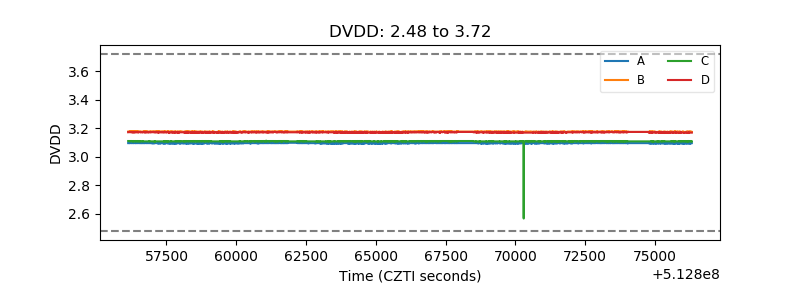 |
| Temperature 1 | 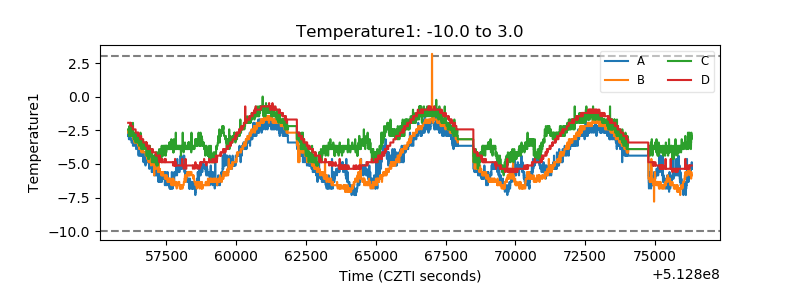 |
| Veto HV Monitor | 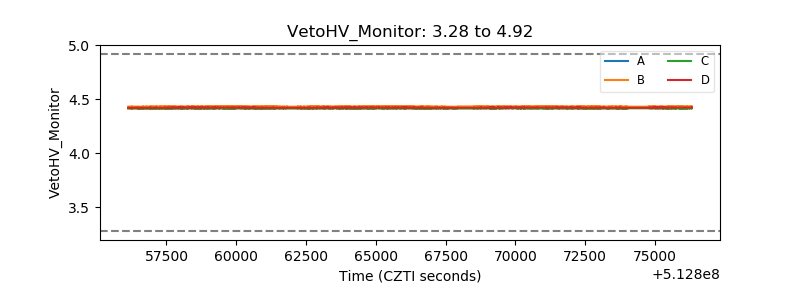 |
| Veto LLD | 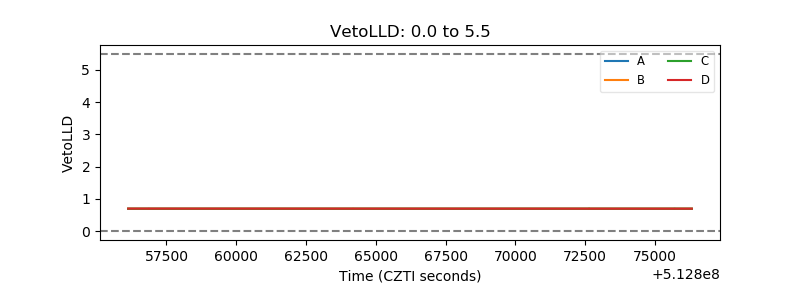 |
| Alpha Counter | 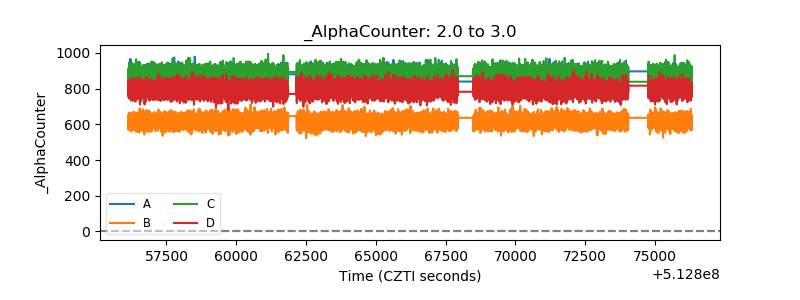 |
| _CPM_Rate | 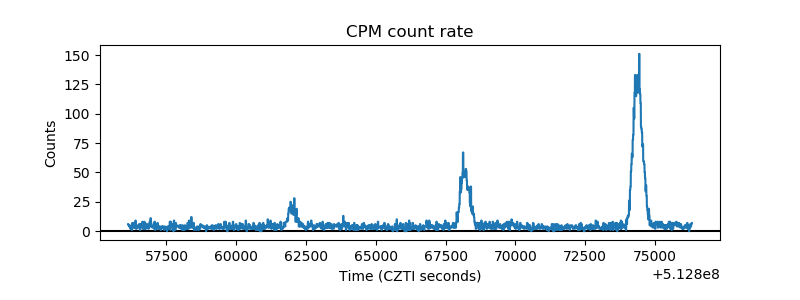 |
| CZT Counter | 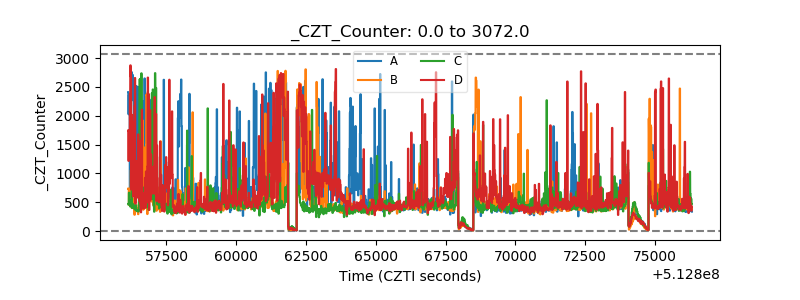 |
| +2.5 Volts monitor | 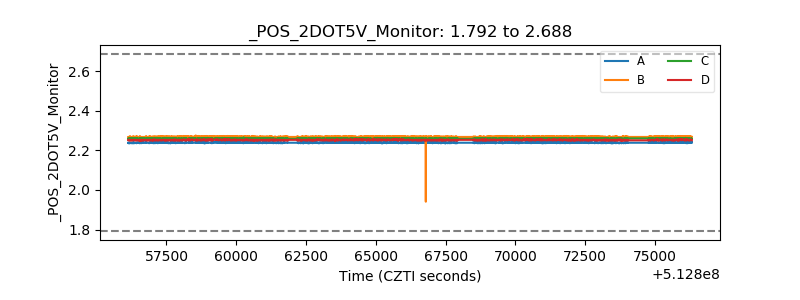 |
| +5 Volts monitor | 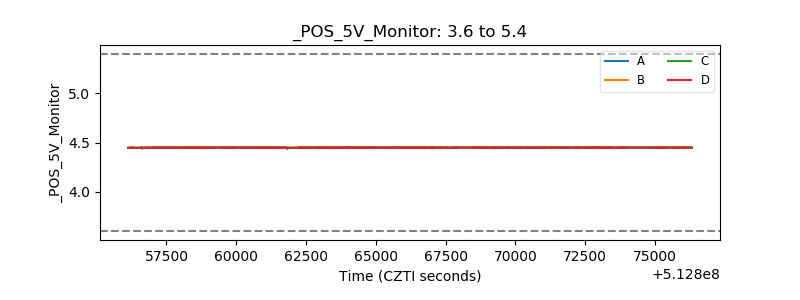 |
| _ROLL_ROT | 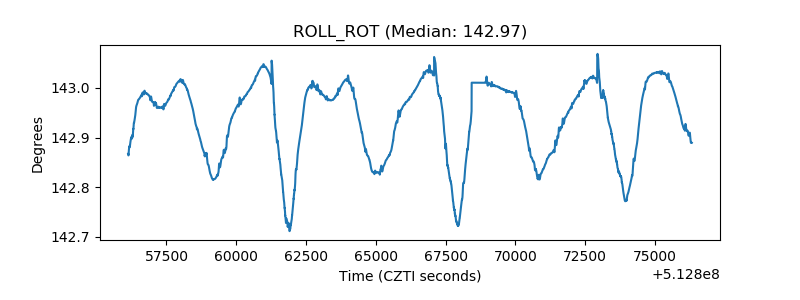 |
| _Roll_DEC | 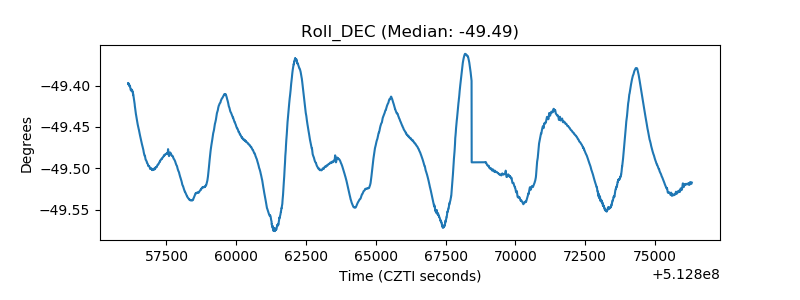 |
| _Roll_RA | 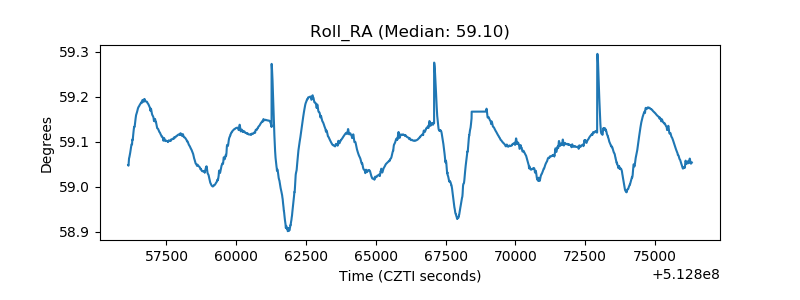 |
| Veto Counter | 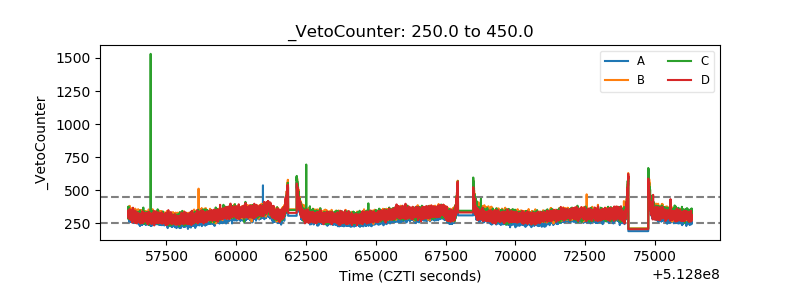 |