| Param | Original file | Final file |
|---|---|---|
| Filename | modeM0/AS1A14_083T03_9000006562_56882cztM0_level2.fits | modeM0/AS1A14_083T03_9000006562_56882cztM0_level2_quad_clean.evt |
| Size (bytes) | 615,867,840 | 112,351,680 |
| Size | 587.3 MB | 107.1 MB |
| Events in quadrant A | 4,772,729 | 756,239 |
| Events in quadrant B | 4,204,963 | 791,580 |
| Events in quadrant C | 4,039,633 | 729,916 |
| Events in quadrant D | 9,158,441 | 567,534 |
| Mode M9 | |||
|---|---|---|---|
| Quadrant | BADHDUFLAG | Total packets | Discarded packets |
| A | 0 | 18 | 0 |
| B | 0 | 18 | 0 |
| C | 0 | 18 | 0 |
| D | 0 | 18 | 0 |
| Mode SS | |||
|---|---|---|---|
| Quadrant | BADHDUFLAG | Total packets | Discarded packets |
| A | 0 | 164 | 0 |
| B | 0 | 164 | 0 |
| C | 0 | 164 | 0 |
| D | 0 | 164 | 0 |
| Mode M0 | |||
|---|---|---|---|
| Quadrant | BADHDUFLAG | Total packets | Discarded packets |
| A | 0 | 19987 | 4 |
| B | 0 | 18448 | 2 |
| C | 0 | 17817 | 4 |
| D | 0 | 32671 | 2 |
| Quadrant | Total seconds | Saturated seconds | Saturation percentage |
|---|---|---|---|
| A | 8007 | 234 | 2.922443% |
| B | 8007 | 397 | 4.958162% |
| C | 8006 | 176 | 2.198351% |
| D | 8007 | 1736 | 21.681029% |
Noise dominated data is calculated using 1-second bins in cleaned event files. If a bin has >2000 counts, and if more than 50% of those come from <1% of pixels, then it is considered to be noise-dominated and hence unusable.
| Quadrant | # 1 sec bins | Bins with >0 counts | Bins with >2000 counts | High rate bins dominated by noise | Noise dominated (total time) | Noise dominated (detector-on time) | Marked lightcurve |
|---|---|---|---|---|---|---|---|
| A | 9867 | 8009 | 115 | 115 | 1.17% | 1.44% | 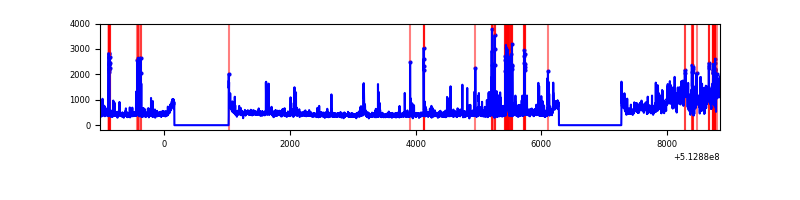 |
| B | 9867 | 8009 | 194 | 194 | 1.97% | 2.42% | 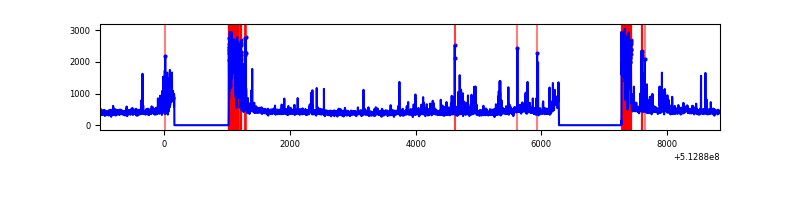 |
| C | 9867 | 8009 | 66 | 66 | 0.67% | 0.82% | 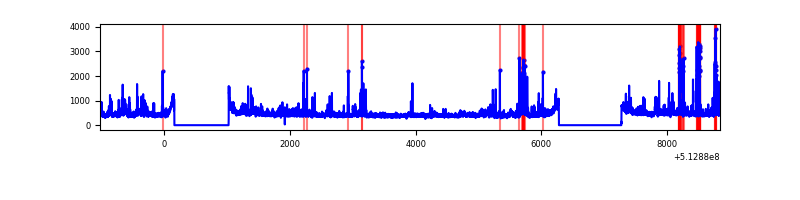 |
| D | 9867 | 8009 | 1751 | 1751 | 17.75% | 21.86% | 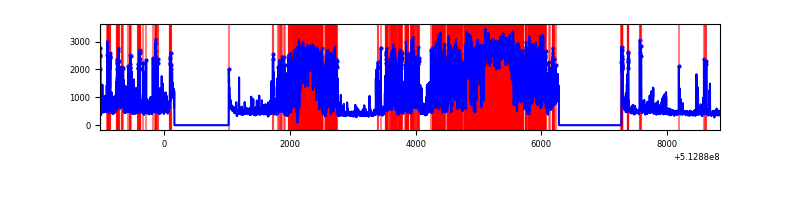 |
Top three noisy pixels from each quadrant. If the there are fewer than three noisy pixels in the level2.evt file, extra rows are filled as -1
| Pixel properties | Quadrant properties | ||||||
|---|---|---|---|---|---|---|---|
| Quadrant | DetID | PixID | Counts | Sigma | Mean | Median | Sigma |
| A | 7 | 64 | 763629 | 3593.07 | 858 | 838 | 212.3 |
| A | 3 | 14 | 334294 | 1570.72 | 858 | 838 | 212.3 |
| A | 3 | 62 | 189734 | 889.78 | 858 | 838 | 212.3 |
| B | 10 | 16 | 687149 | 3885.09 | 826 | 796 | 176.7 |
| B | 5 | 185 | 52455 | 292.42 | 826 | 796 | 176.7 |
| B | 0 | 197 | 32947 | 181.99 | 826 | 796 | 176.7 |
| C | 13 | 3 | 329379 | 1433.39 | 842 | 836 | 229.2 |
| C | 14 | 254 | 97010 | 419.59 | 842 | 836 | 229.2 |
| C | 7 | 220 | 72576 | 312.99 | 842 | 836 | 229.2 |
| D | 2 | 249 | 2846189 | 13238.35 | 765 | 729 | 214.9 |
| D | 8 | 240 | 2285300 | 10628.85 | 765 | 729 | 214.9 |
| D | 8 | 160 | 433916 | 2015.38 | 765 | 729 | 214.9 |
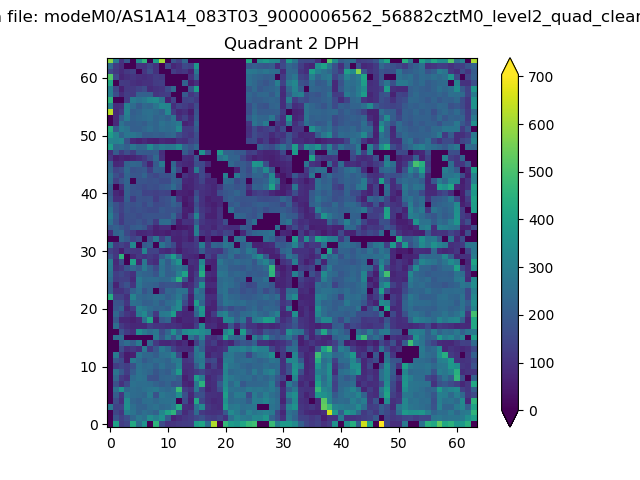
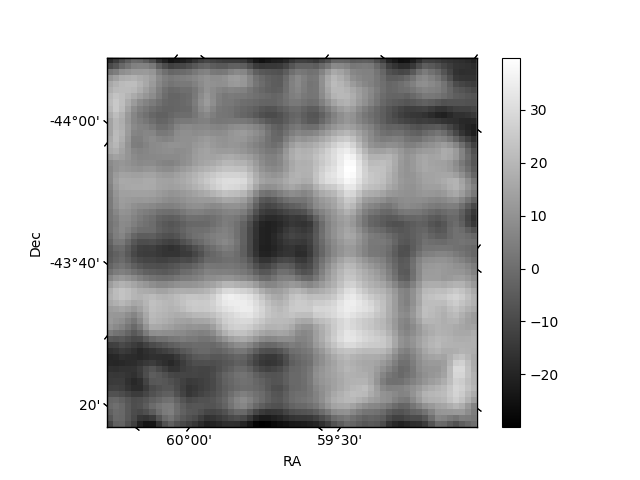
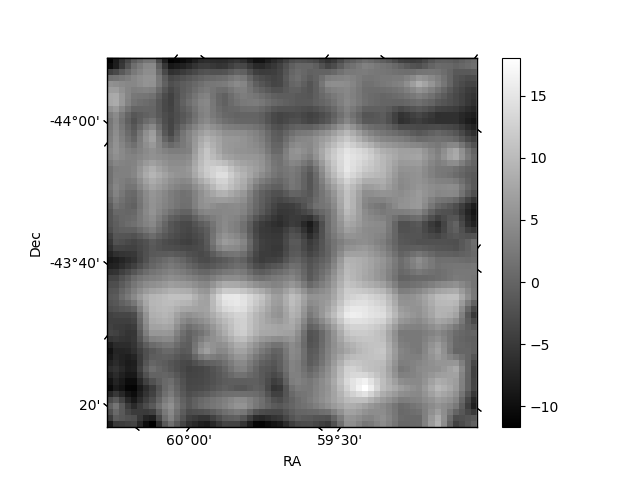
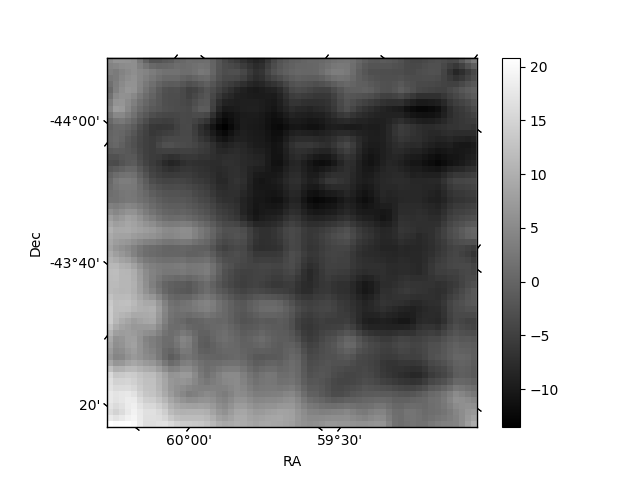
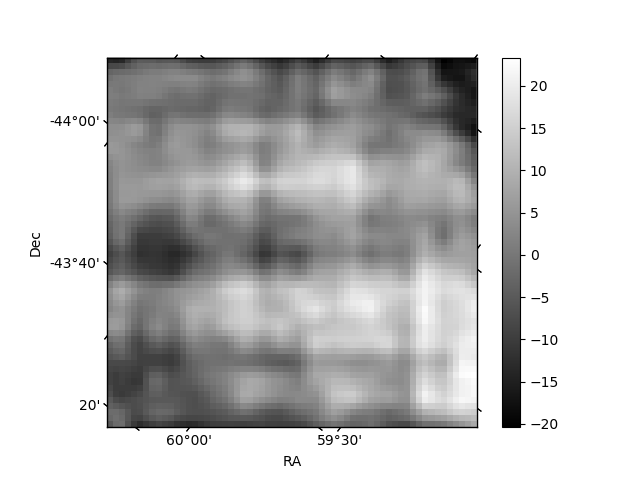
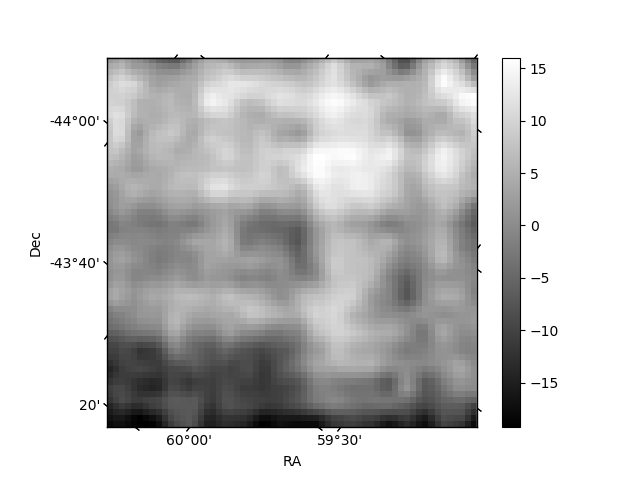
Histogram calculated using DETX and DETY for each event in the final _common_clean file
| Quadrant A | 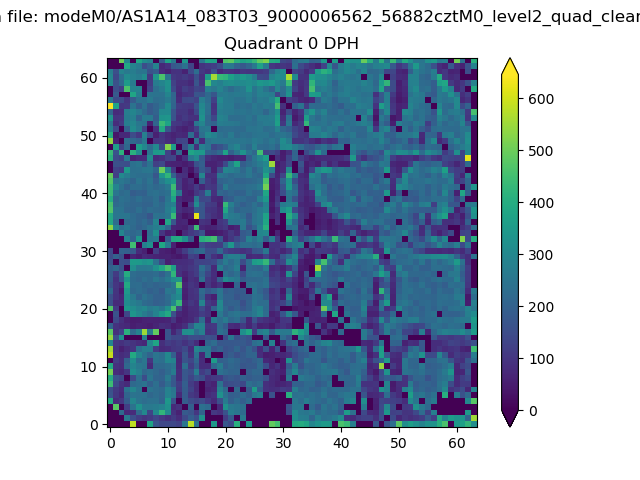 |
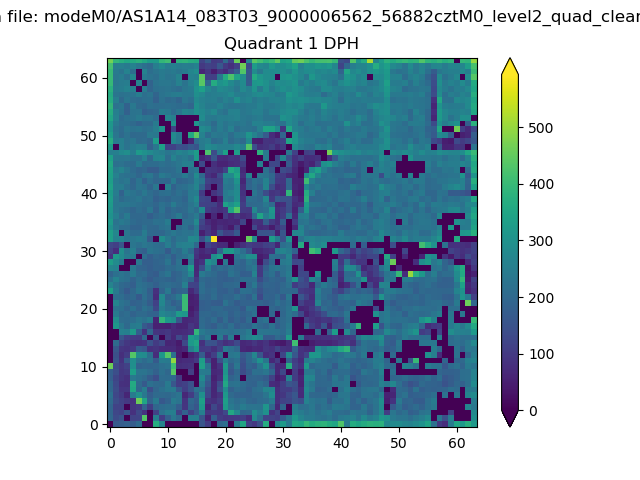 |
Quadrant B |
|---|---|---|---|
| Quadrant D | 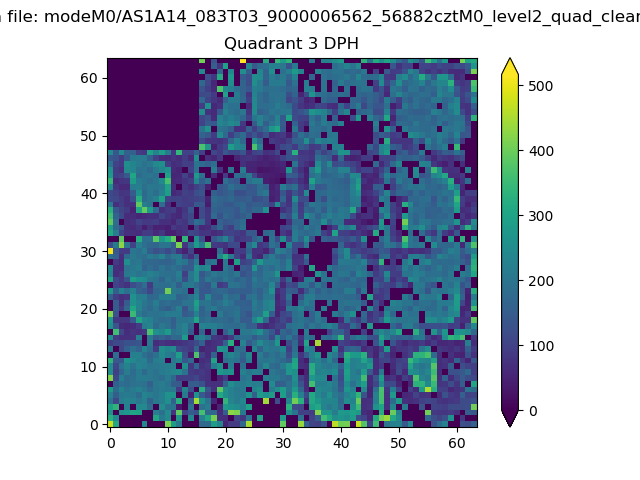 |
 |
Quadrant C |
| Plot type | Count rate plots | Images |
|---|---|---|
| Comparison with Poisson distribution Blue bars denote a histogram of data divided into 1 sec bins. Red curve is a Poisson curve with rate = median count rate of data. |
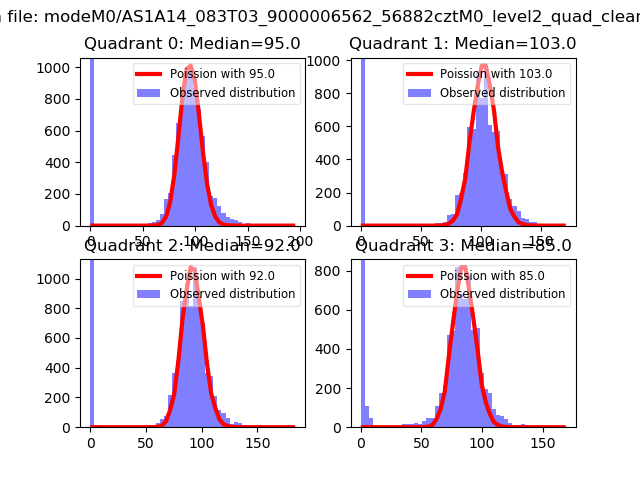 |
 |
| Quadrant-wise count rates Data is divided into 100 sec bins |
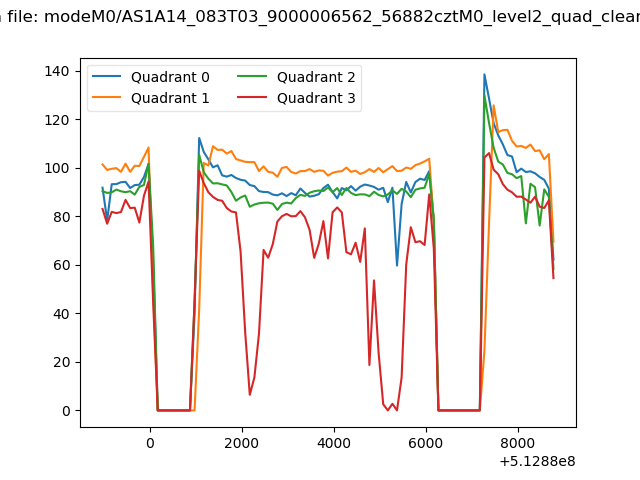 |
|
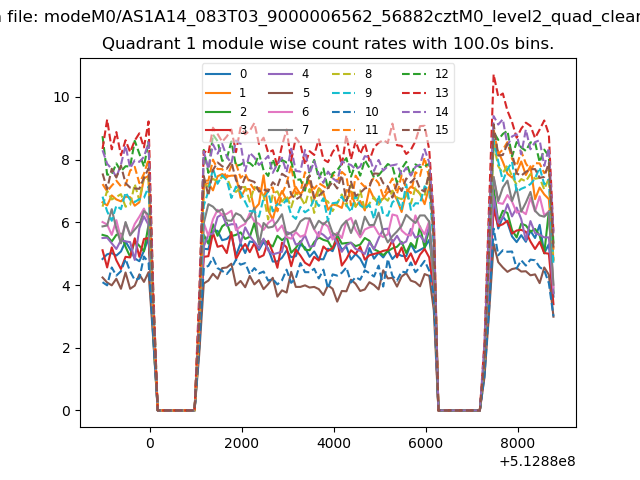
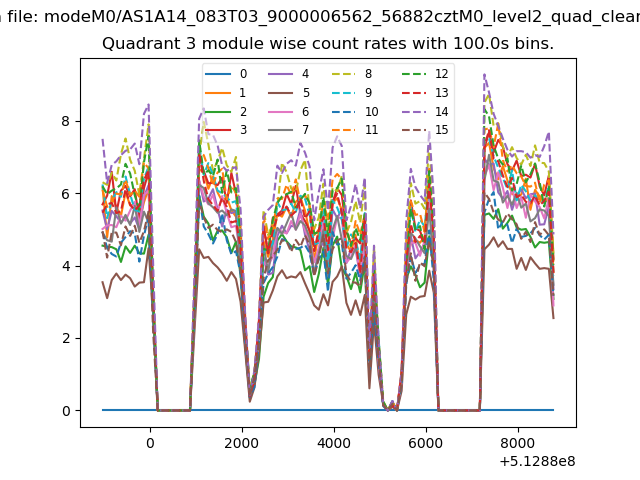
| Module-wise count rates for Quadrant A Data is divided into 100 sec bins |
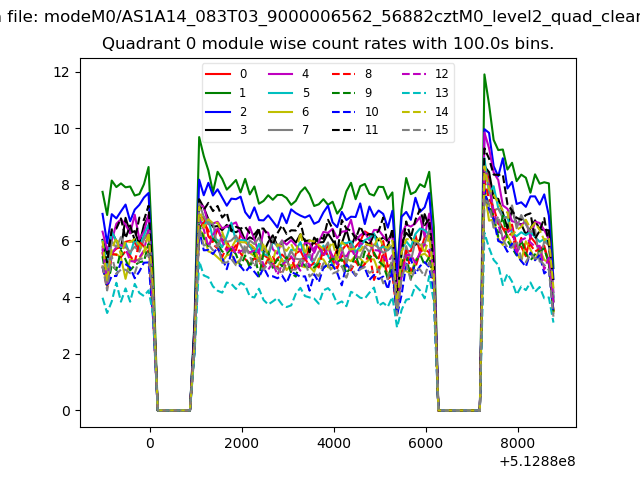 |
 |
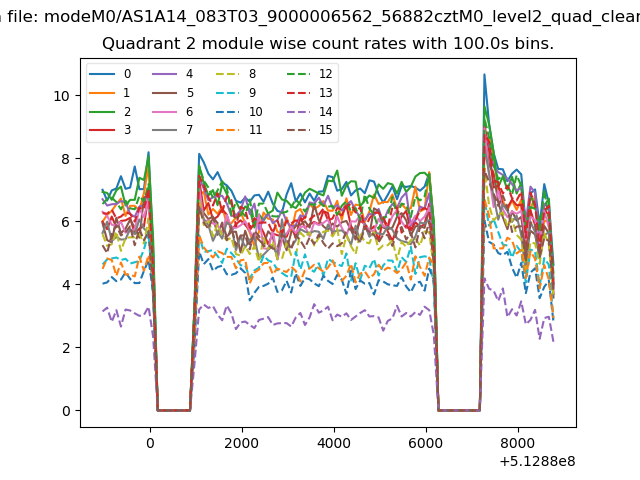
| Module-wise count rates for Quadrant B Data is divided into 100 sec bins |
 |
 |
| Module-wise count rates for Quadrant C Data is divided into 100 sec bins |
 |
 |
| Module-wise count rates for Quadrant D Data is divided into 100 sec bins |
 |
 |
| Parameter | Plot |
|---|---|
| CZT HV Monitor | 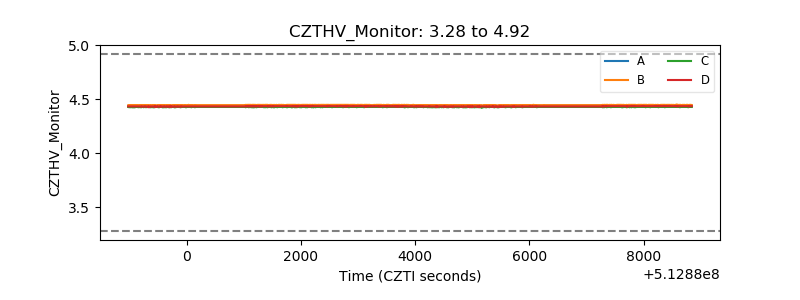 |
| D_VDD | 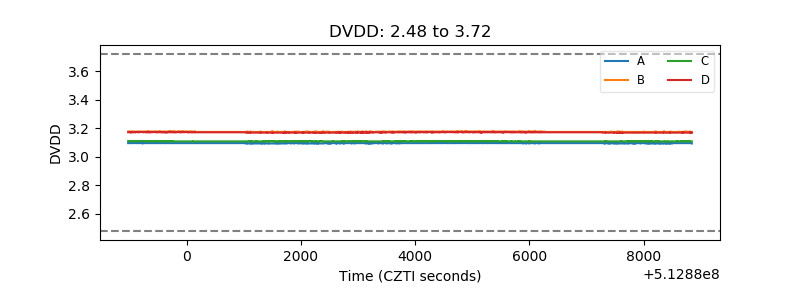 |
| Temperature 1 | 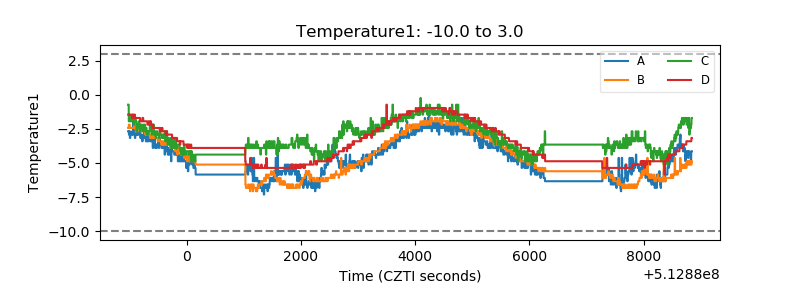 |
| Veto HV Monitor | 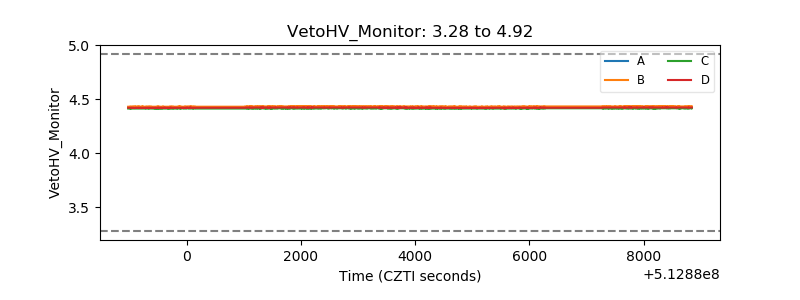 |
| Veto LLD | 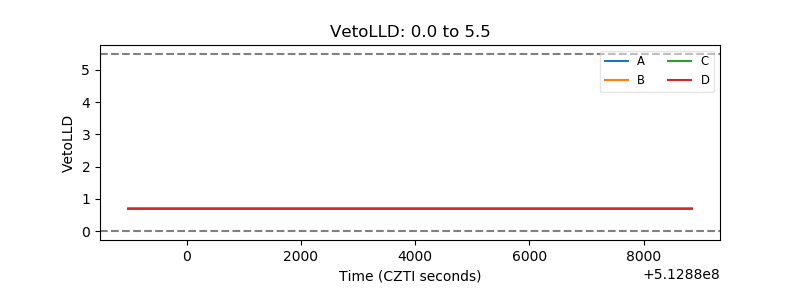 |
| Alpha Counter | 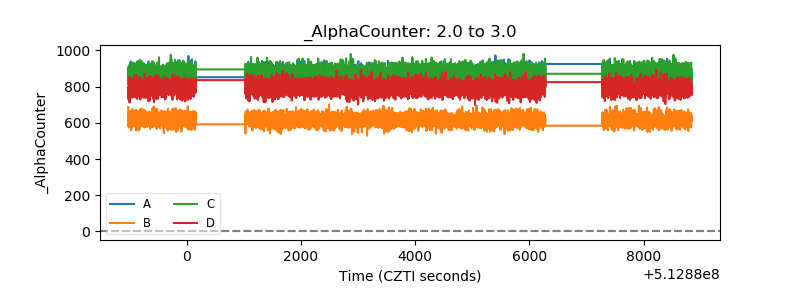 |
| _CPM_Rate | 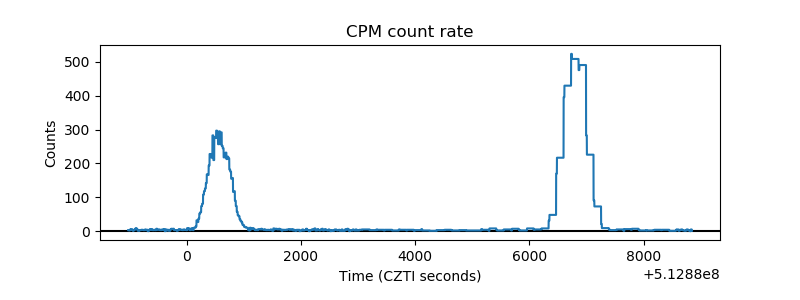 |
| CZT Counter | 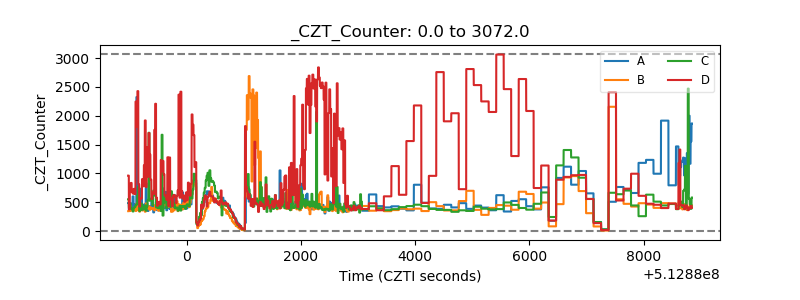 |
| +2.5 Volts monitor | 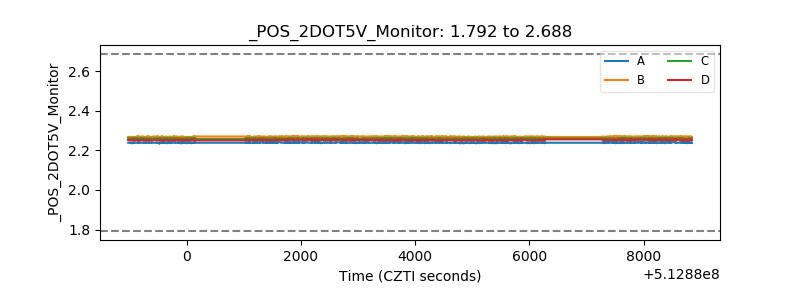 |
| +5 Volts monitor | 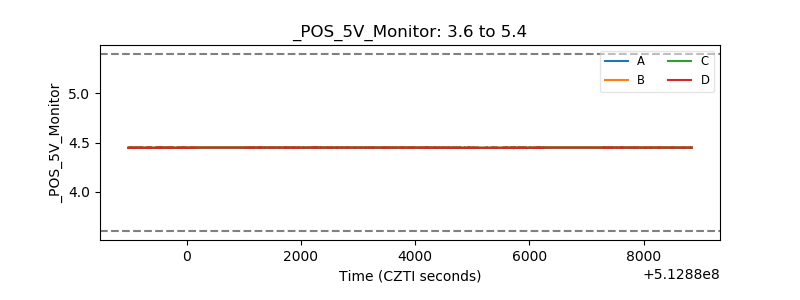 |
| _ROLL_ROT | 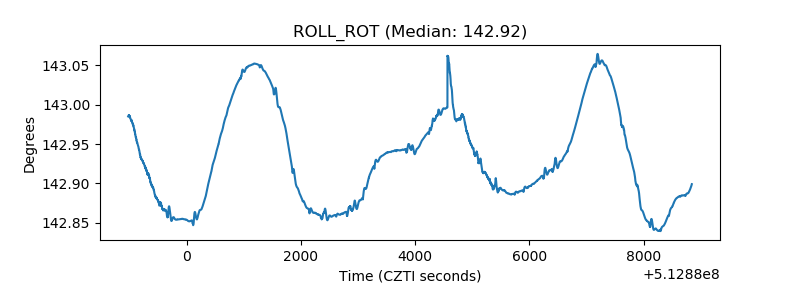 |
| _Roll_DEC | 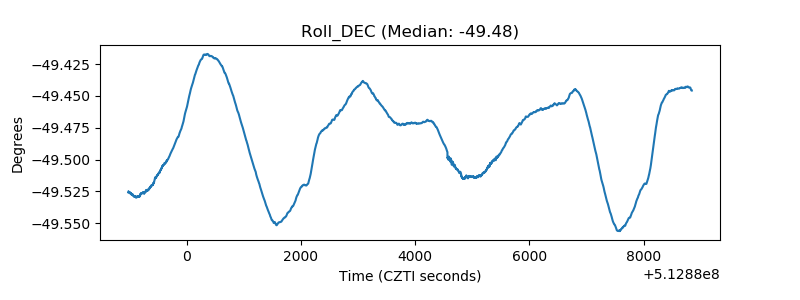 |
| _Roll_RA | 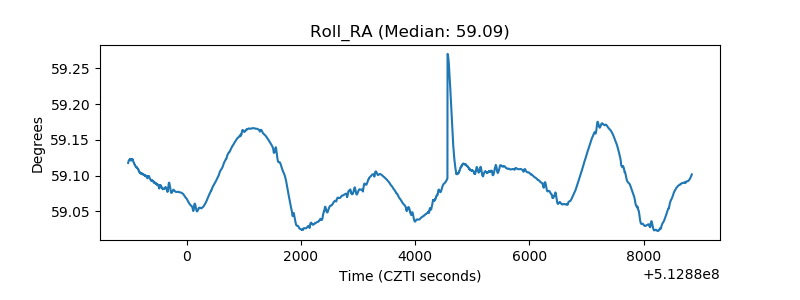 |
| Veto Counter | 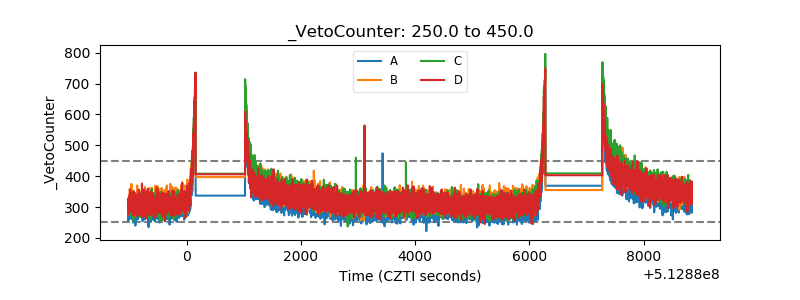 |