| Param | Original file | Final file |
|---|---|---|
| Filename | modeM0/AS1A14_083T03_9000006562_56883cztM0_level2.fits | modeM0/AS1A14_083T03_9000006562_56883cztM0_level2_quad_clean.evt |
| Size (bytes) | 934,879,680 | 169,882,560 |
| Size | 891.6 MB | 162.0 MB |
| Events in quadrant A | 7,277,674 | 1,130,974 |
| Events in quadrant B | 6,063,261 | 1,208,601 |
| Events in quadrant C | 6,202,639 | 1,104,889 |
| Events in quadrant D | 14,117,936 | 855,311 |
| Mode M9 | |||
|---|---|---|---|
| Quadrant | BADHDUFLAG | Total packets | Discarded packets |
| A | 0 | 18 | 0 |
| B | 0 | 18 | 0 |
| C | 0 | 18 | 0 |
| D | 0 | 18 | 0 |
| Mode SS | |||
|---|---|---|---|
| Quadrant | BADHDUFLAG | Total packets | Discarded packets |
| A | 0 | 250 | 0 |
| B | 0 | 250 | 0 |
| C | 0 | 250 | 0 |
| D | 0 | 250 | 0 |
| Mode M0 | |||
|---|---|---|---|
| Quadrant | BADHDUFLAG | Total packets | Discarded packets |
| A | 0 | 30528 | 2 |
| B | 0 | 27239 | 2 |
| C | 0 | 27451 | 2 |
| D | 0 | 50274 | 2 |
| Quadrant | Total seconds | Saturated seconds | Saturation percentage |
|---|---|---|---|
| A | 12195 | 400 | 3.280033% |
| B | 12196 | 415 | 3.402755% |
| C | 12196 | 222 | 1.820269% |
| D | 12196 | 2534 | 20.777304% |
Noise dominated data is calculated using 1-second bins in cleaned event files. If a bin has >2000 counts, and if more than 50% of those come from <1% of pixels, then it is considered to be noise-dominated and hence unusable.
| Quadrant | # 1 sec bins | Bins with >0 counts | Bins with >2000 counts | High rate bins dominated by noise | Noise dominated (total time) | Noise dominated (detector-on time) | Marked lightcurve |
|---|---|---|---|---|---|---|---|
| A | 14055 | 12197 | 244 | 244 | 1.74% | 2.00% | 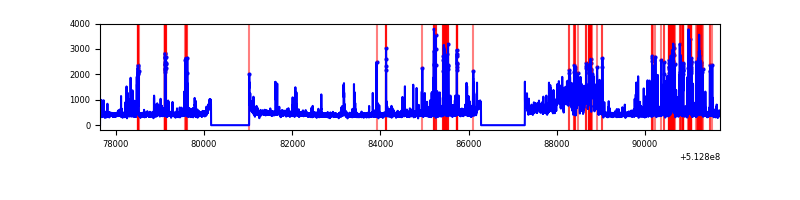 |
| B | 14056 | 12198 | 209 | 209 | 1.49% | 1.71% | 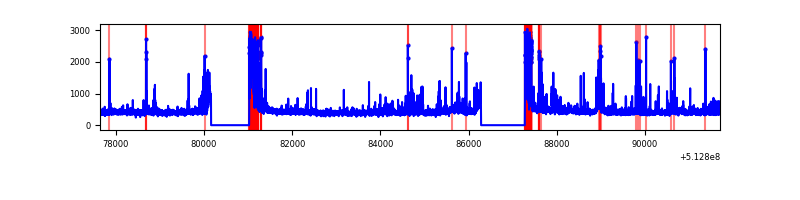 |
| C | 14056 | 12198 | 146 | 146 | 1.04% | 1.20% | 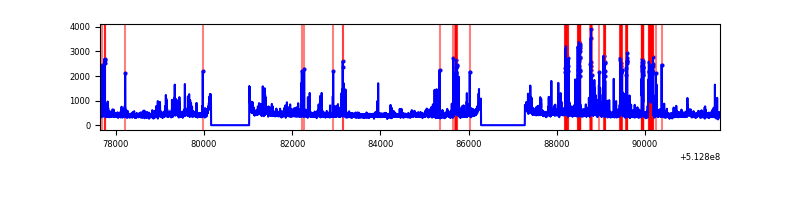 |
| D | 14056 | 12198 | 2652 | 2652 | 18.87% | 21.74% | 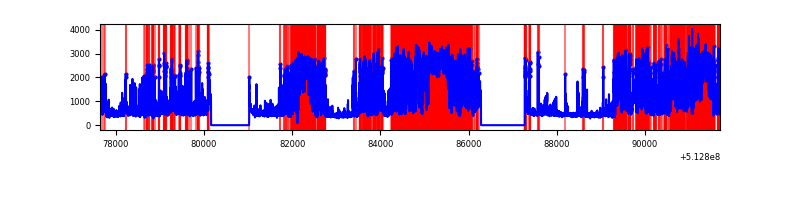 |
Top three noisy pixels from each quadrant. If the there are fewer than three noisy pixels in the level2.evt file, extra rows are filled as -1
| Pixel properties | Quadrant properties | ||||||
|---|---|---|---|---|---|---|---|
| Quadrant | DetID | PixID | Counts | Sigma | Mean | Median | Sigma |
| A | 7 | 64 | 1292130 | 4114.34 | 1274 | 1244 | 313.8 |
| A | 3 | 14 | 444910 | 1414.06 | 1274 | 1244 | 313.8 |
| A | 10 | 251 | 234036 | 741.96 | 1274 | 1244 | 313.8 |
| B | 10 | 16 | 765768 | 2899.33 | 1239 | 1195 | 263.7 |
| B | 10 | 247 | 73868 | 275.58 | 1239 | 1195 | 263.7 |
| B | 0 | 245 | 70332 | 262.17 | 1239 | 1195 | 263.7 |
| C | 13 | 3 | 790744 | 2330.01 | 1245 | 1235 | 338.8 |
| C | 14 | 254 | 123980 | 362.25 | 1245 | 1235 | 338.8 |
| C | 11 | 244 | 85487 | 248.65 | 1245 | 1235 | 338.8 |
| D | 2 | 249 | 4579649 | 14239.98 | 1144 | 1092 | 321.5 |
| D | 8 | 240 | 2450203 | 7617.09 | 1144 | 1092 | 321.5 |
| D | 8 | 160 | 1367109 | 4248.51 | 1144 | 1092 | 321.5 |
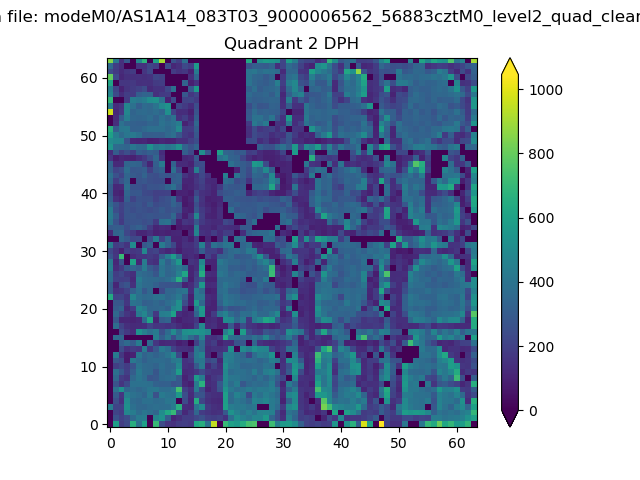
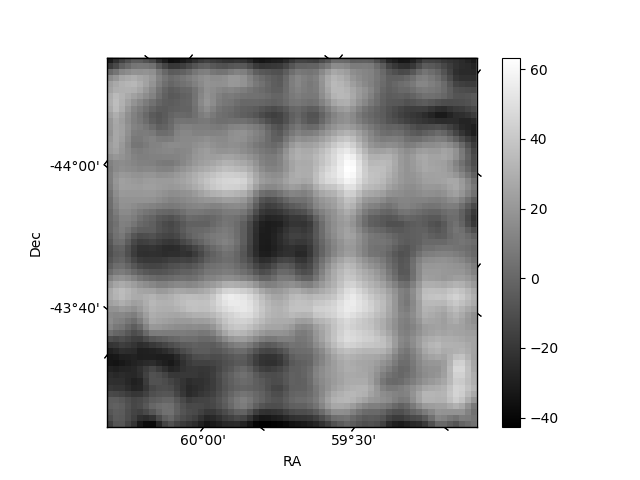
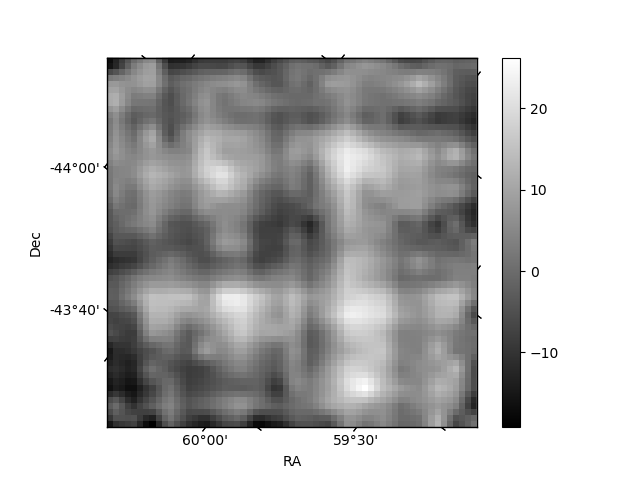
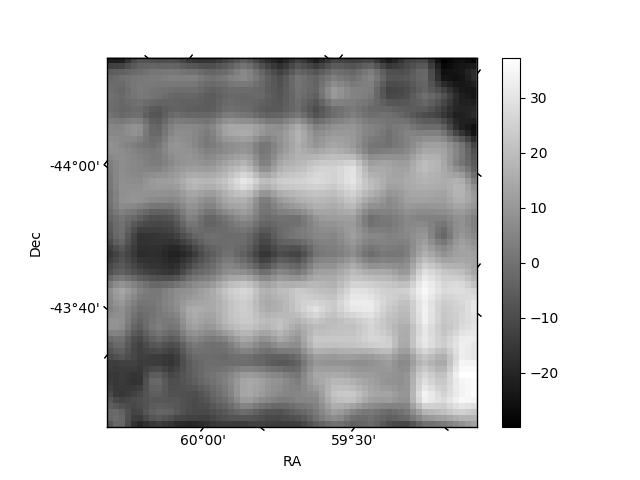
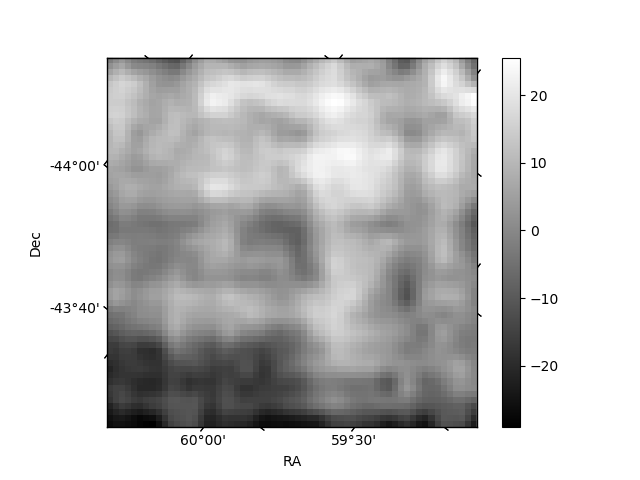
Histogram calculated using DETX and DETY for each event in the final _common_clean file
| Quadrant A | 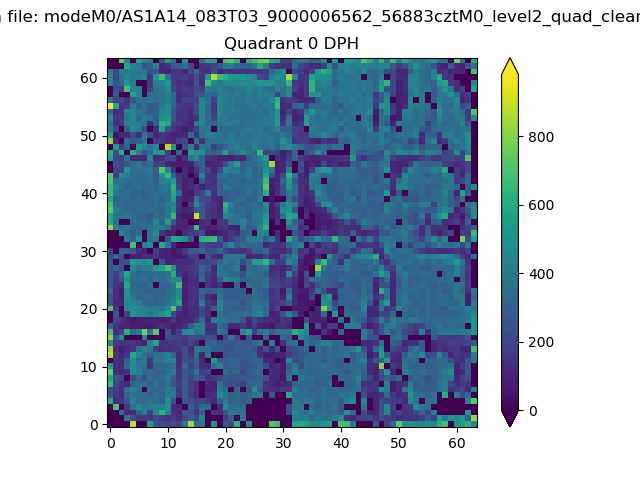 |
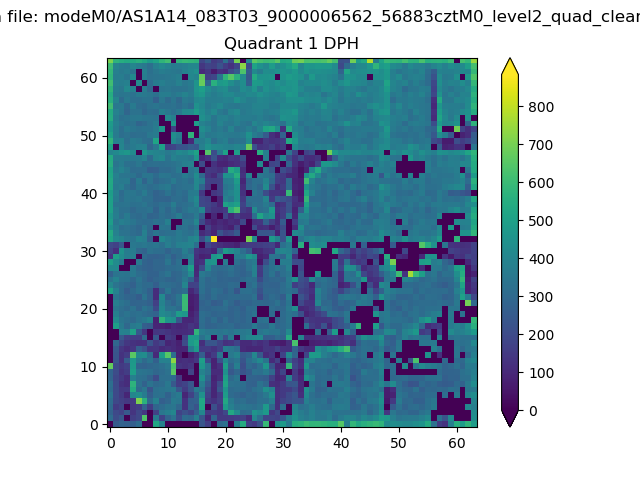 |
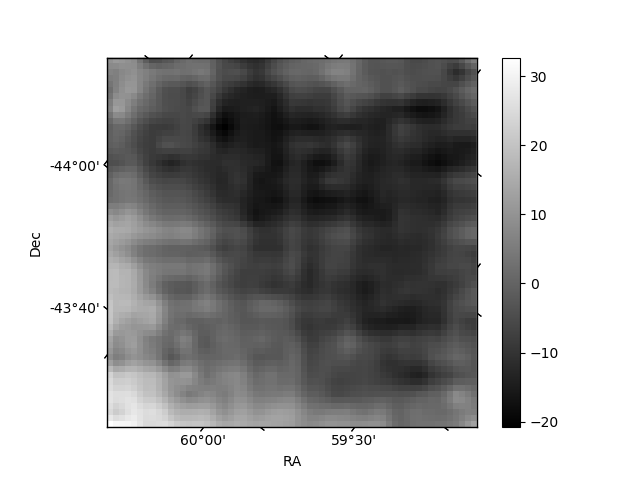
Quadrant B |
|---|---|---|---|
| Quadrant D | 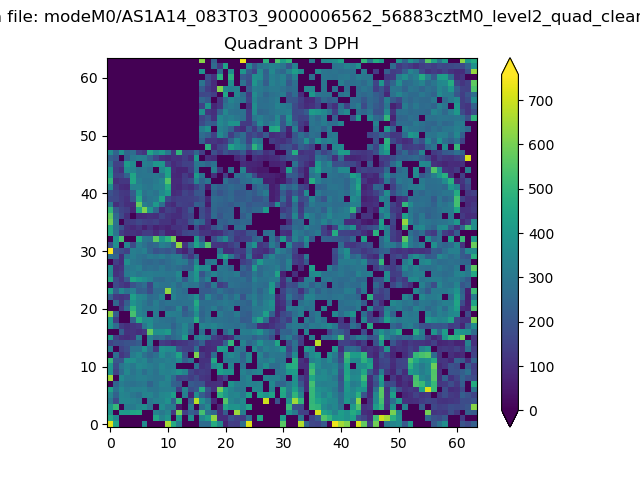 |
 |
Quadrant C |
| Plot type | Count rate plots | Images |
|---|---|---|
| Comparison with Poisson distribution Blue bars denote a histogram of data divided into 1 sec bins. Red curve is a Poisson curve with rate = median count rate of data. |
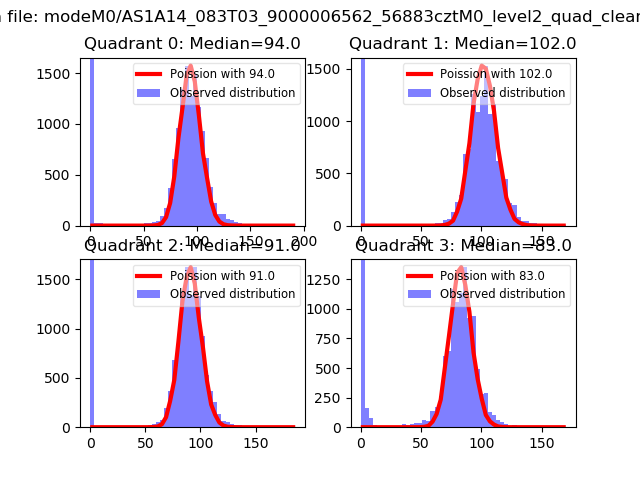 |
 |
| Quadrant-wise count rates Data is divided into 100 sec bins |
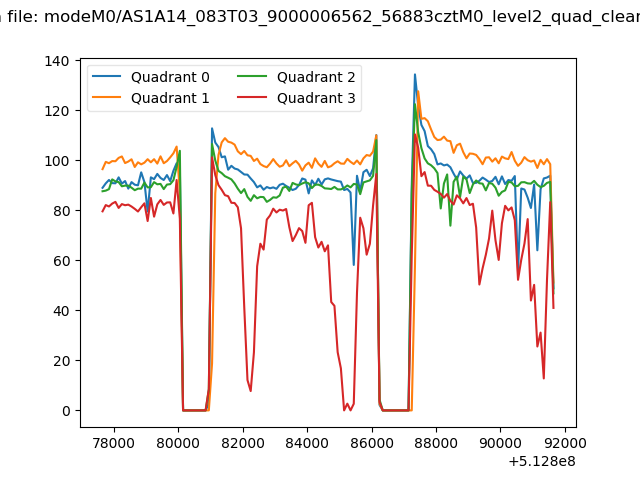 |
|
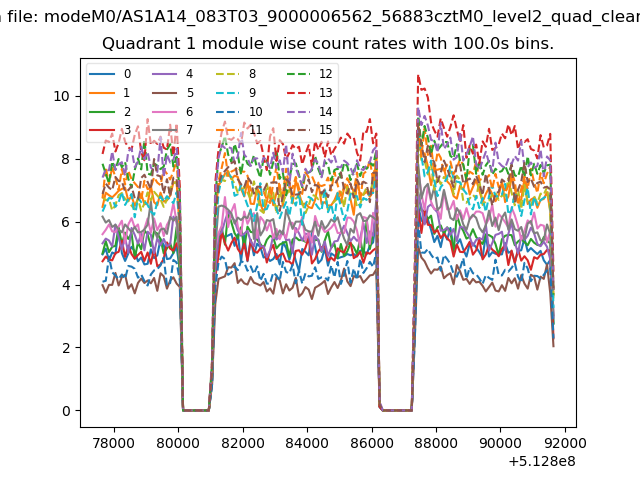
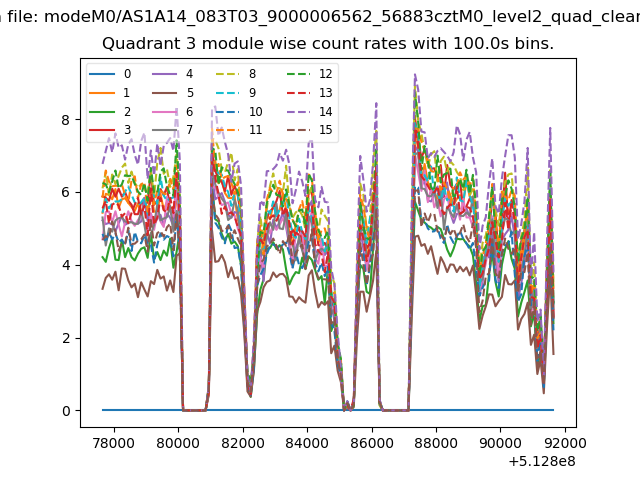
| Module-wise count rates for Quadrant A Data is divided into 100 sec bins |
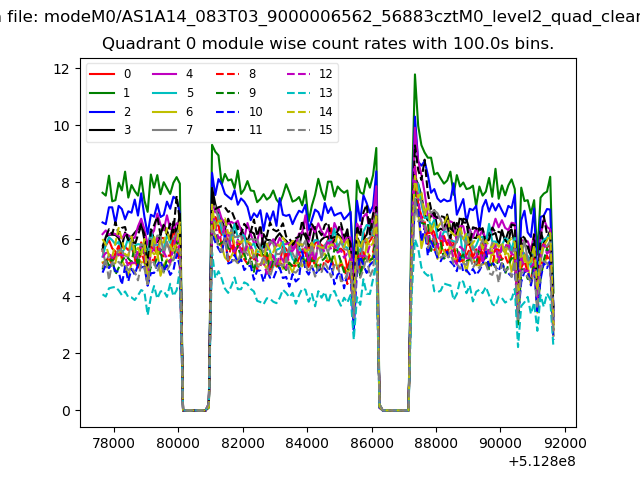 |
 |
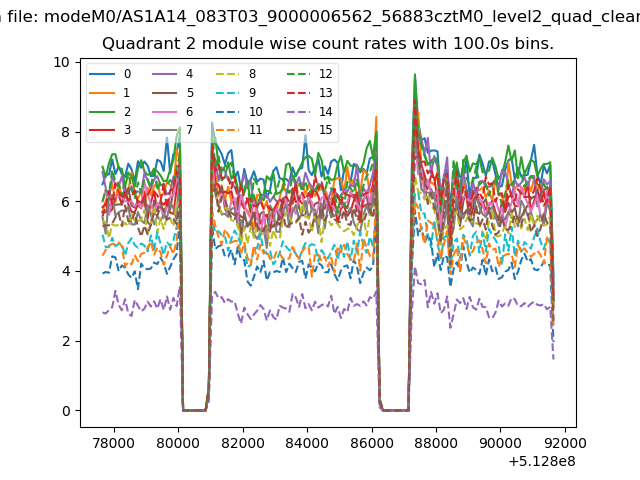
| Module-wise count rates for Quadrant B Data is divided into 100 sec bins |
 |
 |
| Module-wise count rates for Quadrant C Data is divided into 100 sec bins |
 |
 |
| Module-wise count rates for Quadrant D Data is divided into 100 sec bins |
 |
 |
| Parameter | Plot |
|---|---|
| CZT HV Monitor |  |
| D_VDD | 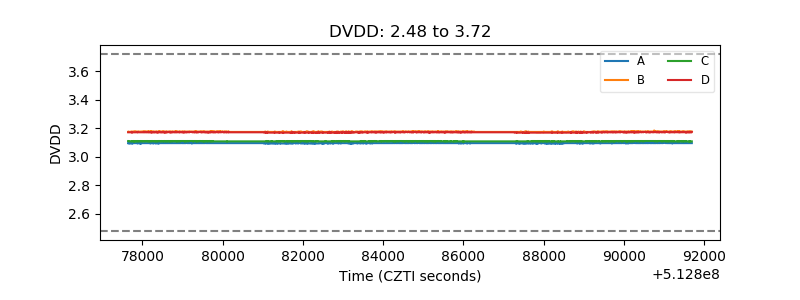 |
| Temperature 1 | 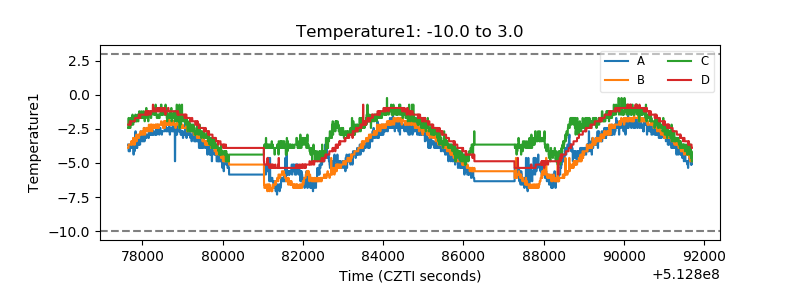 |
| Veto HV Monitor | 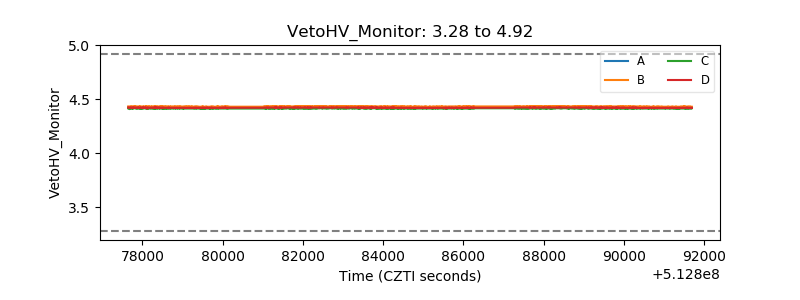 |
| Veto LLD | 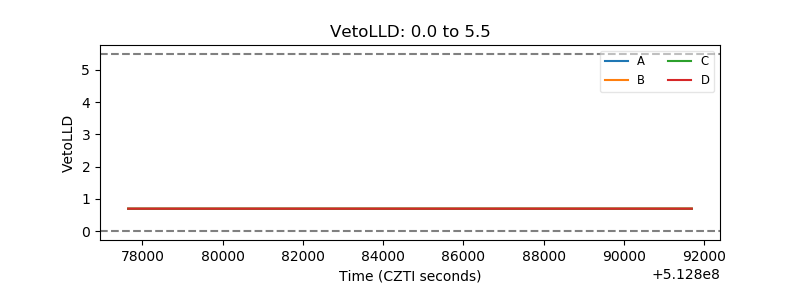 |
| Alpha Counter | 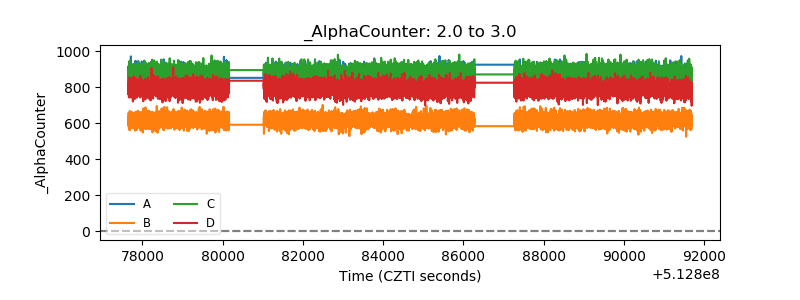 |
| _CPM_Rate | 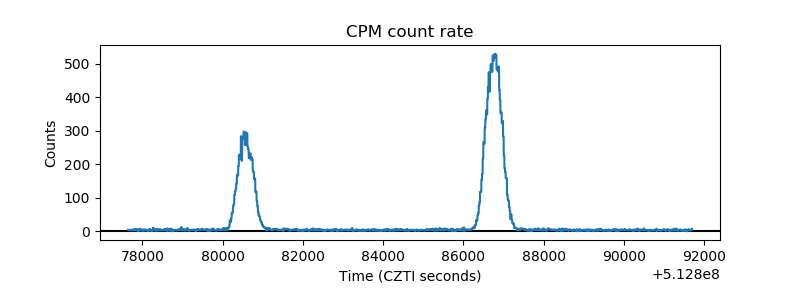 |
| CZT Counter | 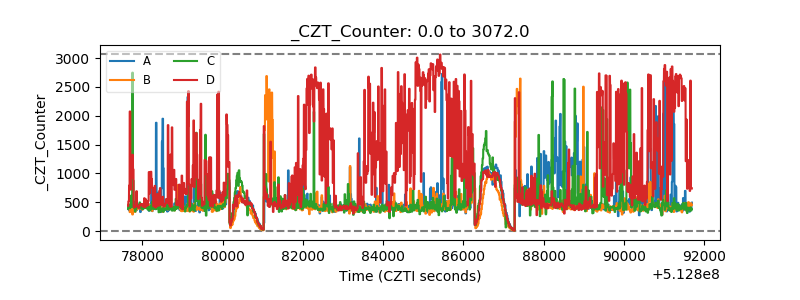 |
| +2.5 Volts monitor | 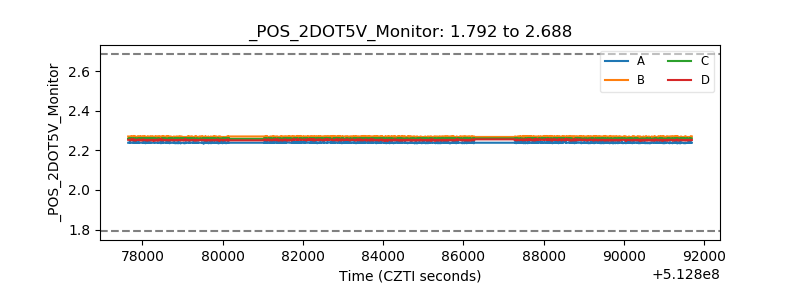 |
| +5 Volts monitor | 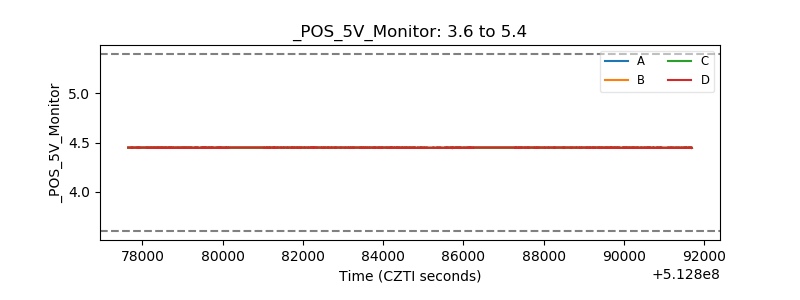 |
| _ROLL_ROT | 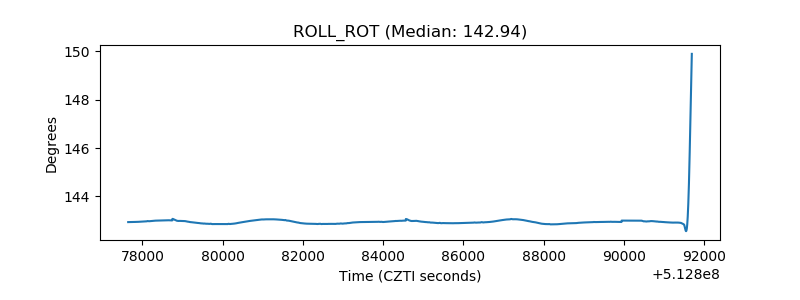 |
| _Roll_DEC | 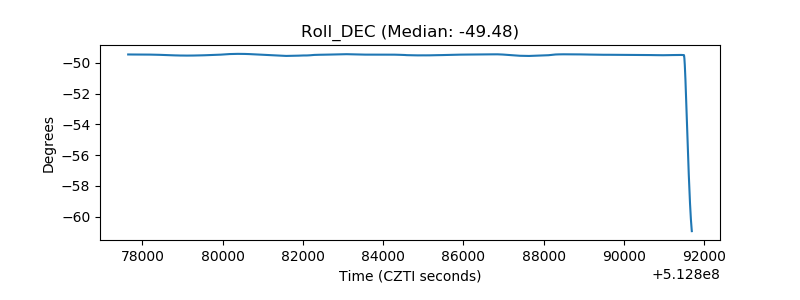 |
| _Roll_RA | 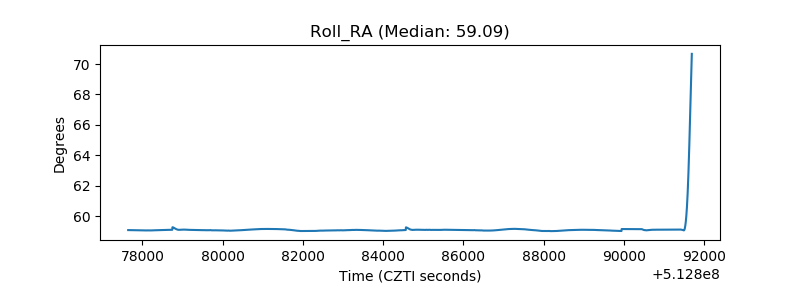 |
| Veto Counter | 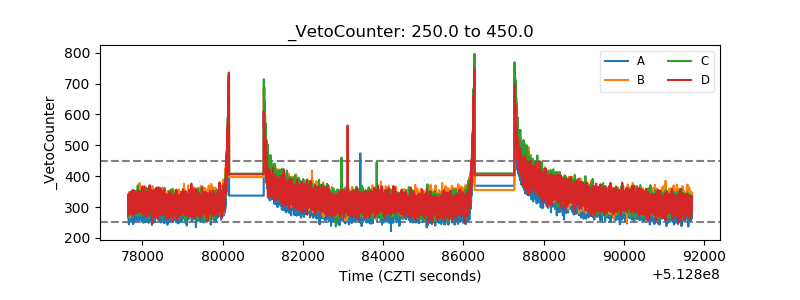 |