| Param | Original file | Final file |
|---|---|---|
| Filename | modeM0/AS1A14_083T03_9000006562_56884cztM0_level2.fits | modeM0/AS1A14_083T03_9000006562_56884cztM0_level2_quad_clean.evt |
| Size (bytes) | 612,259,200 | 100,604,160 |
| Size | 583.9 MB | 95.9 MB |
| Events in quadrant A | 4,876,094 | 673,682 |
| Events in quadrant B | 3,584,131 | 725,934 |
| Events in quadrant C | 3,832,913 | 663,393 |
| Events in quadrant D | 9,808,728 | 479,241 |
| Mode M9 | |||
|---|---|---|---|
| Quadrant | BADHDUFLAG | Total packets | Discarded packets |
| A | 0 | 10 | 0 |
| B | 0 | 10 | 0 |
| C | 0 | 10 | 0 |
| D | 0 | 10 | 0 |
| Mode SS | |||
|---|---|---|---|
| Quadrant | BADHDUFLAG | Total packets | Discarded packets |
| A | 0 | 146 | 0 |
| B | 0 | 146 | 0 |
| C | 0 | 146 | 0 |
| D | 0 | 146 | 0 |
| Mode M0 | |||
|---|---|---|---|
| Quadrant | BADHDUFLAG | Total packets | Discarded packets |
| A | 0 | 19753 | 1 |
| B | 0 | 16058 | 1 |
| C | 0 | 16760 | 1 |
| D | 0 | 34072 | 1 |
| Quadrant | Total seconds | Saturated seconds | Saturation percentage |
|---|---|---|---|
| A | 7240 | 320 | 4.419890% |
| B | 7241 | 207 | 2.858721% |
| C | 7241 | 163 | 2.251070% |
| D | 7241 | 1957 | 27.026654% |
Noise dominated data is calculated using 1-second bins in cleaned event files. If a bin has >2000 counts, and if more than 50% of those come from <1% of pixels, then it is considered to be noise-dominated and hence unusable.
| Quadrant | # 1 sec bins | Bins with >0 counts | Bins with >2000 counts | High rate bins dominated by noise | Noise dominated (total time) | Noise dominated (detector-on time) | Marked lightcurve |
|---|---|---|---|---|---|---|---|
| A | 8235 | 7241 | 213 | 213 | 2.59% | 2.94% | 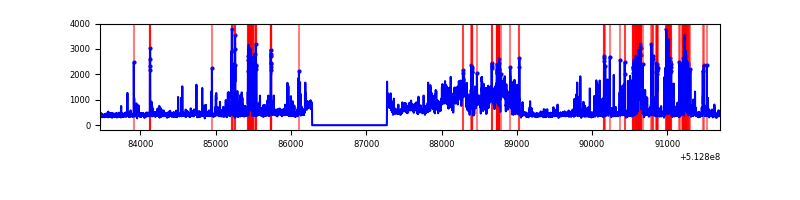 |
| B | 8236 | 7242 | 103 | 103 | 1.25% | 1.42% | 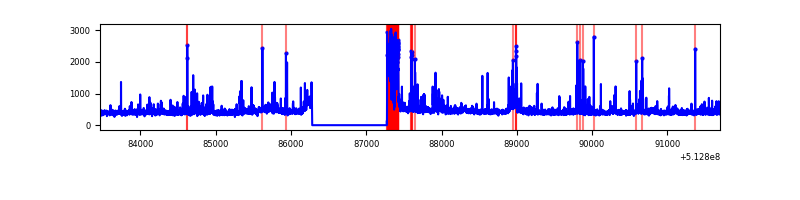 |
| C | 8236 | 7242 | 135 | 135 | 1.64% | 1.86% | 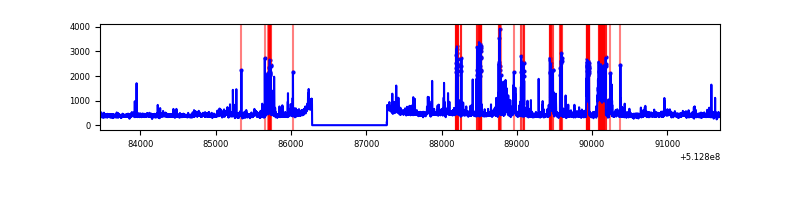 |
| D | 8236 | 7242 | 2117 | 2117 | 25.70% | 29.23% | 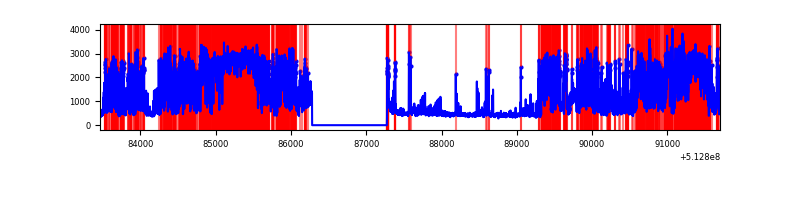 |
Top three noisy pixels from each quadrant. If the there are fewer than three noisy pixels in the level2.evt file, extra rows are filled as -1
| Pixel properties | Quadrant properties | ||||||
|---|---|---|---|---|---|---|---|
| Quadrant | DetID | PixID | Counts | Sigma | Mean | Median | Sigma |
| A | 7 | 64 | 1290279 | 6998.64 | 749 | 733 | 184.3 |
| A | 3 | 62 | 208872 | 1129.62 | 749 | 733 | 184.3 |
| A | 10 | 251 | 204991 | 1108.55 | 749 | 733 | 184.3 |
| B | 10 | 16 | 399492 | 2527.89 | 735 | 707 | 157.8 |
| B | 10 | 247 | 55196 | 345.41 | 735 | 707 | 157.8 |
| B | 0 | 245 | 46566 | 290.7 | 735 | 707 | 157.8 |
| C | 13 | 3 | 685182 | 3417.02 | 733 | 725 | 200.3 |
| C | 14 | 254 | 76427 | 377.93 | 733 | 725 | 200.3 |
| C | 11 | 244 | 73794 | 364.78 | 733 | 725 | 200.3 |
| D | 2 | 249 | 4381082 | 23695.44 | 654 | 625 | 184.9 |
| D | 8 | 160 | 1182500 | 6393.18 | 654 | 625 | 184.9 |
| D | 8 | 240 | 719130 | 3886.65 | 654 | 625 | 184.9 |
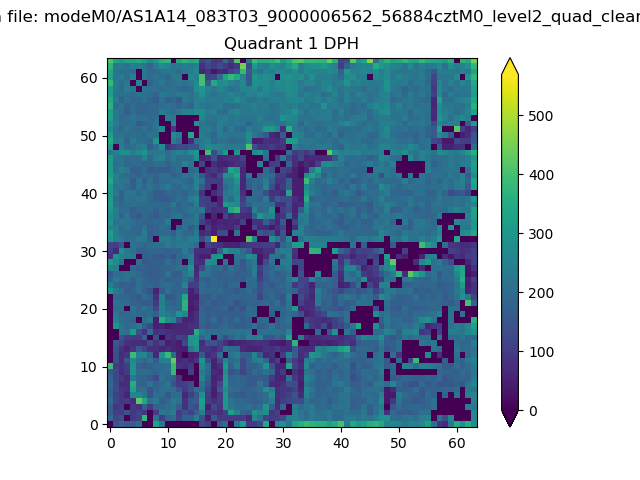
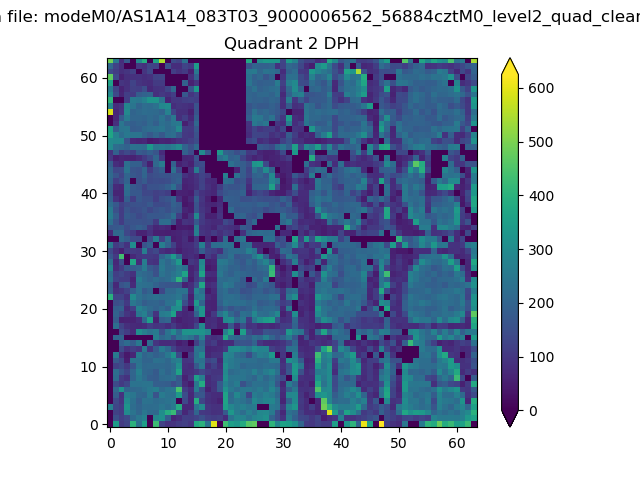
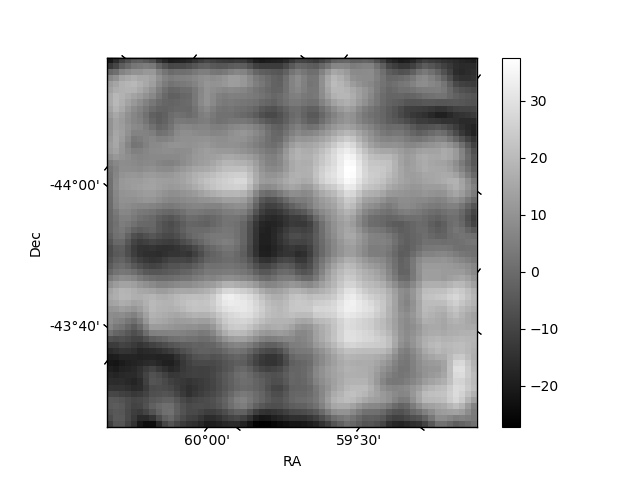
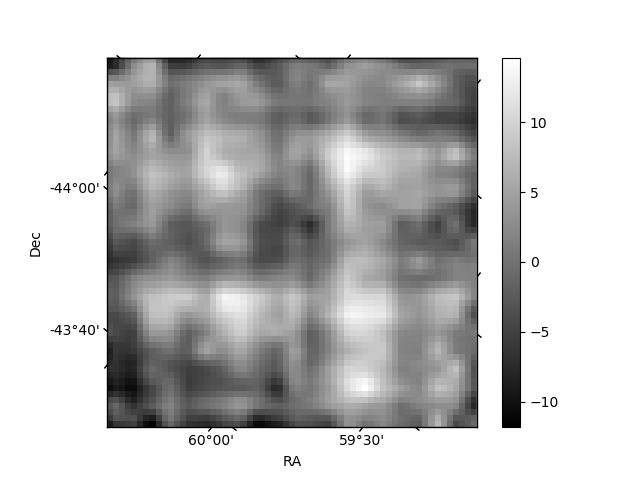
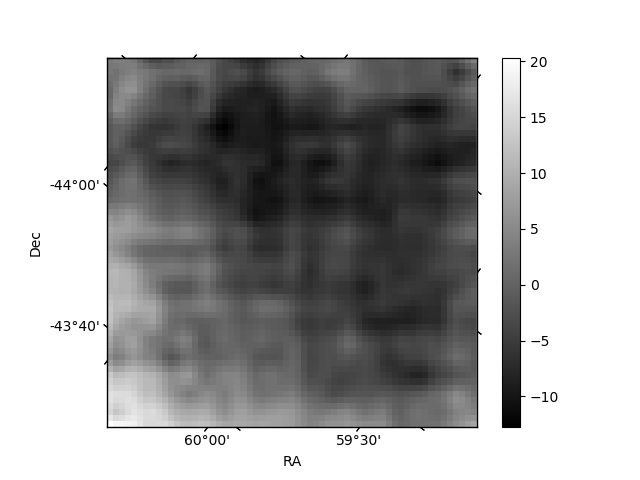
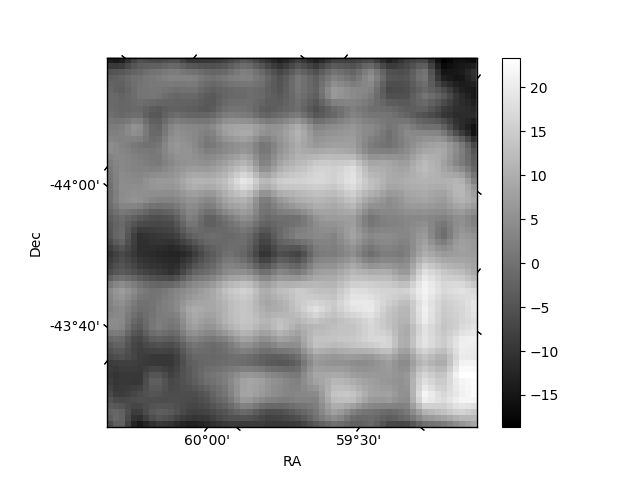
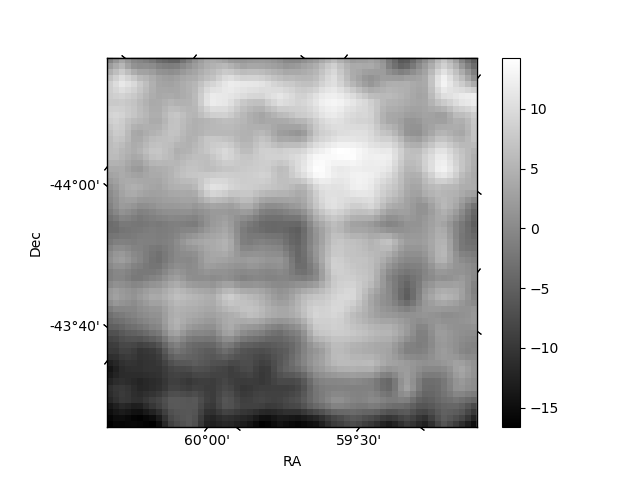
Histogram calculated using DETX and DETY for each event in the final _common_clean file
| Quadrant A |  |
 |
Quadrant B |
|---|---|---|---|
| Quadrant D | 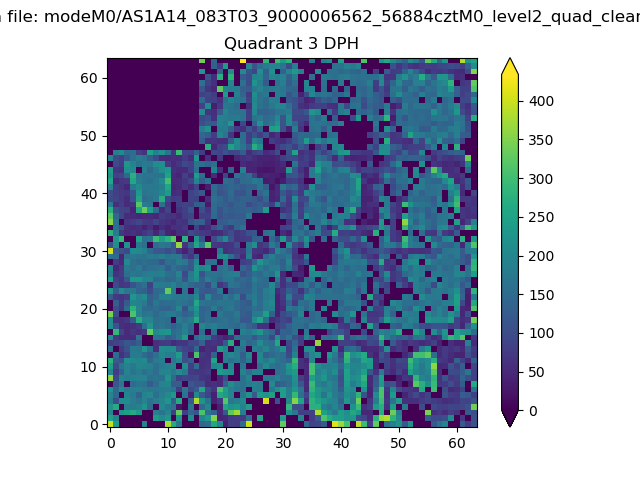 |
 |
Quadrant C |
| Plot type | Count rate plots | Images |
|---|---|---|
| Comparison with Poisson distribution Blue bars denote a histogram of data divided into 1 sec bins. Red curve is a Poisson curve with rate = median count rate of data. |
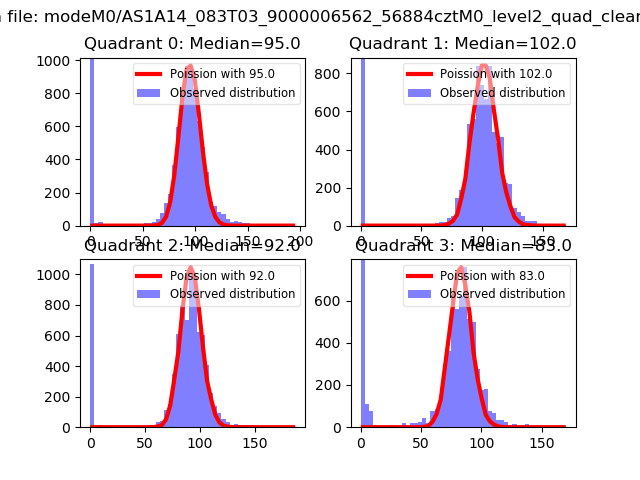 |
 |
| Quadrant-wise count rates Data is divided into 100 sec bins |
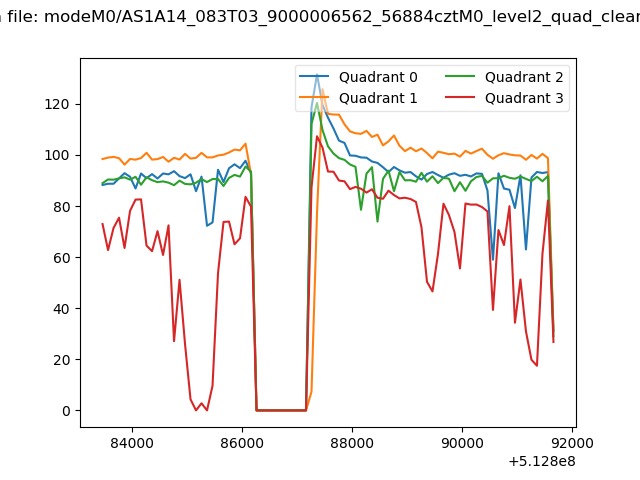 |
|
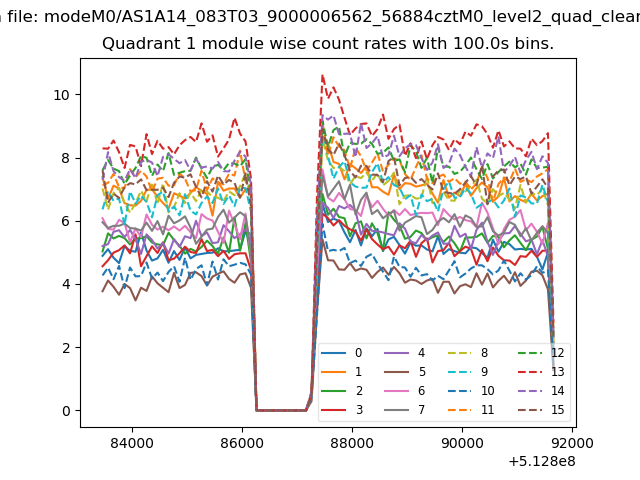
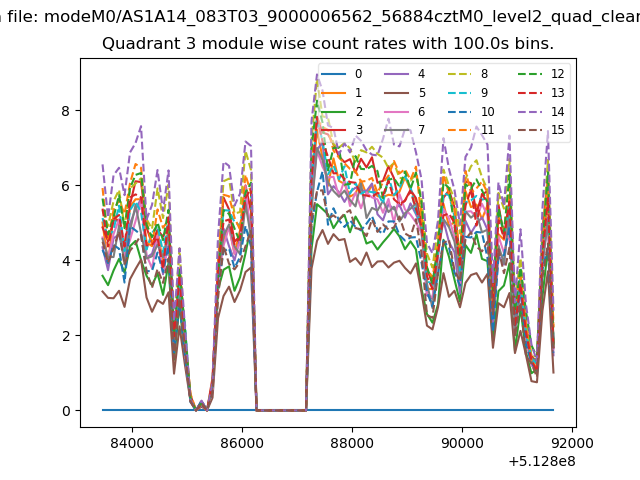
| Module-wise count rates for Quadrant A Data is divided into 100 sec bins |
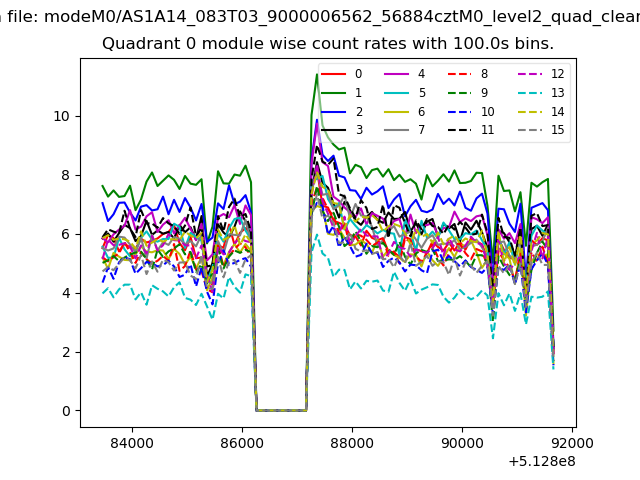 |
 |
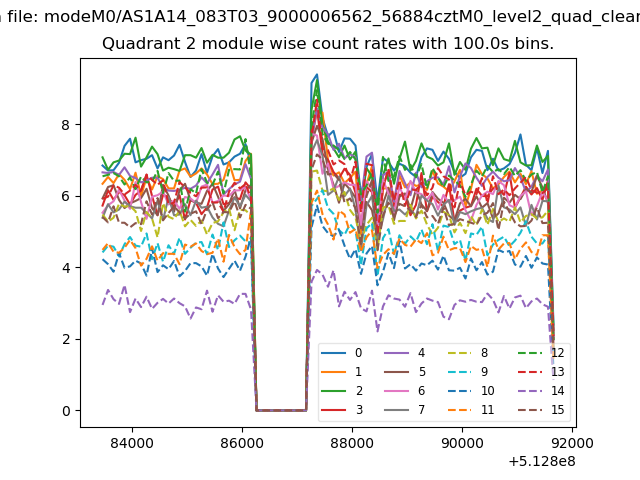
| Module-wise count rates for Quadrant B Data is divided into 100 sec bins |
 |
 |
| Module-wise count rates for Quadrant C Data is divided into 100 sec bins |
 |
 |
| Module-wise count rates for Quadrant D Data is divided into 100 sec bins |
 |
 |
| Parameter | Plot |
|---|---|
| CZT HV Monitor | 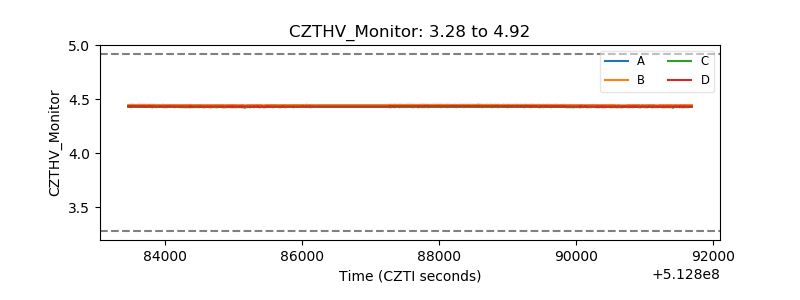 |
| D_VDD | 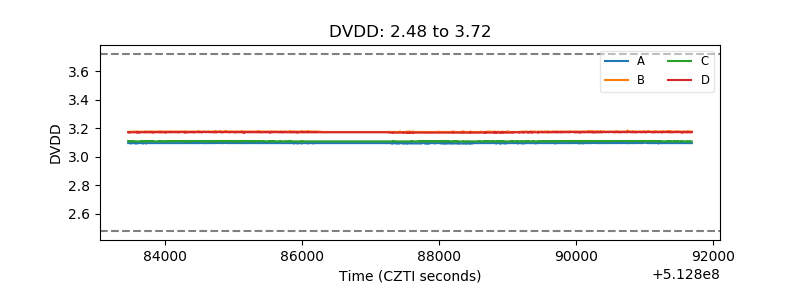 |
| Temperature 1 | 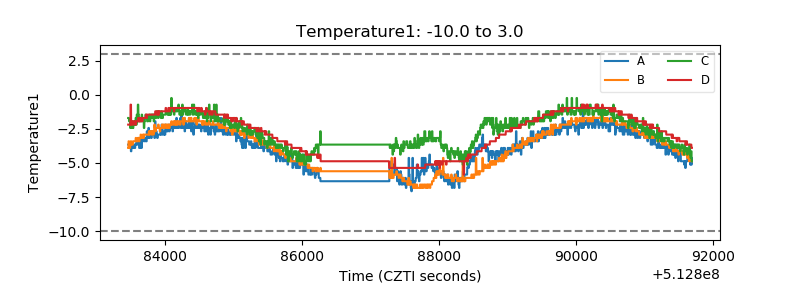 |
| Veto HV Monitor | 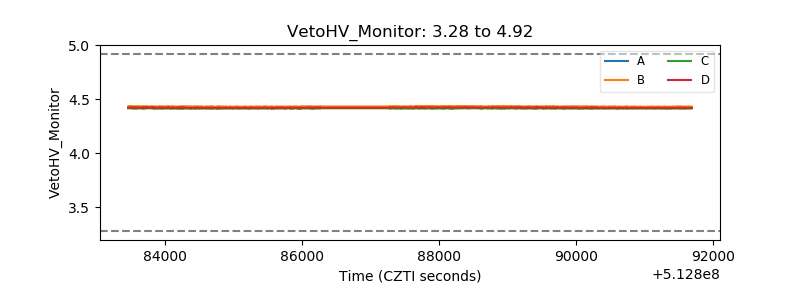 |
| Veto LLD | 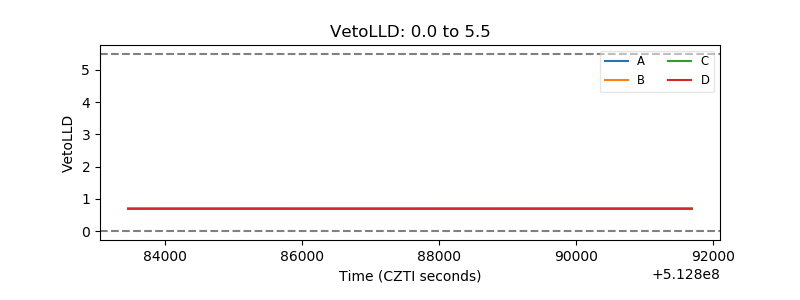 |
| Alpha Counter | 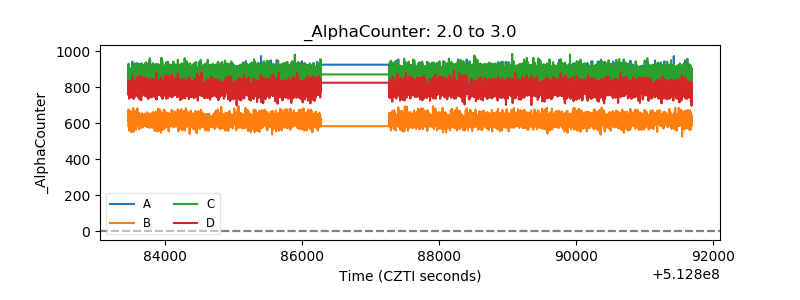 |
| _CPM_Rate | 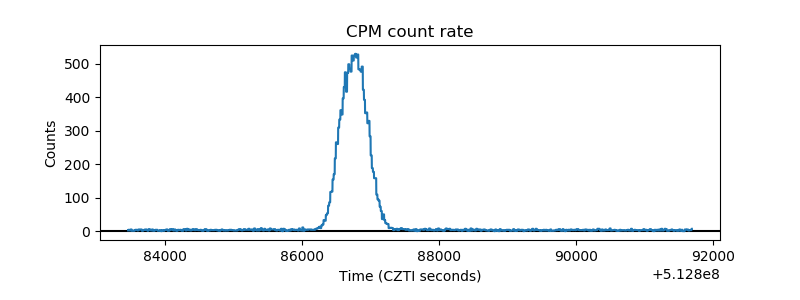 |
| CZT Counter | 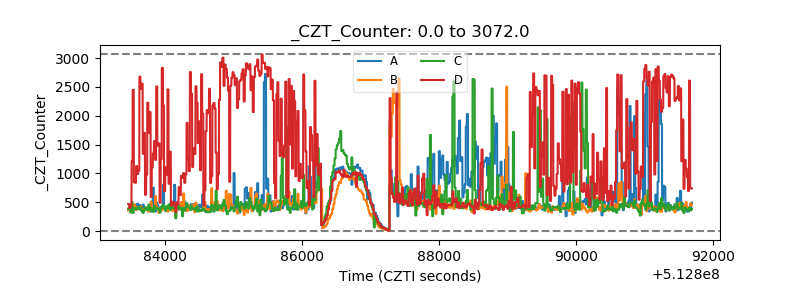 |
| +2.5 Volts monitor | 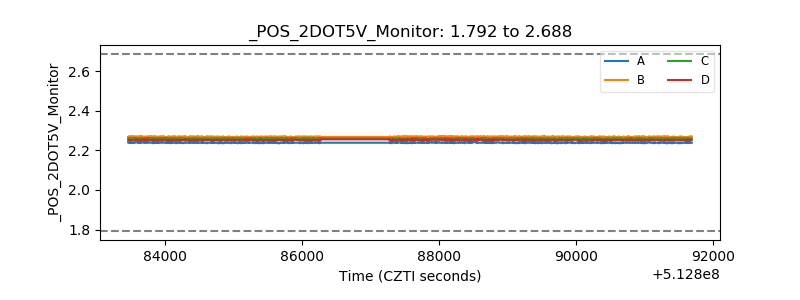 |
| +5 Volts monitor | 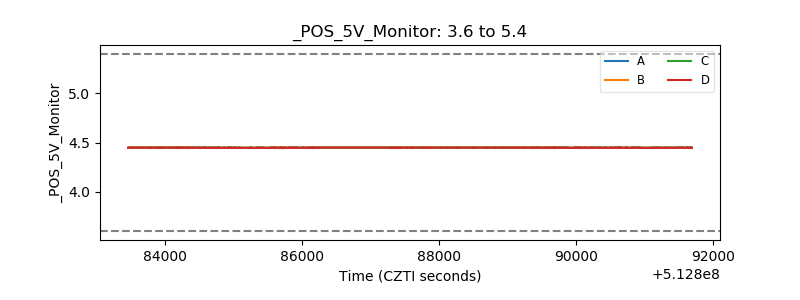 |
| _ROLL_ROT | 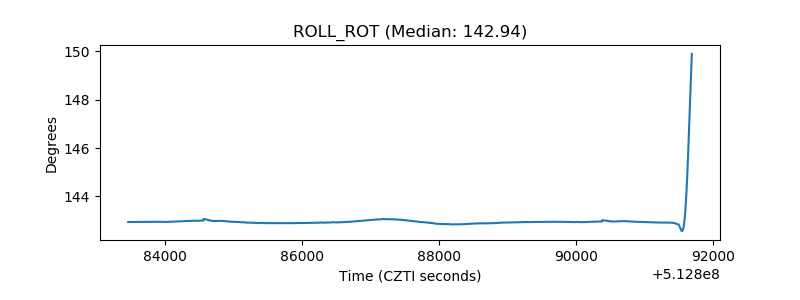 |
| _Roll_DEC | 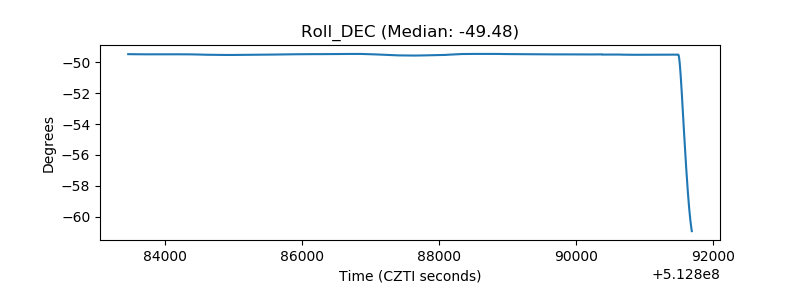 |
| _Roll_RA | 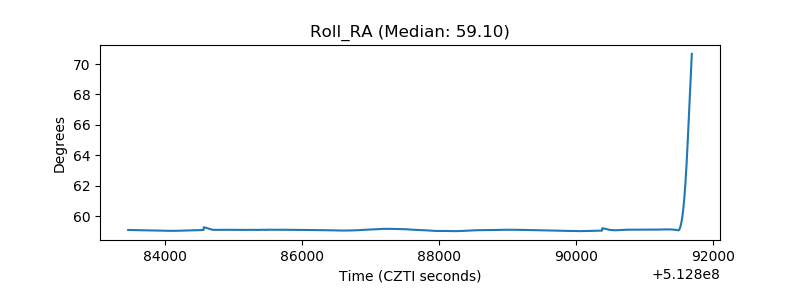 |
| Veto Counter | 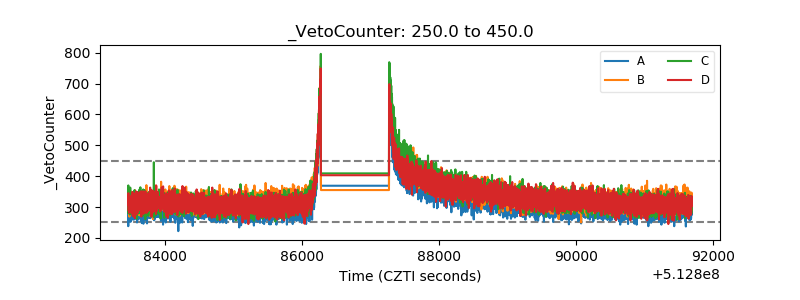 |