| Param | Original file | Final file |
|---|---|---|
| Filename | modeM0/AS1A14_083T14_9000006564cztM0_level2.fits | modeM0/AS1A14_083T14_9000006564cztM0_level2_quad_clean.evt |
| Size (bytes) | 3,140,447,040 | 1,904,883,840 |
| Size | 2.9 GB | 1.8 GB |
| Events in quadrant A | 18,938,158 | 8,287,881 |
| Events in quadrant B | 17,595,198 | 8,943,117 |
| Events in quadrant C | 18,380,744 | 7,605,214 |
| Events in quadrant D | 12,822,334 | 5,591,984 |
| Mode SS | |||
|---|---|---|---|
| Quadrant | BADHDUFLAG | Total packets | Discarded packets |
| A | 0 | 8070 | 0 |
| B | 0 | 8074 | 0 |
| C | 0 | 8076 | 0 |
| D | 0 | 8074 | 0 |
| Mode M9 | |||
|---|---|---|---|
| Quadrant | BADHDUFLAG | Total packets | Discarded packets |
| A | 0 | 472 | 0 |
| B | 0 | 472 | 0 |
| C | 0 | 472 | 0 |
| D | 0 | 472 | 0 |
| Mode M0 | |||
|---|---|---|---|
| Quadrant | BADHDUFLAG | Total packets | Discarded packets |
| A | 0 | 1166832 | 0 |
| B | 0 | 1181121 | 0 |
| C | 0 | 1171283 | 0 |
| D | 0 | 1884994 | 0 |
| Quadrant | Total seconds | Saturated seconds | Saturation percentage |
|---|---|---|---|
| A | 397815 | 37473 | 9.419705% |
| B | 397768 | 40736 | 10.241146% |
| C | 397681 | 37707 | 9.481720% |
| D | 397712 | 159639 | 40.139347% |
Noise dominated data is calculated using 1-second bins in cleaned event files. If a bin has >2000 counts, and if more than 50% of those come from <1% of pixels, then it is considered to be noise-dominated and hence unusable.
| Quadrant | # 1 sec bins | Bins with >0 counts | Bins with >2000 counts | High rate bins dominated by noise | Noise dominated (total time) | Noise dominated (detector-on time) | Marked lightcurve |
|---|---|---|---|---|---|---|---|
| A | 937393 | 396335 | 0 | 0 | 0.00% | 0.00% | 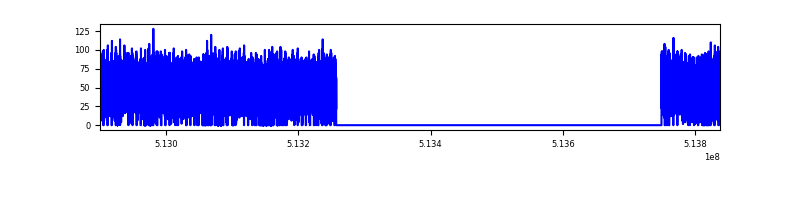 |
| B | 937392 | 396004 | 0 | 0 | 0.00% | 0.00% | 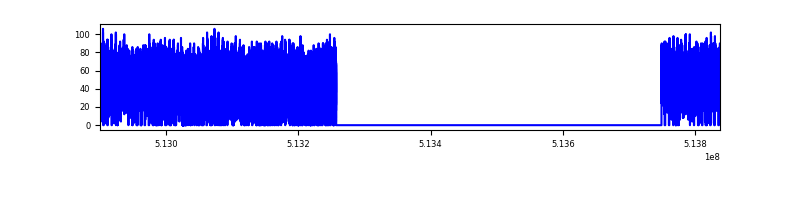 |
| C | 937394 | 396757 | 0 | 0 | 0.00% | 0.00% | 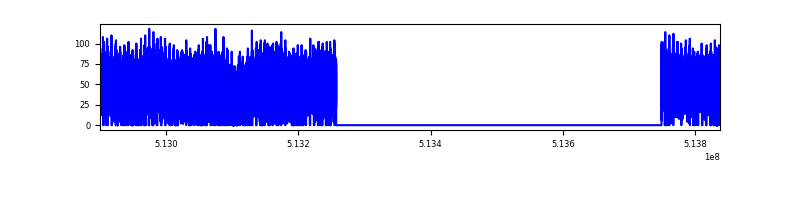 |
| D | 937394 | 393429 | 0 | 0 | 0.00% | 0.00% | 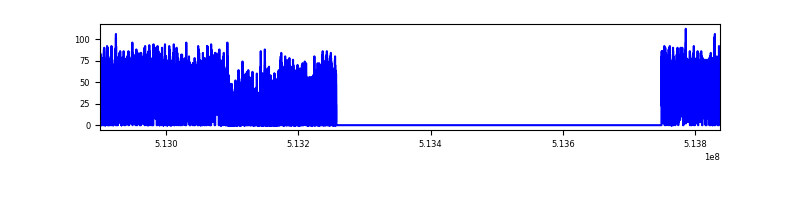 |
Top three noisy pixels from each quadrant. If the there are fewer than three noisy pixels in the level2.evt file, extra rows are filled as -1
| Pixel properties | Quadrant properties | ||||||
|---|---|---|---|---|---|---|---|
| Quadrant | DetID | PixID | Counts | Sigma | Mean | Median | Sigma |
| A | 14 | 188 | 21903 | 10.35 | 4978 | 4598 | 1672.6 |
| A | 9 | 255 | 19041 | 8.63 | 4978 | 4598 | 1672.6 |
| A | 14 | 204 | 18167 | 8.11 | 4978 | 4598 | 1672.6 |
| B | 2 | 9 | 20765 | 15.09 | 4668 | 4428 | 1082.4 |
| B | 2 | 8 | 18360 | 12.87 | 4668 | 4428 | 1082.4 |
| B | 3 | 25 | 14604 | 9.4 | 4668 | 4428 | 1082.4 |
| C | 15 | 175 | 15850 | 6.73 | 4920 | 4485 | 1688.8 |
| C | 2 | 31 | 14832 | 6.13 | 4920 | 4485 | 1688.8 |
| C | 15 | 127 | 14529 | 5.95 | 4920 | 4485 | 1688.8 |
| D | 6 | 218 | 16002 | 10.22 | 3669 | 3252 | 1247.3 |
| D | 15 | 11 | 12376 | 7.31 | 3669 | 3252 | 1247.3 |
| D | 8 | 12 | 12175 | 7.15 | 3669 | 3252 | 1247.3 |
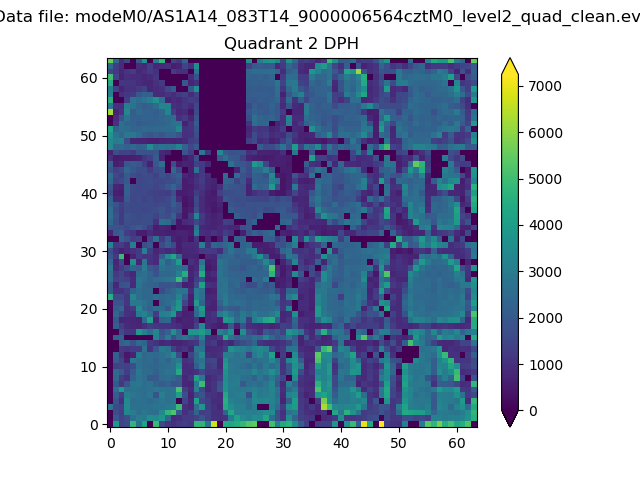
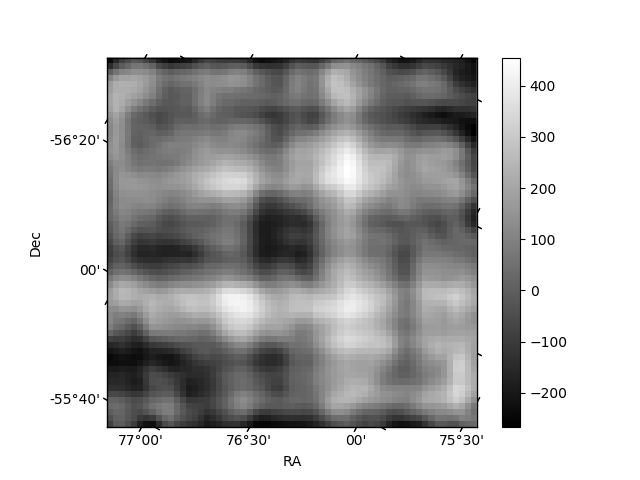
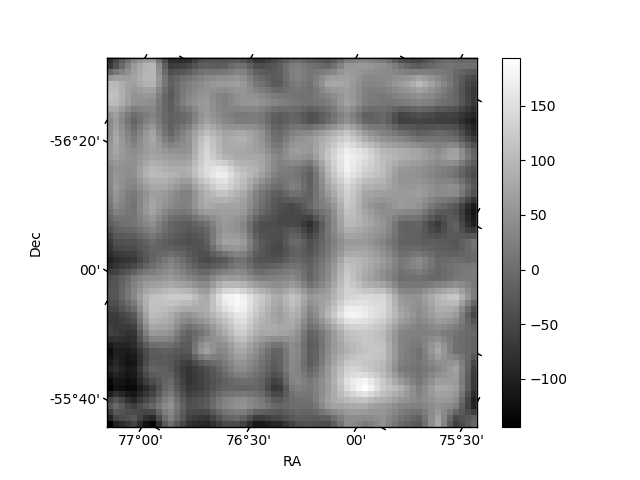
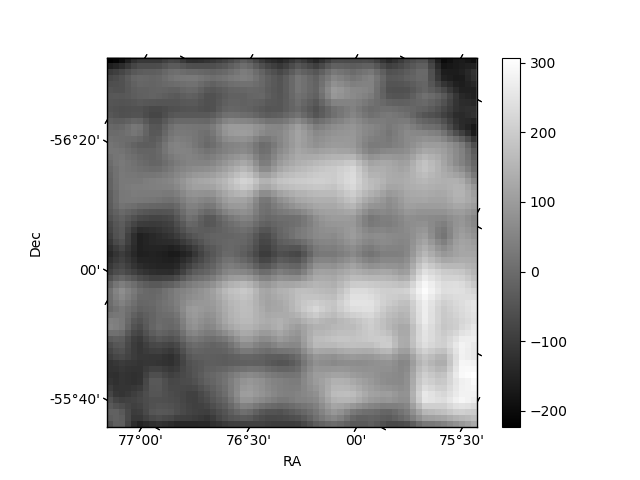
Histogram calculated using DETX and DETY for each event in the final _common_clean file
| Quadrant A | 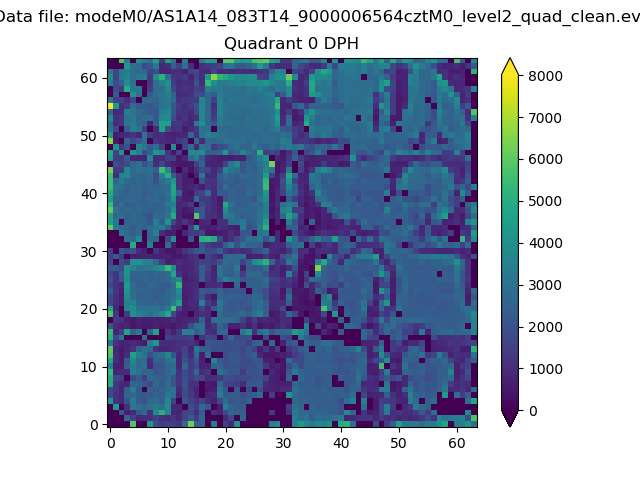 |
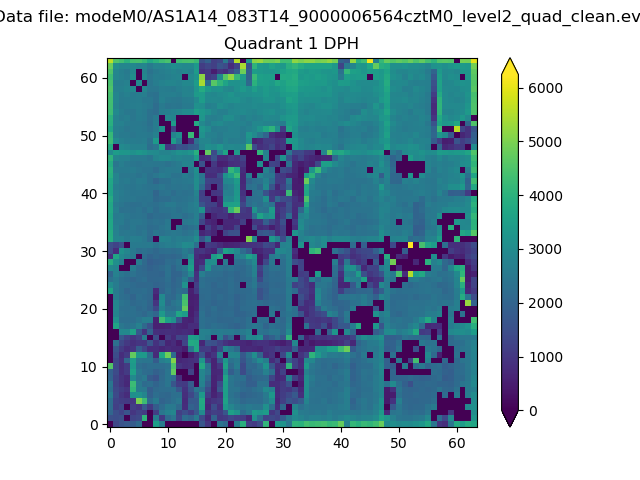 |
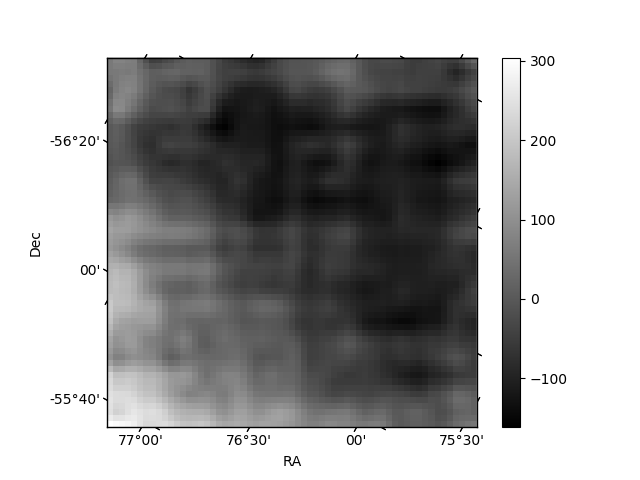
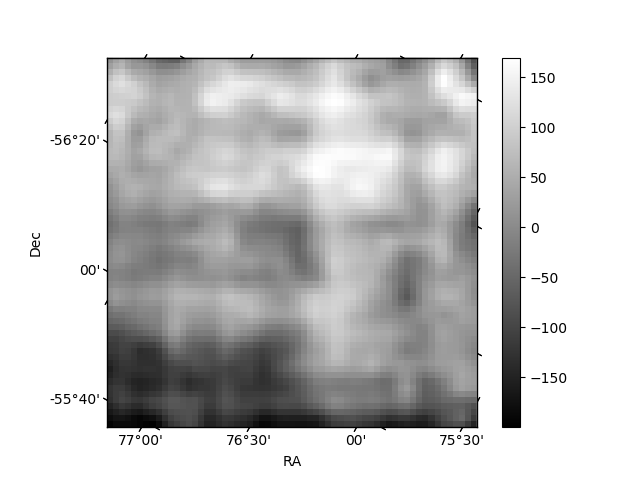
Quadrant B |
|---|---|---|---|
| Quadrant D | 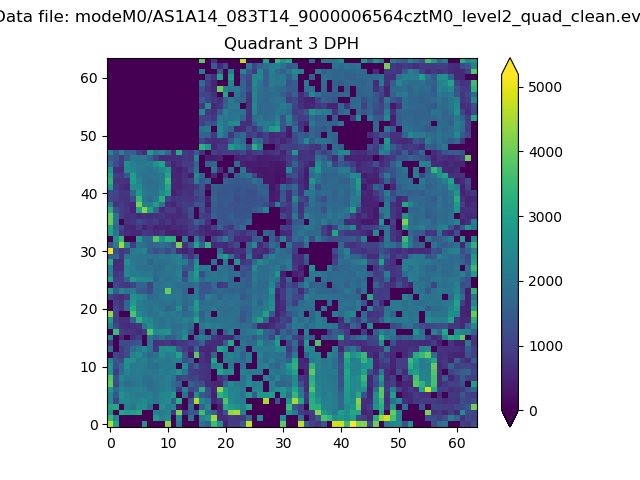 |
 |
Quadrant C |
| Plot type | Count rate plots | Images |
|---|---|---|
| Comparison with Poisson distribution Blue bars denote a histogram of data divided into 1 sec bins. Red curve is a Poisson curve with rate = median count rate of data. |
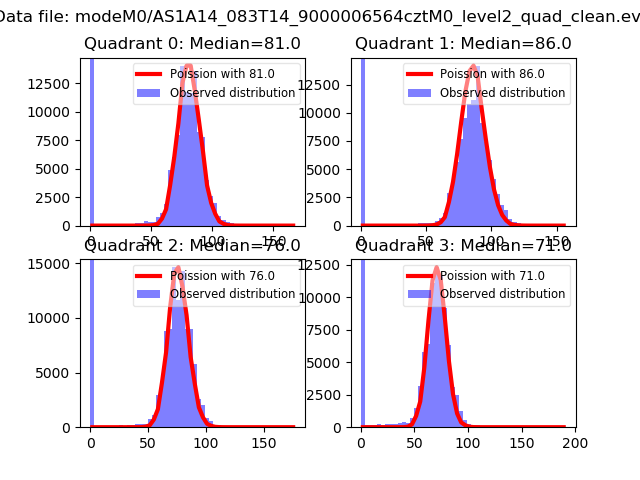 |
 |
| Quadrant-wise count rates Data is divided into 100 sec bins |
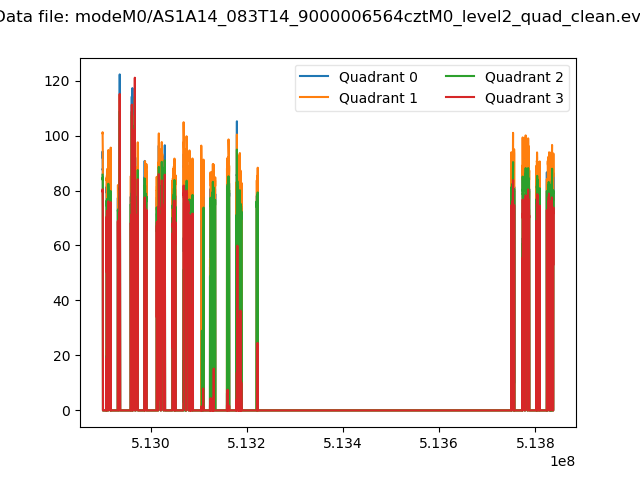 |
|
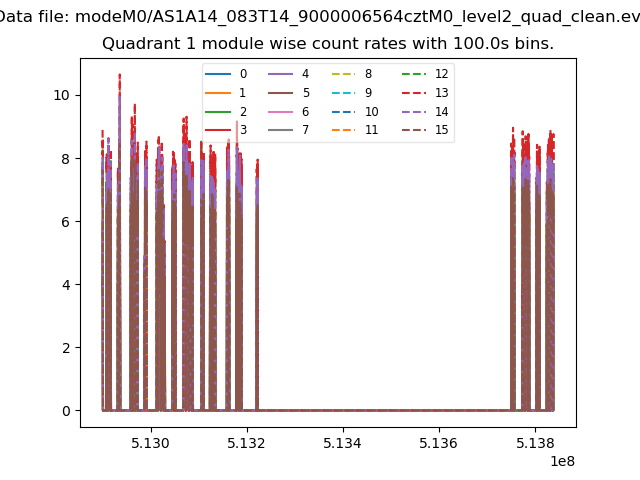
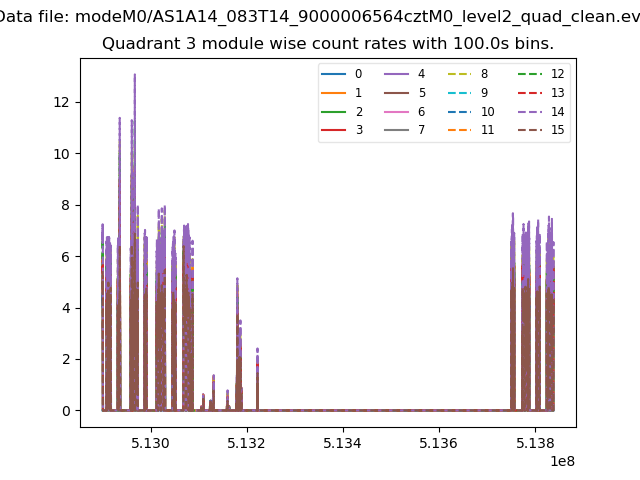
| Module-wise count rates for Quadrant A Data is divided into 100 sec bins |
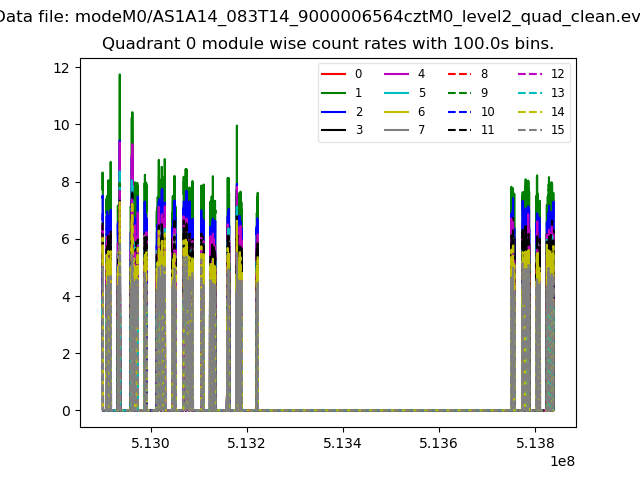 |
 |
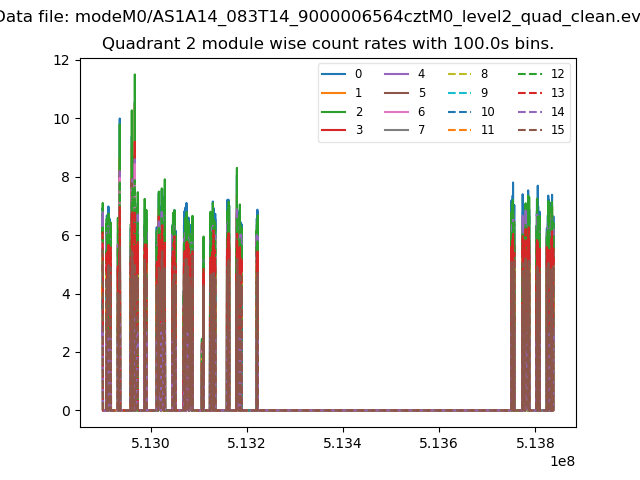
| Module-wise count rates for Quadrant B Data is divided into 100 sec bins |
 |
 |
| Module-wise count rates for Quadrant C Data is divided into 100 sec bins |
 |
 |
| Module-wise count rates for Quadrant D Data is divided into 100 sec bins |
 |
 |
| Parameter | Plot |
|---|---|
| CZT HV Monitor | 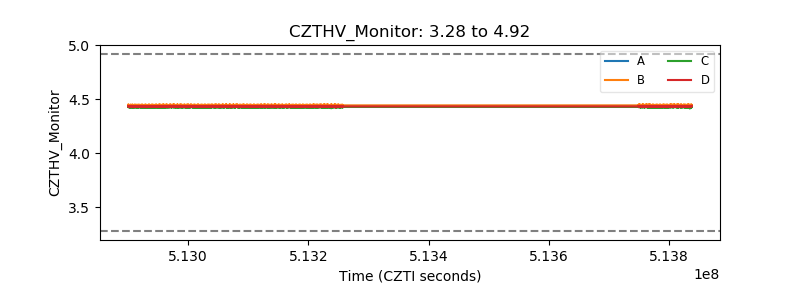 |
| D_VDD | 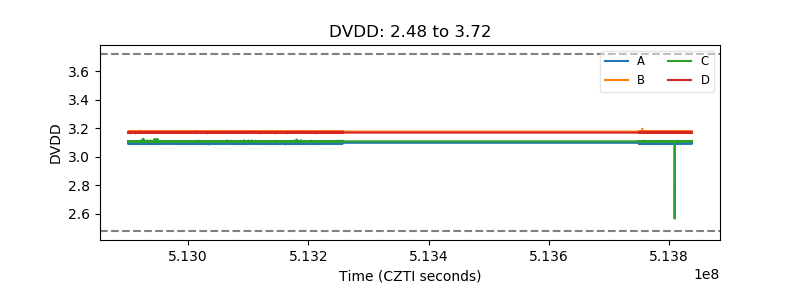 |
| Temperature 1 | 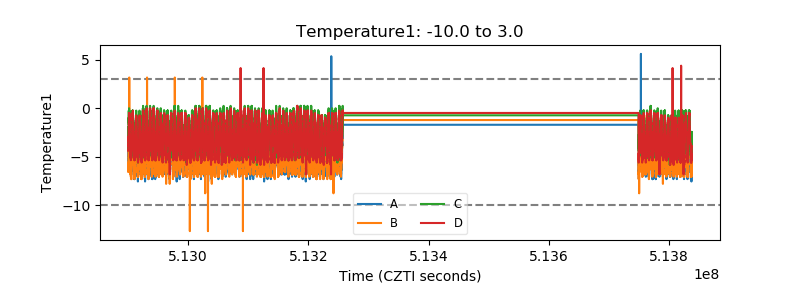 |
| Veto HV Monitor | 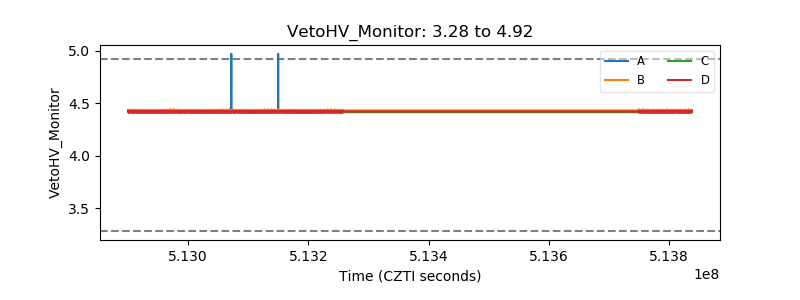 |
| Veto LLD | 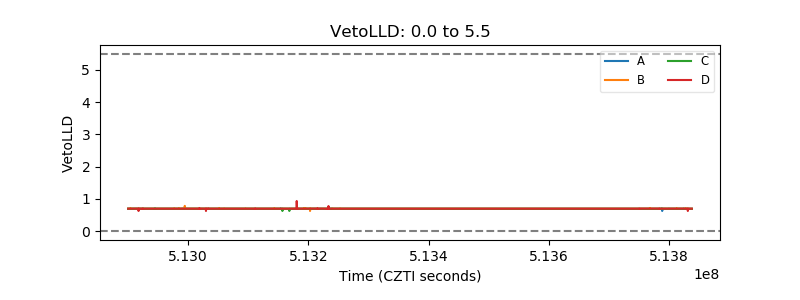 |
| Alpha Counter | 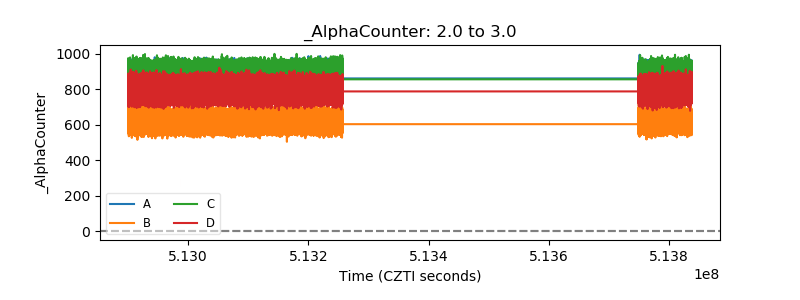 |
| _CPM_Rate | 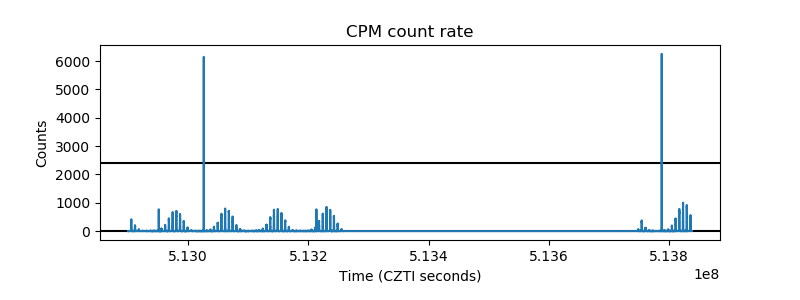 |
| CZT Counter | 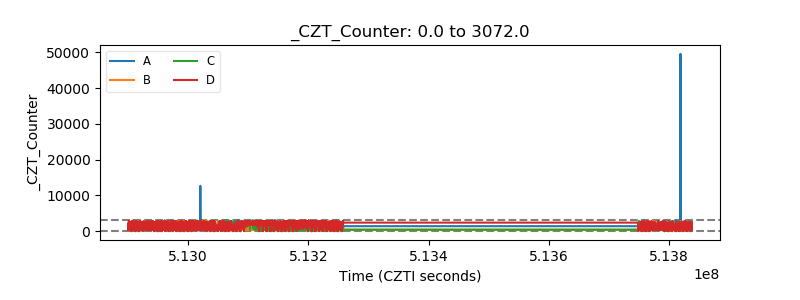 |
| +2.5 Volts monitor | 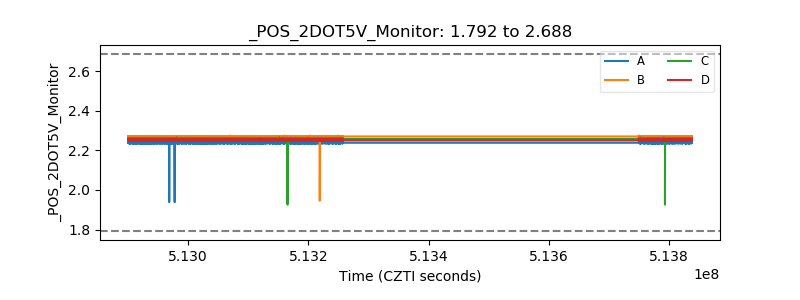 |
| +5 Volts monitor | 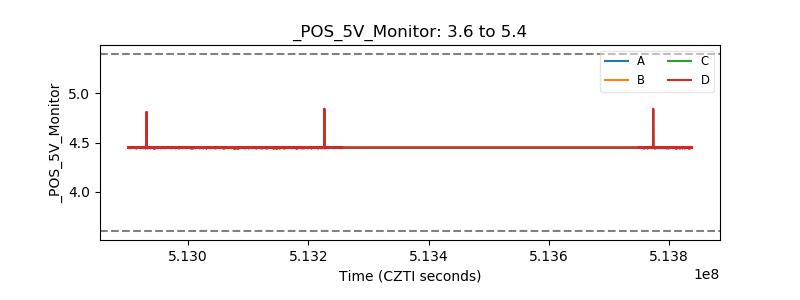 |
| _ROLL_ROT | 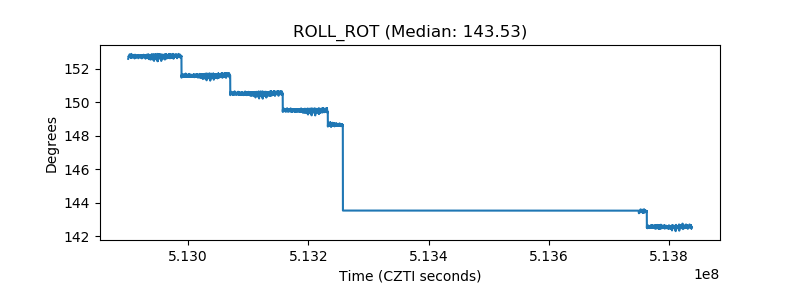 |
| _Roll_DEC | 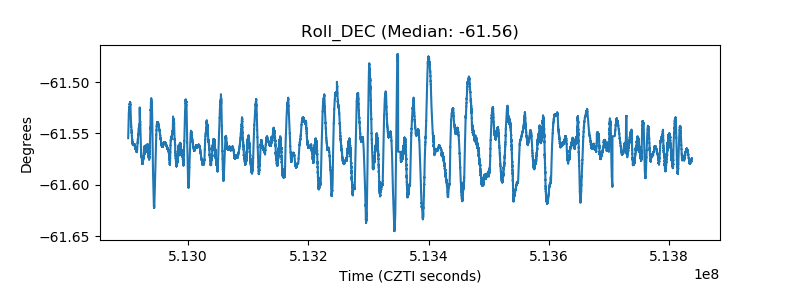 |
| _Roll_RA | 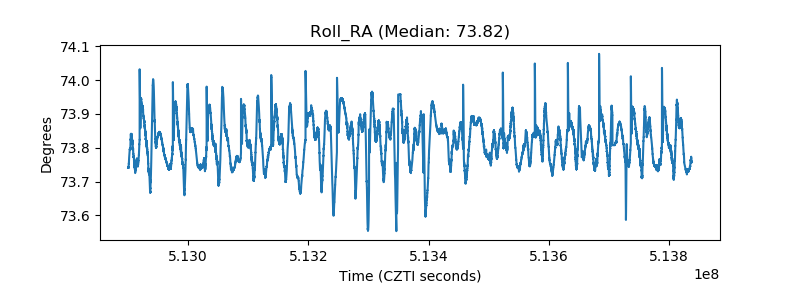 |
| Veto Counter | 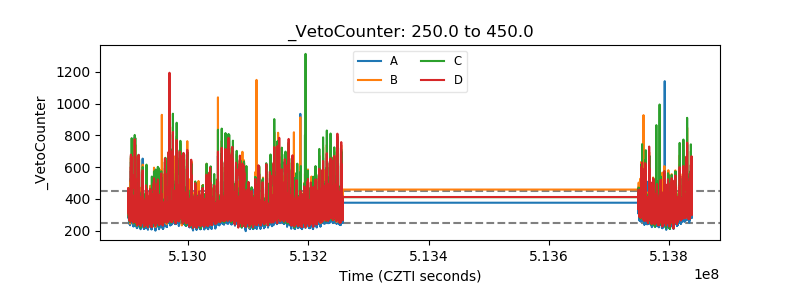 |