| Param | Original file | Final file |
|---|---|---|
| Filename | modeM0/AS1A14_083T14_9000006564_56885cztM0_level2.fits | modeM0/AS1A14_083T14_9000006564_56885cztM0_level2_quad_clean.evt |
| Size (bytes) | 455,071,680 | 92,223,360 |
| Size | 434.0 MB | 88.0 MB |
| Events in quadrant A | 3,212,763 | 618,945 |
| Events in quadrant B | 3,566,886 | 649,837 |
| Events in quadrant C | 2,978,446 | 594,961 |
| Events in quadrant D | 6,596,524 | 488,037 |
| Mode SS | |||
|---|---|---|---|
| Quadrant | BADHDUFLAG | Total packets | Discarded packets |
| A | 0 | 130 | 0 |
| B | 0 | 130 | 0 |
| C | 0 | 130 | 0 |
| D | 0 | 130 | 0 |
| Mode M9 | |||
|---|---|---|---|
| Quadrant | BADHDUFLAG | Total packets | Discarded packets |
| A | 0 | 11 | 0 |
| B | 0 | 11 | 0 |
| C | 0 | 11 | 0 |
| D | 0 | 11 | 0 |
| Mode M0 | |||
|---|---|---|---|
| Quadrant | BADHDUFLAG | Total packets | Discarded packets |
| A | 0 | 14102 | 1 |
| B | 0 | 15106 | 1 |
| C | 0 | 13361 | 1 |
| D | 0 | 23804 | 1 |
| Quadrant | Total seconds | Saturated seconds | Saturation percentage |
|---|---|---|---|
| A | 6307 | 124 | 1.966069% |
| B | 6307 | 275 | 4.360235% |
| C | 6308 | 61 | 0.967026% |
| D | 6308 | 1028 | 16.296766% |
Noise dominated data is calculated using 1-second bins in cleaned event files. If a bin has >2000 counts, and if more than 50% of those come from <1% of pixels, then it is considered to be noise-dominated and hence unusable.
| Quadrant | # 1 sec bins | Bins with >0 counts | Bins with >2000 counts | High rate bins dominated by noise | Noise dominated (total time) | Noise dominated (detector-on time) | Marked lightcurve |
|---|---|---|---|---|---|---|---|
| A | 7417 | 6308 | 34 | 34 | 0.46% | 0.54% | 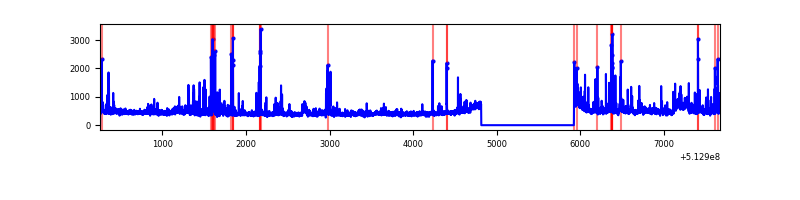 |
| B | 7416 | 6307 | 154 | 154 | 2.08% | 2.44% | 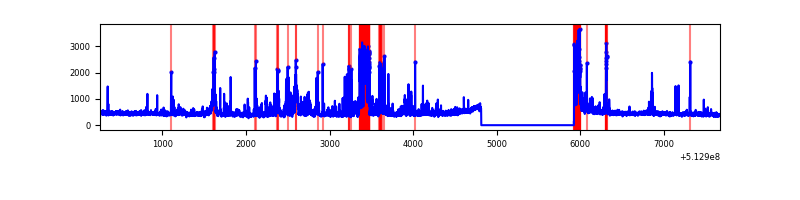 |
| C | 7418 | 6309 | 12 | 12 | 0.16% | 0.19% | 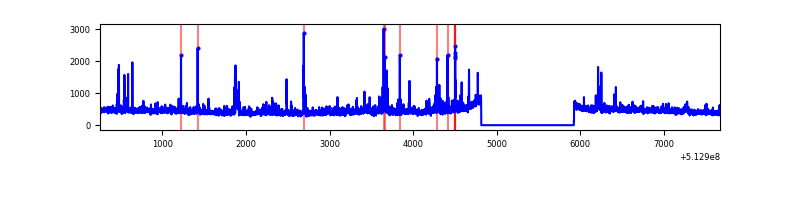 |
| D | 7418 | 6309 | 1041 | 1041 | 14.03% | 16.50% | 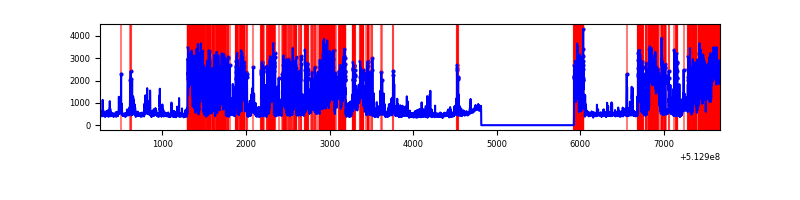 |
Top three noisy pixels from each quadrant. If the there are fewer than three noisy pixels in the level2.evt file, extra rows are filled as -1
| Pixel properties | Quadrant properties | ||||||
|---|---|---|---|---|---|---|---|
| Quadrant | DetID | PixID | Counts | Sigma | Mean | Median | Sigma |
| A | 10 | 251 | 340235 | 2019.06 | 680 | 663 | 168.2 |
| A | 3 | 14 | 159132 | 942.24 | 680 | 663 | 168.2 |
| A | 7 | 64 | 67281 | 396.1 | 680 | 663 | 168.2 |
| B | 5 | 185 | 495592 | 3545.73 | 654 | 630 | 139.6 |
| B | 10 | 16 | 205377 | 1466.73 | 654 | 630 | 139.6 |
| B | 10 | 47 | 61561 | 436.49 | 654 | 630 | 139.6 |
| C | 13 | 3 | 118234 | 654.0 | 659 | 652 | 179.8 |
| C | 7 | 220 | 64435 | 354.76 | 659 | 652 | 179.8 |
| C | 11 | 244 | 46738 | 256.33 | 659 | 652 | 179.8 |
| D | 8 | 160 | 1743468 | 10016.74 | 617 | 590 | 174.0 |
| D | 2 | 249 | 771817 | 4432.43 | 617 | 590 | 174.0 |
| D | 8 | 240 | 618924 | 3553.72 | 617 | 590 | 174.0 |
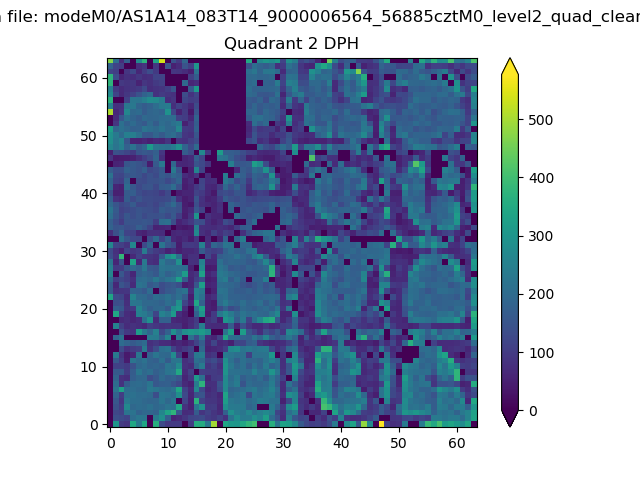
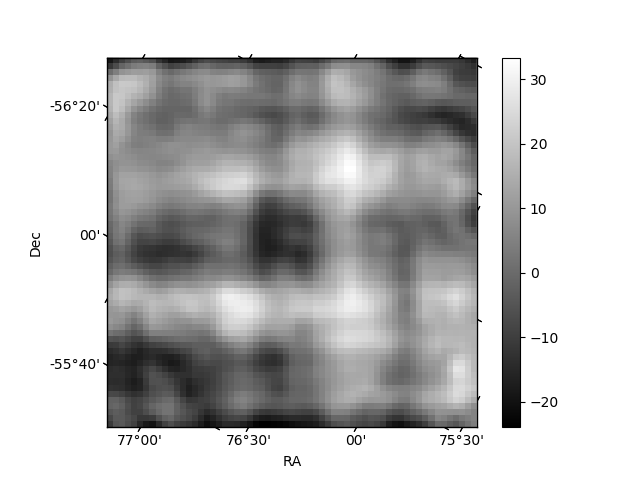
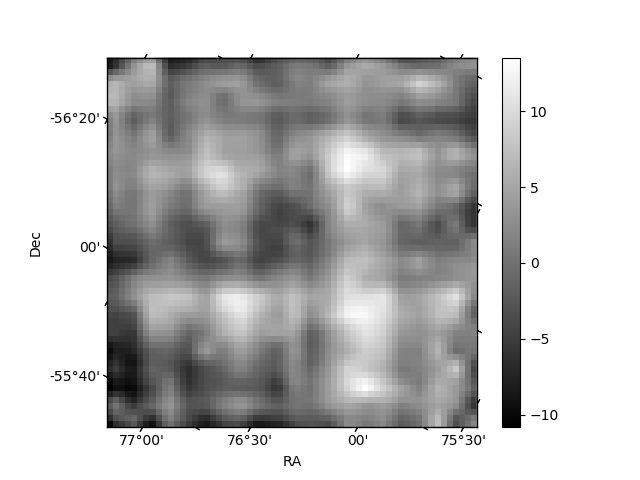
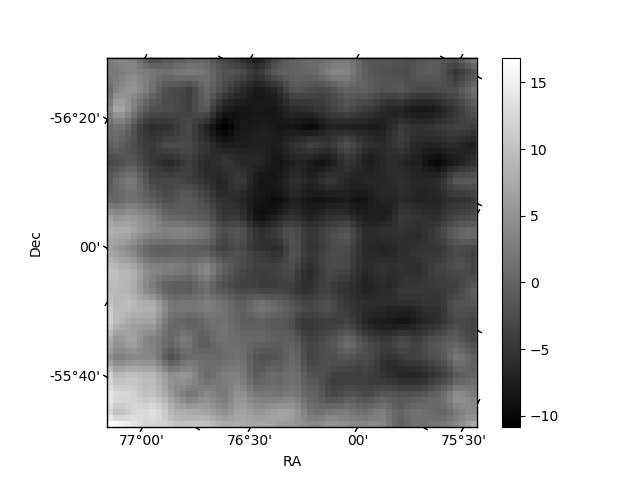
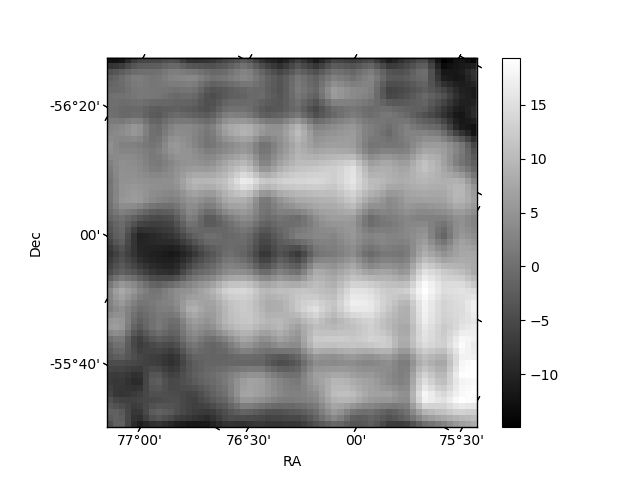
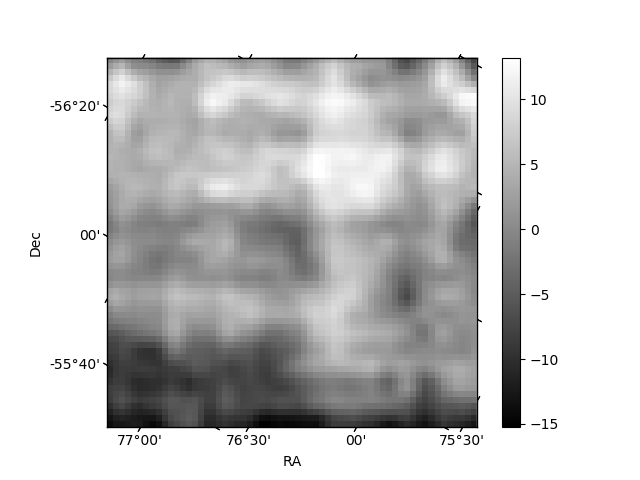
Histogram calculated using DETX and DETY for each event in the final _common_clean file
| Quadrant A | 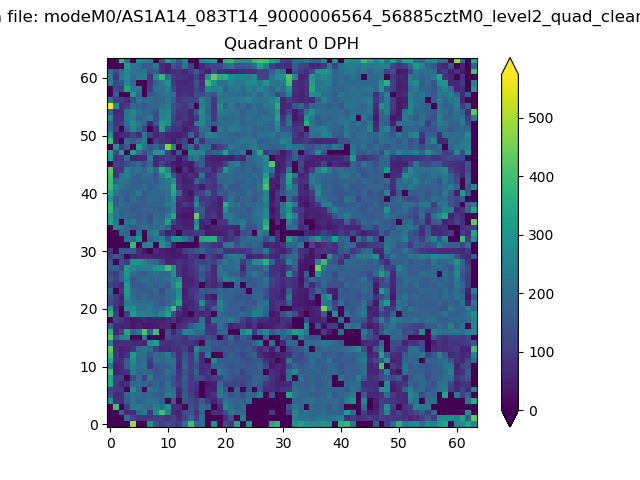 |
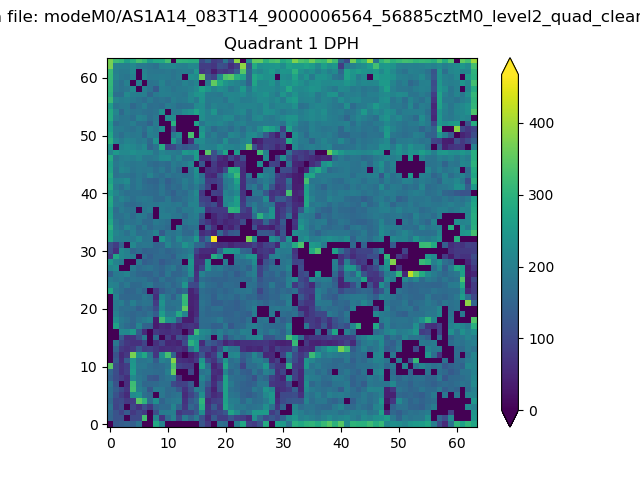 |
Quadrant B |
|---|---|---|---|
| Quadrant D | 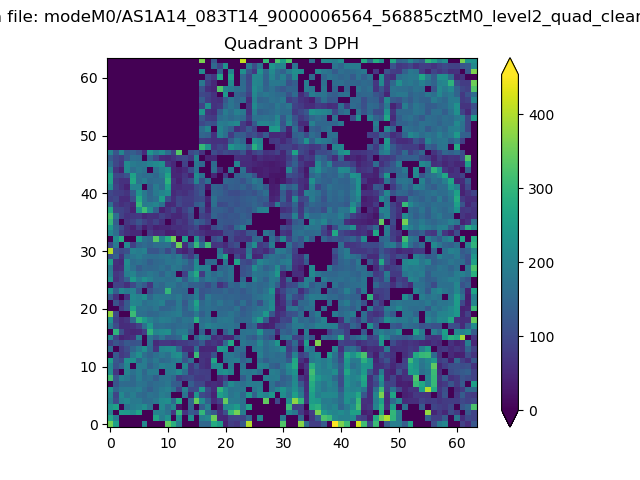 |
 |
Quadrant C |
| Plot type | Count rate plots | Images |
|---|---|---|
| Comparison with Poisson distribution Blue bars denote a histogram of data divided into 1 sec bins. Red curve is a Poisson curve with rate = median count rate of data. |
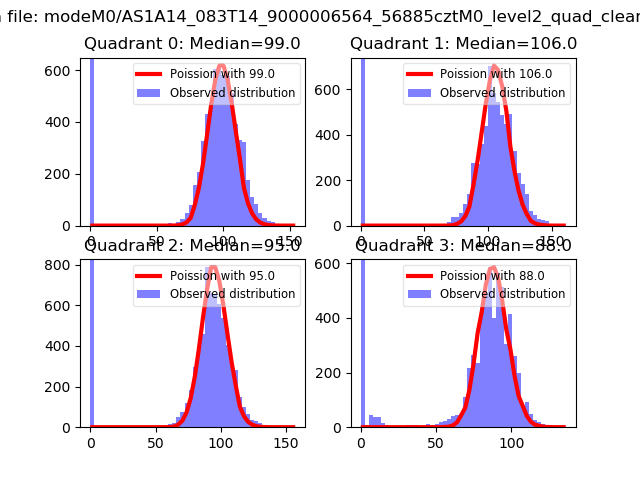 |
 |
| Quadrant-wise count rates Data is divided into 100 sec bins |
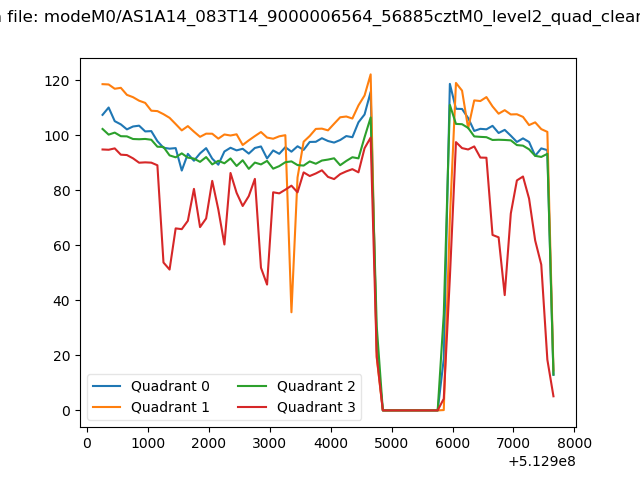 |
|
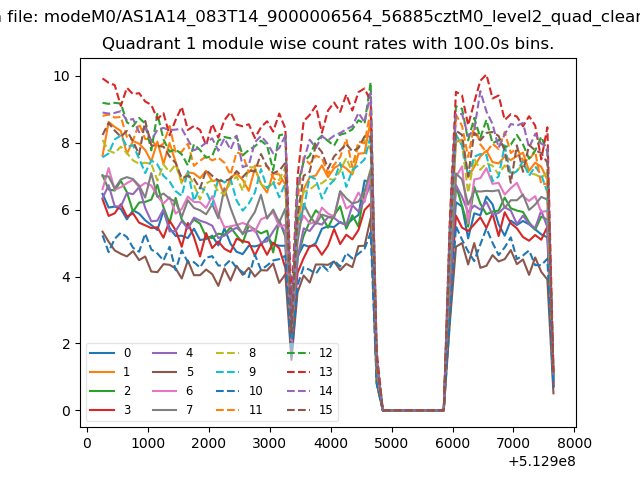
| Module-wise count rates for Quadrant A Data is divided into 100 sec bins |
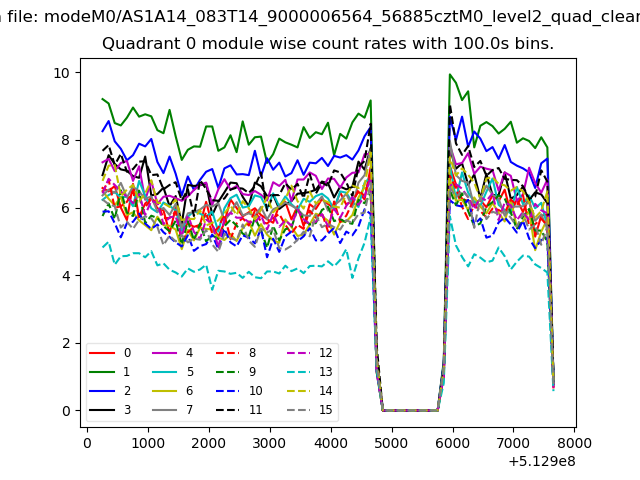 |
 |
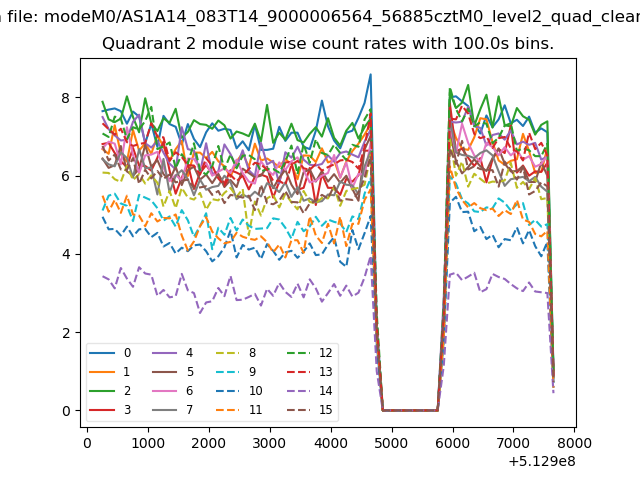
| Module-wise count rates for Quadrant B Data is divided into 100 sec bins |
 |
 |
| Module-wise count rates for Quadrant C Data is divided into 100 sec bins |
 |
 |
| Module-wise count rates for Quadrant D Data is divided into 100 sec bins |
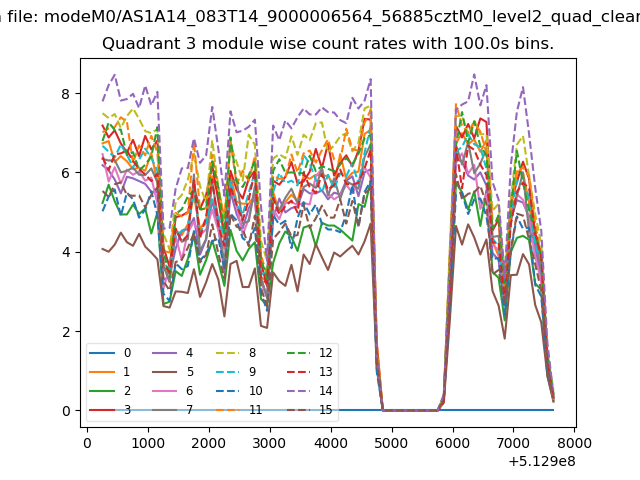 |
 |
| Parameter | Plot |
|---|---|
| CZT HV Monitor | 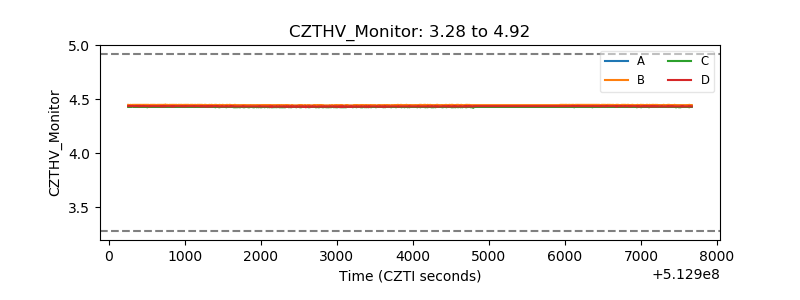 |
| D_VDD | 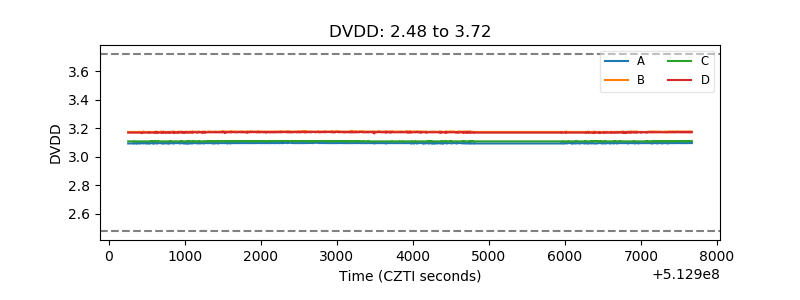 |
| Temperature 1 | 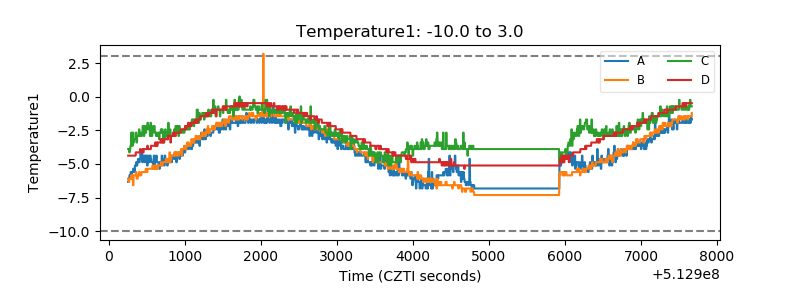 |
| Veto HV Monitor | 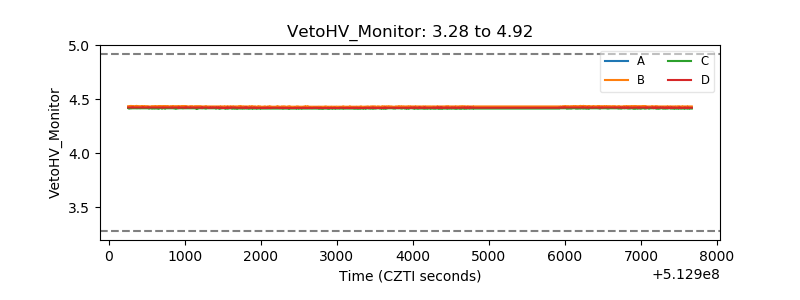 |
| Veto LLD | 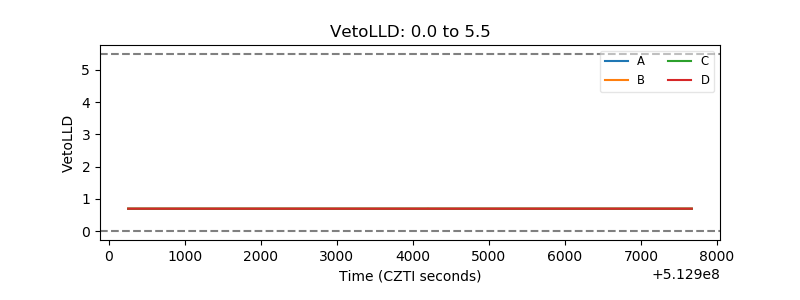 |
| Alpha Counter | 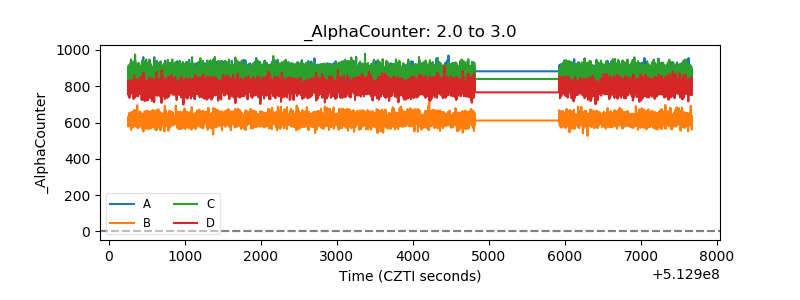 |
| _CPM_Rate | 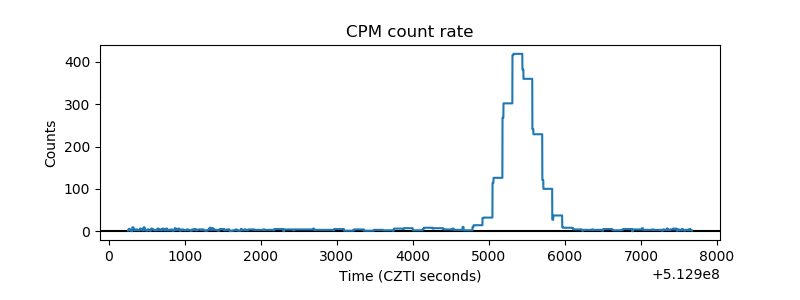 |
| CZT Counter | 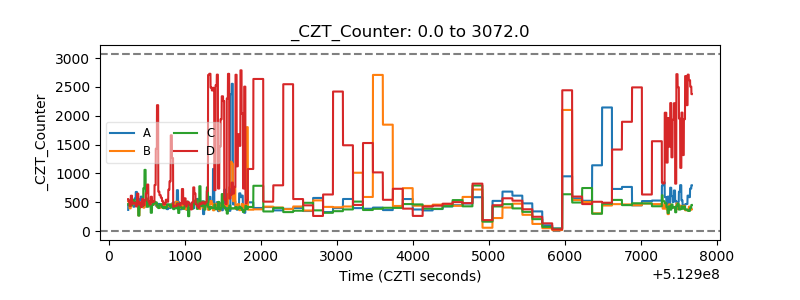 |
| +2.5 Volts monitor |  |
| +5 Volts monitor |  |
| _ROLL_ROT | 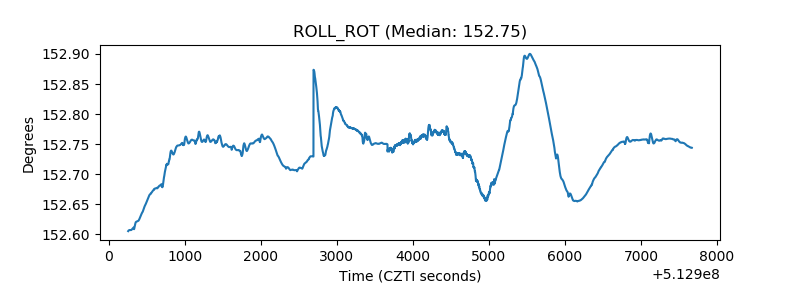 |
| _Roll_DEC | 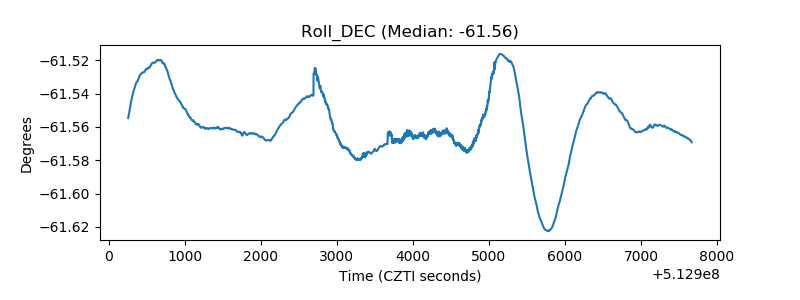 |
| _Roll_RA | 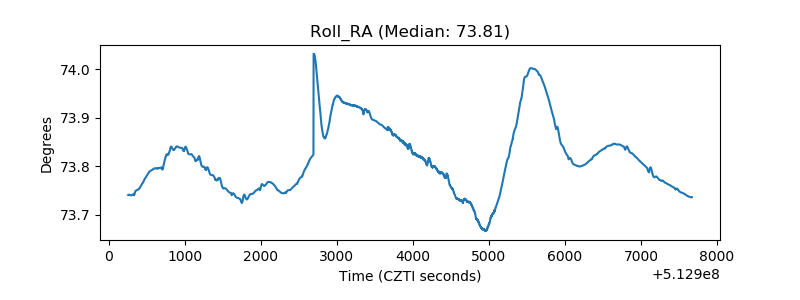 |
| Veto Counter | 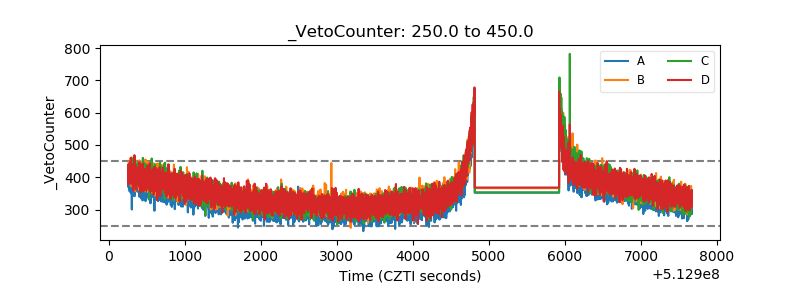 |