| Param | Original file | Final file |
|---|---|---|
| Filename | modeM0/AS1A14_083T14_9000006564_56886cztM0_level2.fits | modeM0/AS1A14_083T14_9000006564_56886cztM0_level2_quad_clean.evt |
| Size (bytes) | 476,965,440 | 92,119,680 |
| Size | 454.9 MB | 87.9 MB |
| Events in quadrant A | 3,499,209 | 622,255 |
| Events in quadrant B | 3,598,405 | 651,826 |
| Events in quadrant C | 3,078,406 | 596,706 |
| Events in quadrant D | 6,972,377 | 463,783 |
| Mode SS | |||
|---|---|---|---|
| Quadrant | BADHDUFLAG | Total packets | Discarded packets |
| A | 0 | 132 | 0 |
| B | 0 | 132 | 0 |
| C | 0 | 132 | 0 |
| D | 0 | 132 | 0 |
| Mode M9 | |||
|---|---|---|---|
| Quadrant | BADHDUFLAG | Total packets | Discarded packets |
| A | 0 | 10 | 0 |
| B | 0 | 10 | 0 |
| C | 0 | 10 | 0 |
| D | 0 | 10 | 0 |
| Mode M0 | |||
|---|---|---|---|
| Quadrant | BADHDUFLAG | Total packets | Discarded packets |
| A | 0 | 15004 | 1 |
| B | 0 | 15517 | 1 |
| C | 0 | 14073 | 1 |
| D | 0 | 25194 | 1 |
| Quadrant | Total seconds | Saturated seconds | Saturation percentage |
|---|---|---|---|
| A | 6518 | 144 | 2.209267% |
| B | 6519 | 284 | 4.356496% |
| C | 6519 | 111 | 1.702715% |
| D | 6519 | 1341 | 20.570640% |
Noise dominated data is calculated using 1-second bins in cleaned event files. If a bin has >2000 counts, and if more than 50% of those come from <1% of pixels, then it is considered to be noise-dominated and hence unusable.
| Quadrant | # 1 sec bins | Bins with >0 counts | Bins with >2000 counts | High rate bins dominated by noise | Noise dominated (total time) | Noise dominated (detector-on time) | Marked lightcurve |
|---|---|---|---|---|---|---|---|
| A | 7463 | 6519 | 22 | 22 | 0.29% | 0.34% | 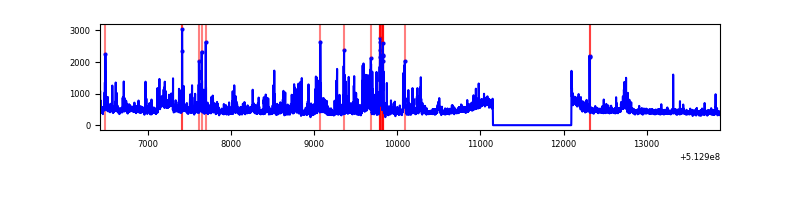 |
| B | 7464 | 6520 | 101 | 101 | 1.35% | 1.55% | 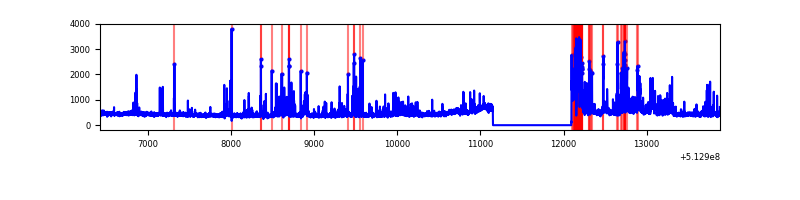 |
| C | 7464 | 6520 | 29 | 29 | 0.39% | 0.44% | 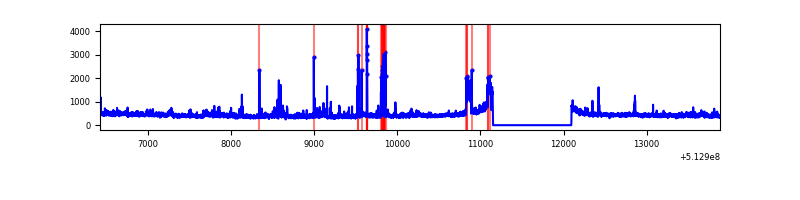 |
| D | 7464 | 6520 | 1276 | 1276 | 17.10% | 19.57% | 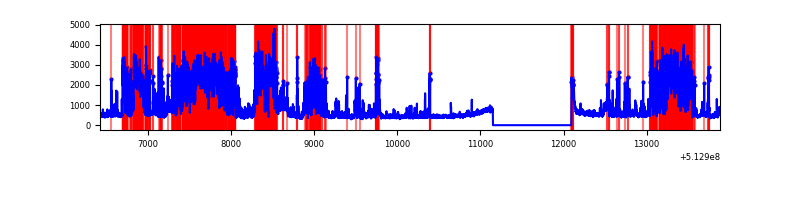 |
Top three noisy pixels from each quadrant. If the there are fewer than three noisy pixels in the level2.evt file, extra rows are filled as -1
| Pixel properties | Quadrant properties | ||||||
|---|---|---|---|---|---|---|---|
| Quadrant | DetID | PixID | Counts | Sigma | Mean | Median | Sigma |
| A | 3 | 14 | 474759 | 2739.96 | 697 | 678 | 173.0 |
| A | 10 | 251 | 254502 | 1466.98 | 697 | 678 | 173.0 |
| A | 7 | 64 | 22395 | 125.51 | 697 | 678 | 173.0 |
| B | 10 | 16 | 292449 | 2040.74 | 666 | 643 | 143.0 |
| B | 5 | 185 | 269829 | 1882.54 | 666 | 643 | 143.0 |
| B | 8 | 128 | 164040 | 1142.71 | 666 | 643 | 143.0 |
| C | 13 | 3 | 269205 | 1472.79 | 666 | 658 | 182.3 |
| C | 11 | 244 | 65018 | 352.97 | 666 | 658 | 182.3 |
| C | 14 | 254 | 43108 | 232.81 | 666 | 658 | 182.3 |
| D | 2 | 249 | 2197968 | 12481.83 | 618 | 592 | 176.0 |
| D | 8 | 160 | 1545979 | 8778.31 | 618 | 592 | 176.0 |
| D | 8 | 240 | 326648 | 1852.11 | 618 | 592 | 176.0 |
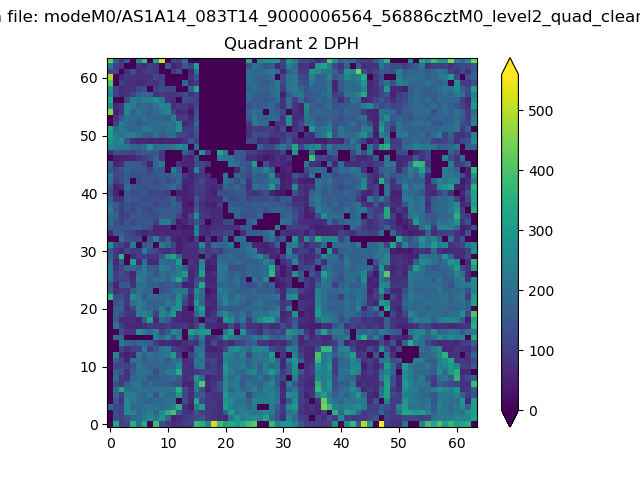
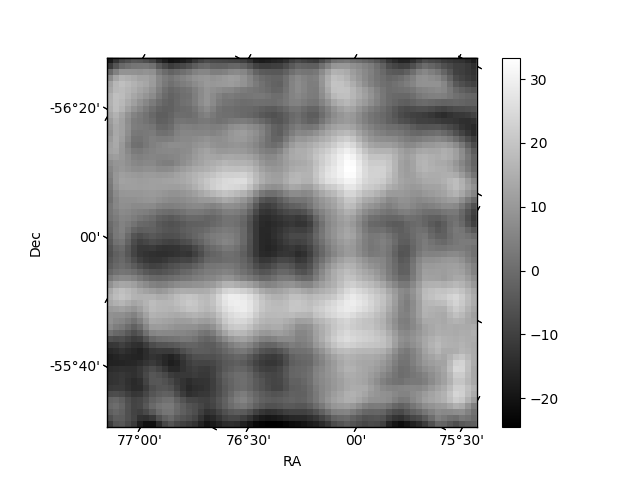
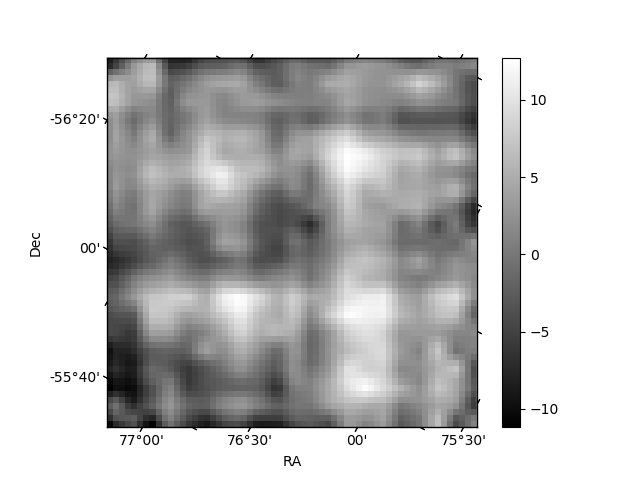
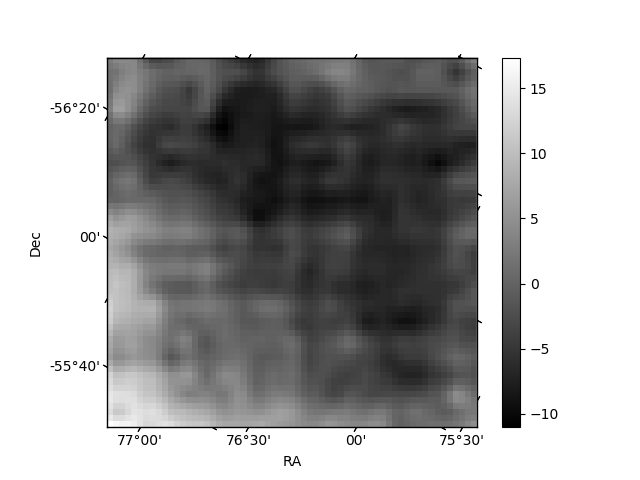
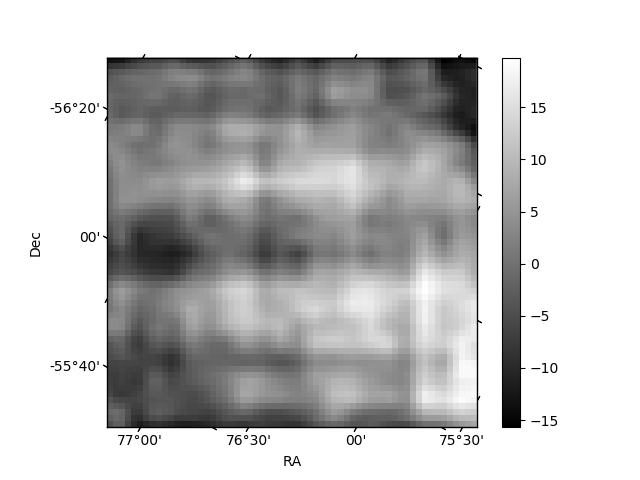
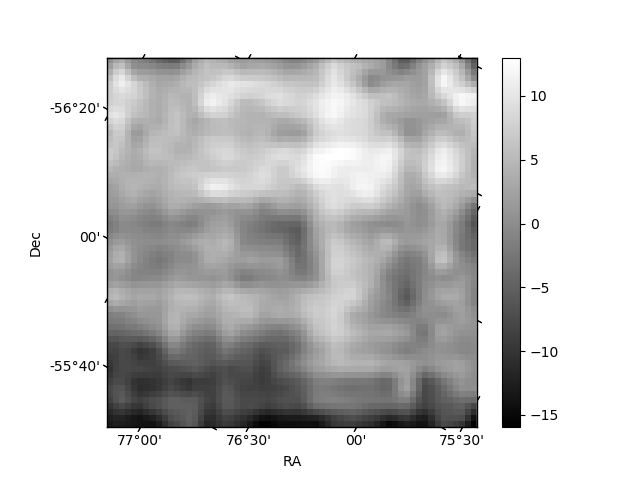
Histogram calculated using DETX and DETY for each event in the final _common_clean file
| Quadrant A | 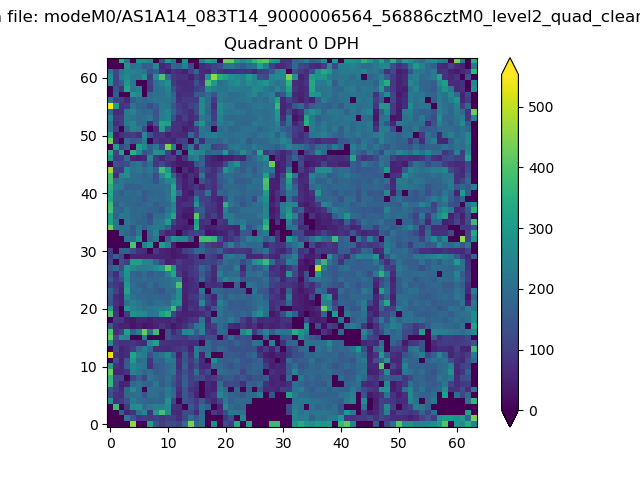 |
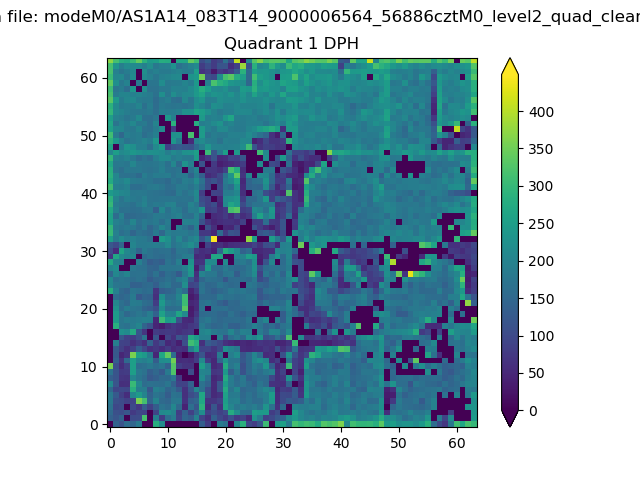 |
Quadrant B |
|---|---|---|---|
| Quadrant D | 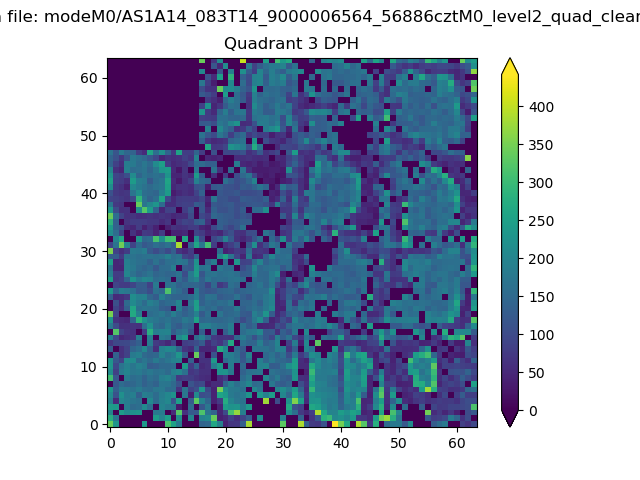 |
 |
Quadrant C |
| Plot type | Count rate plots | Images |
|---|---|---|
| Comparison with Poisson distribution Blue bars denote a histogram of data divided into 1 sec bins. Red curve is a Poisson curve with rate = median count rate of data. |
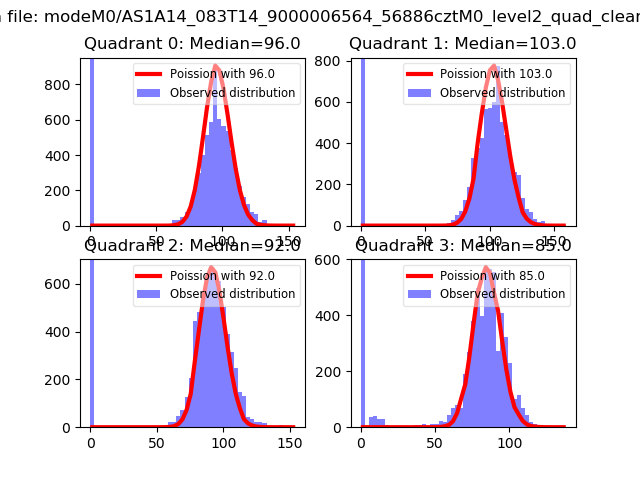 |
 |
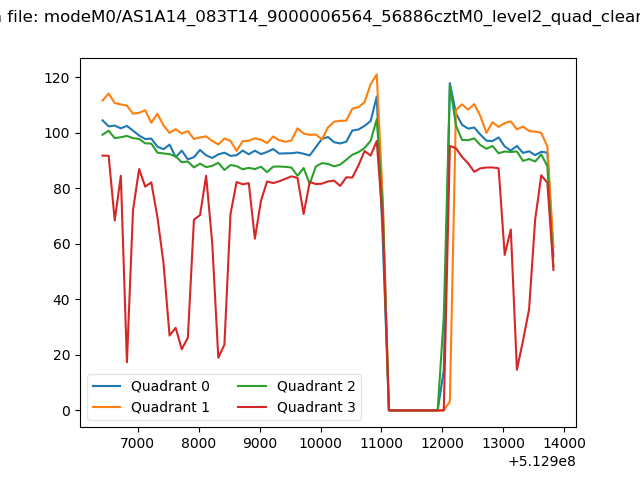
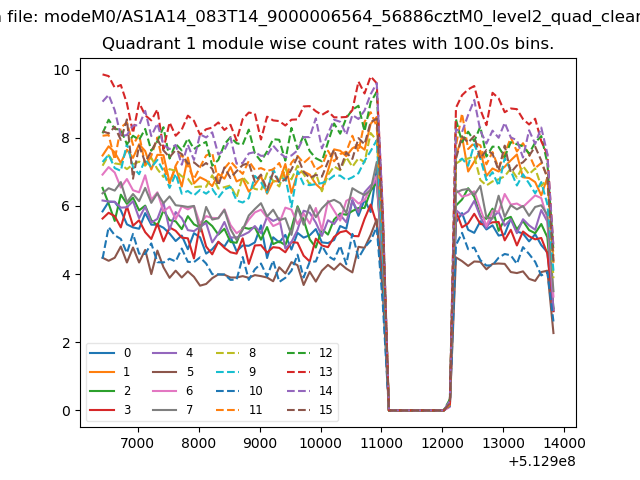
| Quadrant-wise count rates Data is divided into 100 sec bins |
 |
|
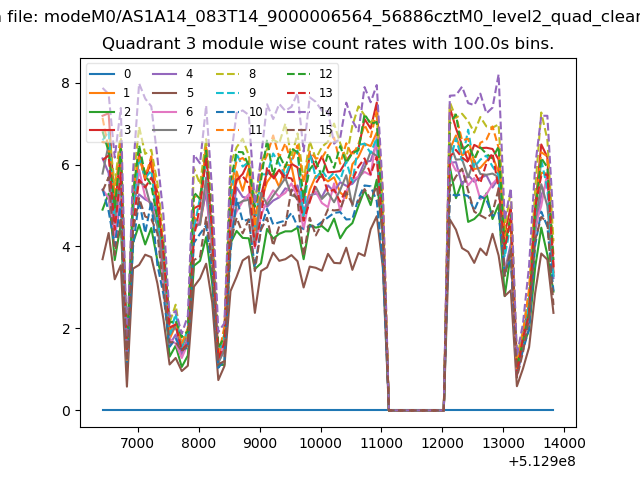
| Module-wise count rates for Quadrant A Data is divided into 100 sec bins |
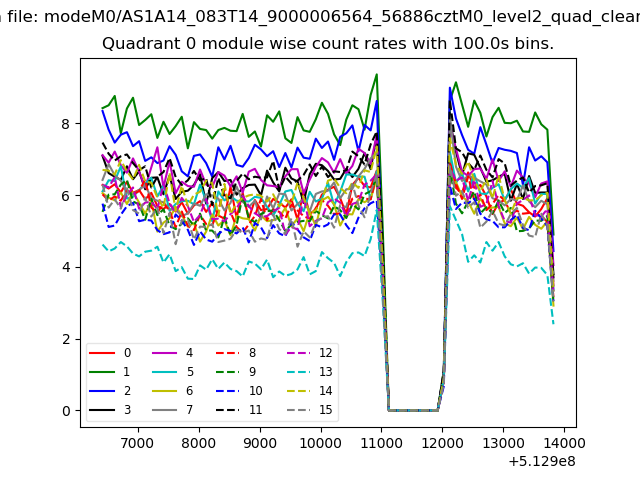 |
 |
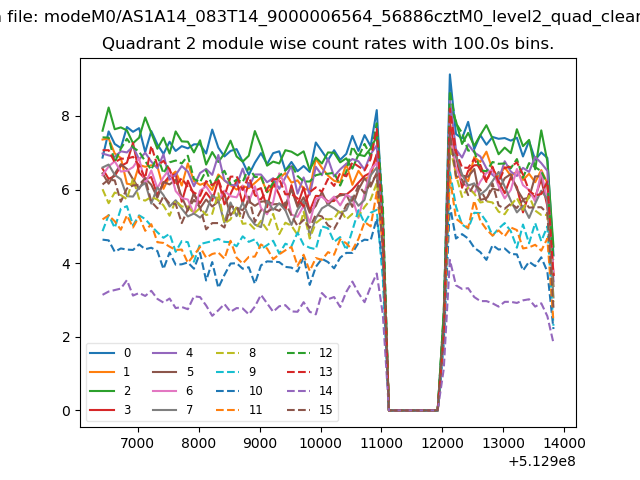
| Module-wise count rates for Quadrant B Data is divided into 100 sec bins |
 |
 |
| Module-wise count rates for Quadrant C Data is divided into 100 sec bins |
 |
 |
| Module-wise count rates for Quadrant D Data is divided into 100 sec bins |
 |
 |
| Parameter | Plot |
|---|---|
| CZT HV Monitor |  |
| D_VDD | 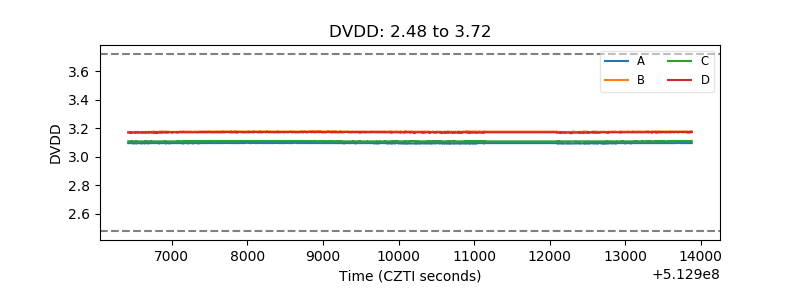 |
| Temperature 1 | 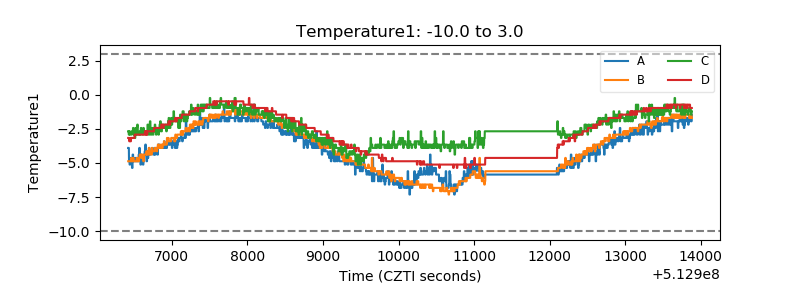 |
| Veto HV Monitor | 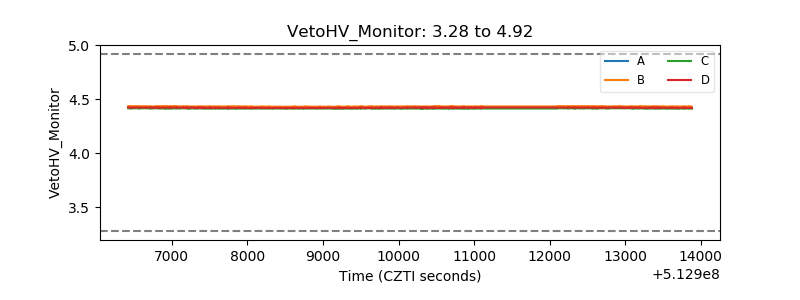 |
| Veto LLD | 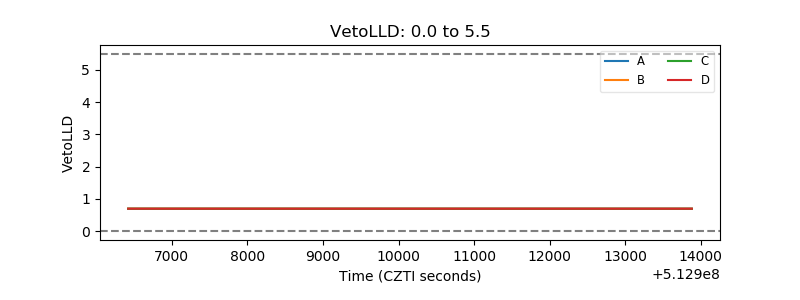 |
| Alpha Counter | 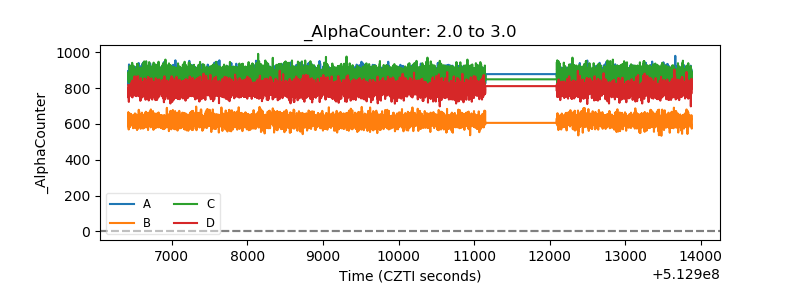 |
| _CPM_Rate | 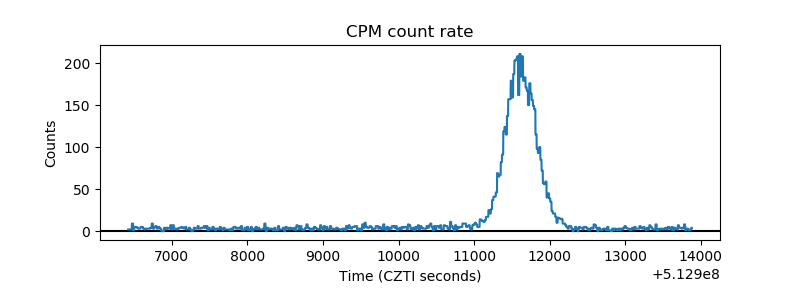 |
| CZT Counter | 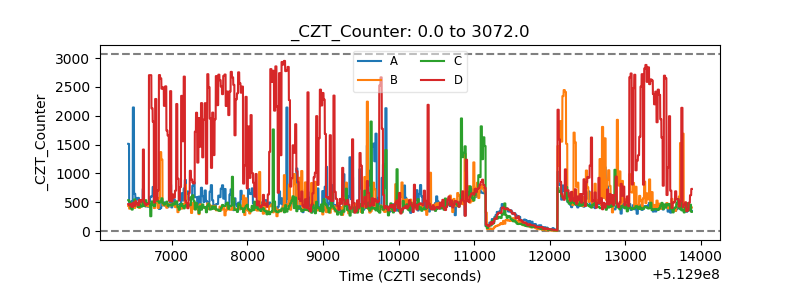 |
| +2.5 Volts monitor | 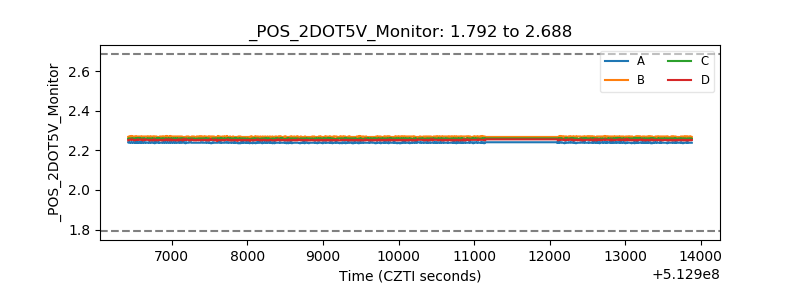 |
| +5 Volts monitor | 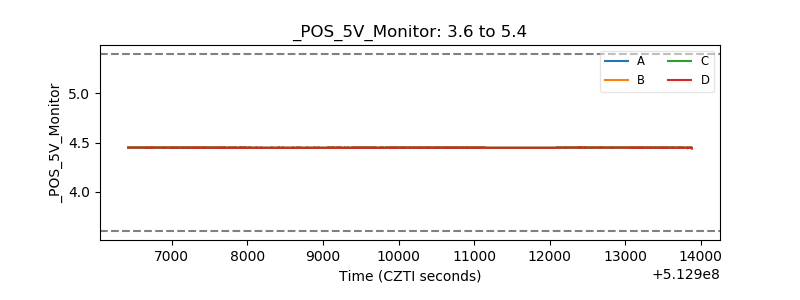 |
| _ROLL_ROT | 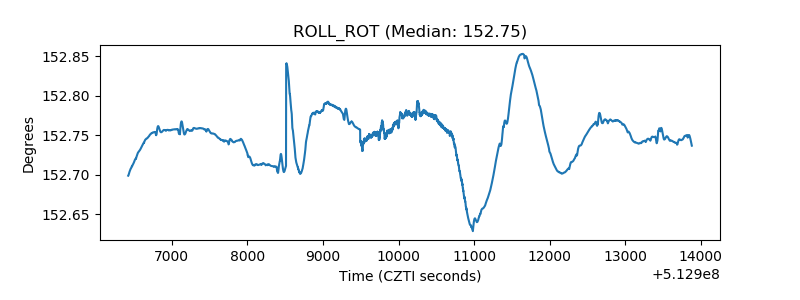 |
| _Roll_DEC | 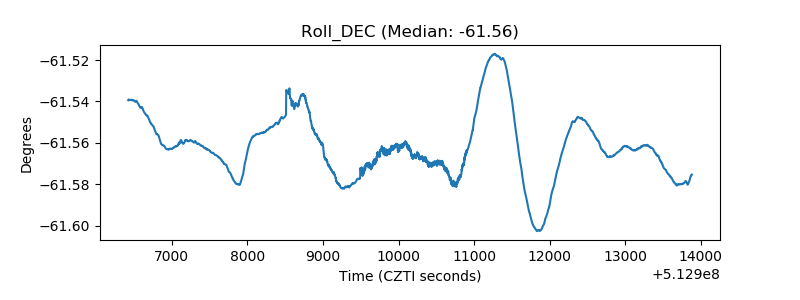 |
| _Roll_RA | 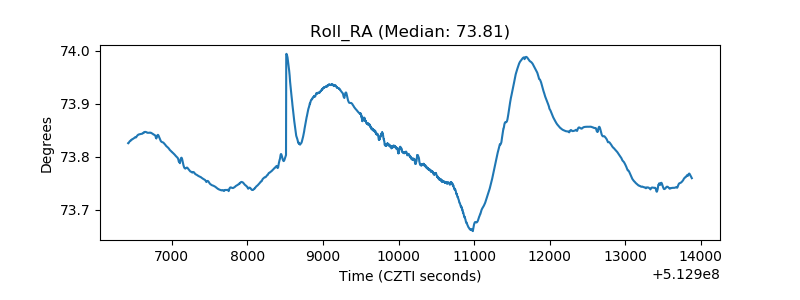 |
| Veto Counter | 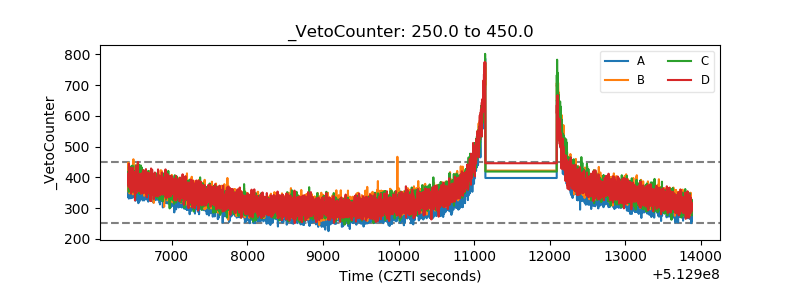 |