| Param | Original file | Final file |
|---|---|---|
| Filename | modeM0/AS1A14_083T14_9000006564_56887cztM0_level2.fits | modeM0/AS1A14_083T14_9000006564_56887cztM0_level2_quad_clean.evt |
| Size (bytes) | 469,241,280 | 96,033,600 |
| Size | 447.5 MB | 91.6 MB |
| Events in quadrant A | 3,410,016 | 641,149 |
| Events in quadrant B | 4,026,189 | 661,664 |
| Events in quadrant C | 3,138,782 | 615,840 |
| Events in quadrant D | 6,264,017 | 513,219 |
| Mode SS | |||
|---|---|---|---|
| Quadrant | BADHDUFLAG | Total packets | Discarded packets |
| A | 0 | 140 | 0 |
| B | 0 | 140 | 0 |
| C | 0 | 140 | 0 |
| D | 0 | 140 | 0 |
| Mode M9 | |||
|---|---|---|---|
| Quadrant | BADHDUFLAG | Total packets | Discarded packets |
| A | 0 | 7 | 0 |
| B | 0 | 7 | 0 |
| C | 0 | 7 | 0 |
| D | 0 | 7 | 0 |
| Mode M0 | |||
|---|---|---|---|
| Quadrant | BADHDUFLAG | Total packets | Discarded packets |
| A | 0 | 15236 | 1 |
| B | 0 | 17002 | 1 |
| C | 0 | 14648 | 1 |
| D | 0 | 23441 | 1 |
| Quadrant | Total seconds | Saturated seconds | Saturation percentage |
|---|---|---|---|
| A | 6823 | 107 | 1.568225% |
| B | 6824 | 347 | 5.084994% |
| C | 6824 | 41 | 0.600821% |
| D | 6824 | 923 | 13.525791% |
Noise dominated data is calculated using 1-second bins in cleaned event files. If a bin has >2000 counts, and if more than 50% of those come from <1% of pixels, then it is considered to be noise-dominated and hence unusable.
| Quadrant | # 1 sec bins | Bins with >0 counts | Bins with >2000 counts | High rate bins dominated by noise | Noise dominated (total time) | Noise dominated (detector-on time) | Marked lightcurve |
|---|---|---|---|---|---|---|---|
| A | 7558 | 6824 | 32 | 32 | 0.42% | 0.47% | 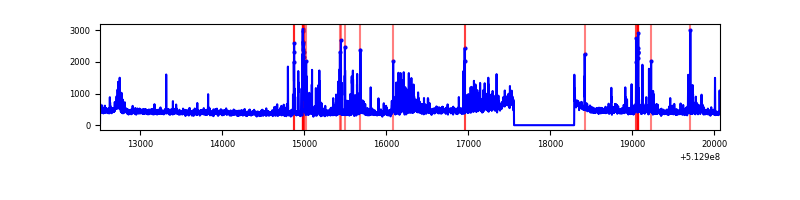 |
| B | 7559 | 6825 | 133 | 133 | 1.76% | 1.95% | 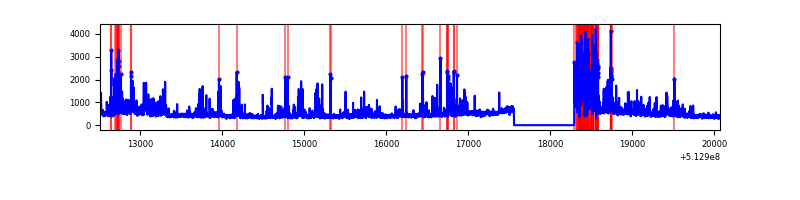 |
| C | 7559 | 6825 | 18 | 18 | 0.24% | 0.26% | 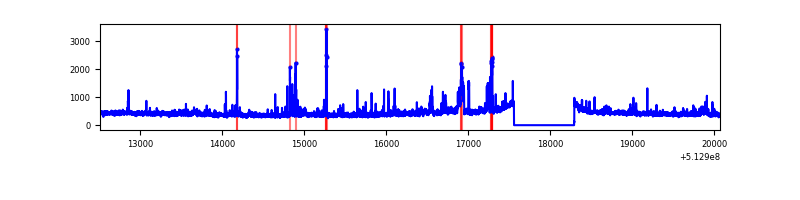 |
| D | 7559 | 6825 | 861 | 861 | 11.39% | 12.62% | 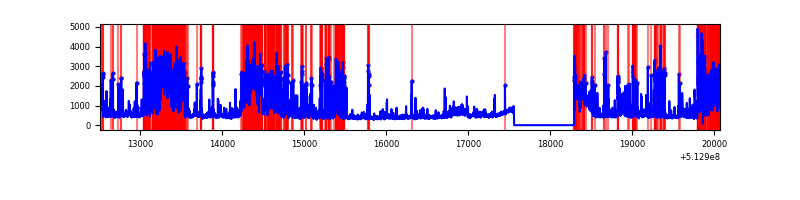 |
Top three noisy pixels from each quadrant. If the there are fewer than three noisy pixels in the level2.evt file, extra rows are filled as -1
| Pixel properties | Quadrant properties | ||||||
|---|---|---|---|---|---|---|---|
| Quadrant | DetID | PixID | Counts | Sigma | Mean | Median | Sigma |
| A | 4 | 253 | 226485 | 1276.5 | 714 | 694 | 176.9 |
| A | 10 | 251 | 204928 | 1154.63 | 714 | 694 | 176.9 |
| A | 3 | 14 | 147454 | 829.7 | 714 | 694 | 176.9 |
| B | 10 | 16 | 413410 | 2850.14 | 680 | 656 | 144.8 |
| B | 5 | 185 | 341994 | 2357.0 | 680 | 656 | 144.8 |
| B | 8 | 128 | 167240 | 1150.29 | 680 | 656 | 144.8 |
| C | 3 | 248 | 113539 | 602.48 | 688 | 681 | 187.3 |
| C | 13 | 3 | 108543 | 575.81 | 688 | 681 | 187.3 |
| C | 14 | 254 | 51841 | 273.11 | 688 | 681 | 187.3 |
| D | 8 | 160 | 1359086 | 7345.1 | 653 | 624 | 184.9 |
| D | 2 | 249 | 1339443 | 7238.89 | 653 | 624 | 184.9 |
| D | 8 | 240 | 552794 | 2985.54 | 653 | 624 | 184.9 |
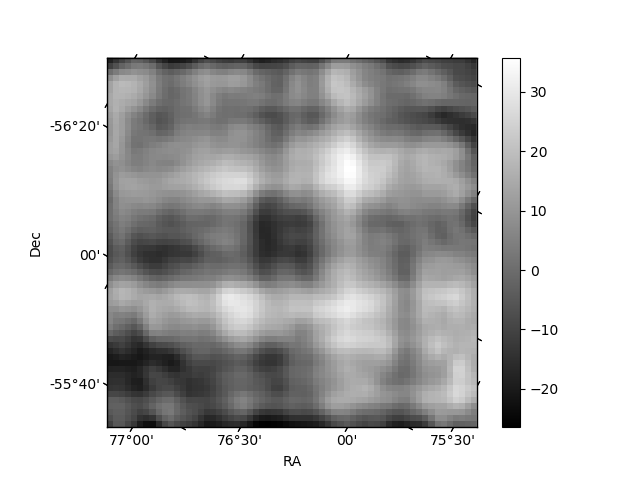
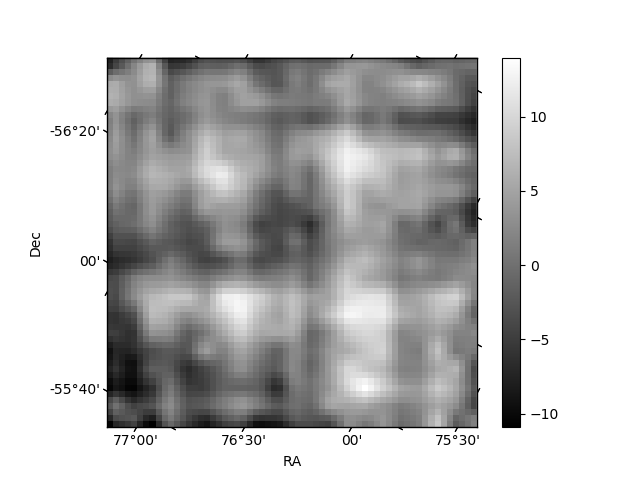
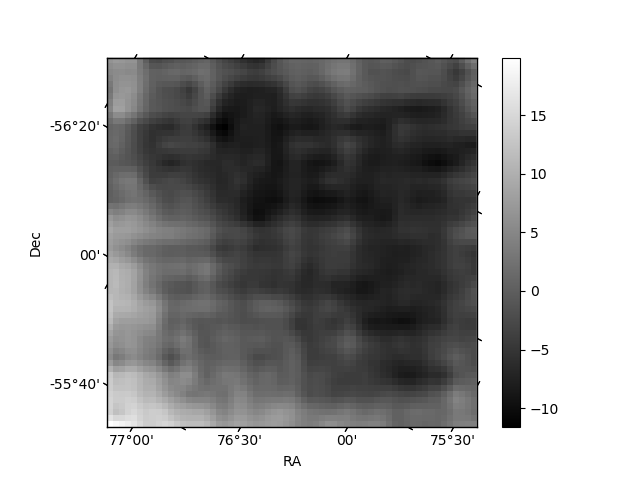
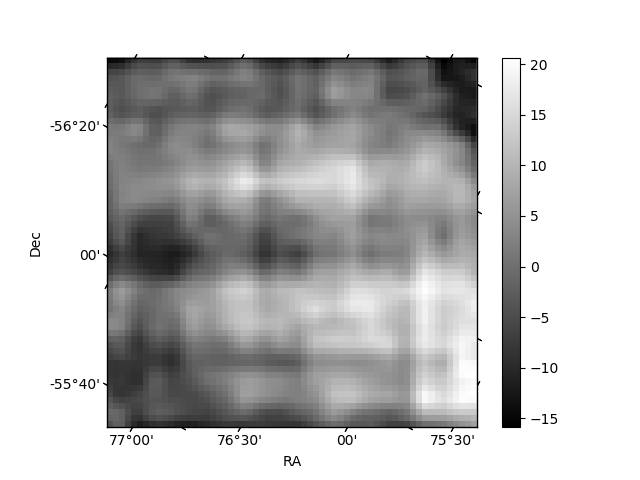
Histogram calculated using DETX and DETY for each event in the final _common_clean file
| Quadrant A | 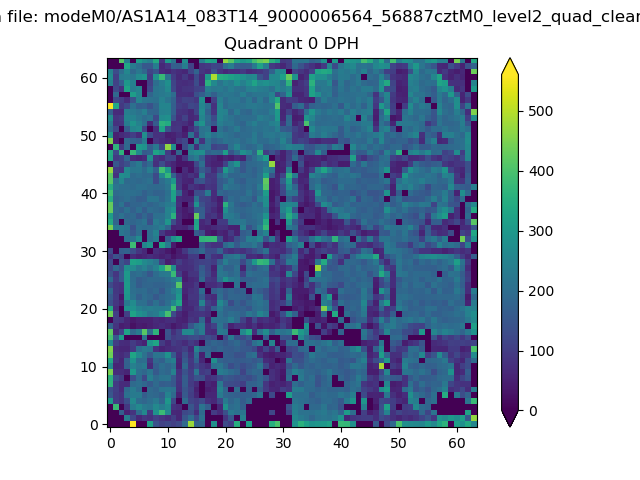 |
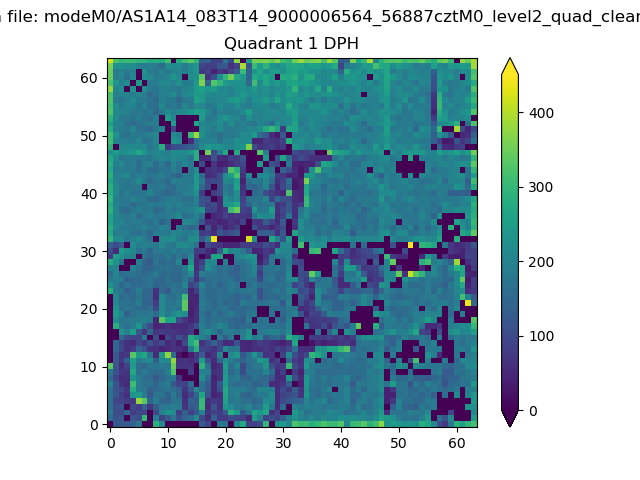 |
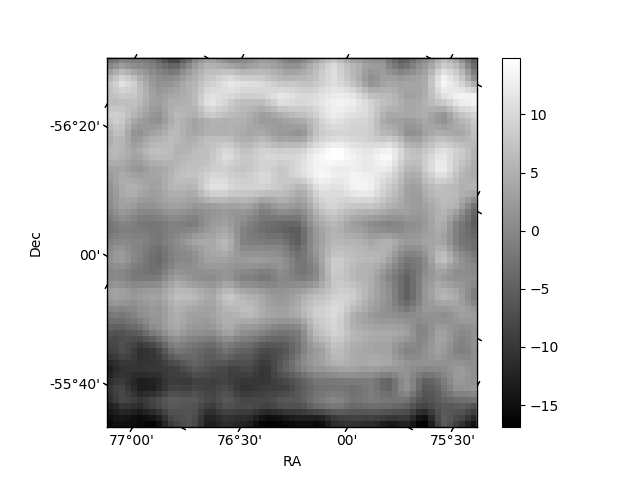
Quadrant B |
|---|---|---|---|
| Quadrant D | 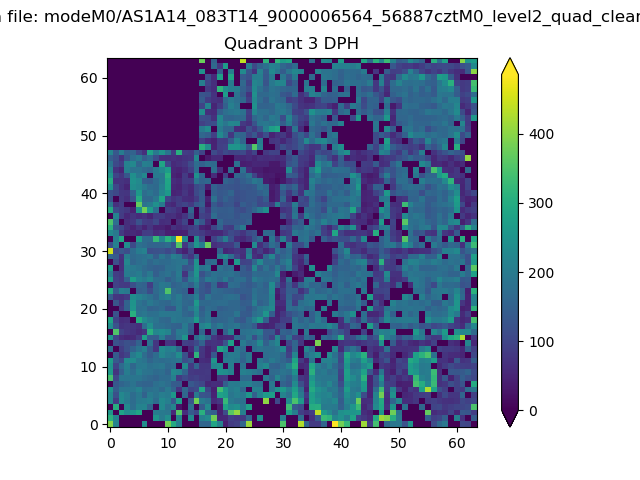 |
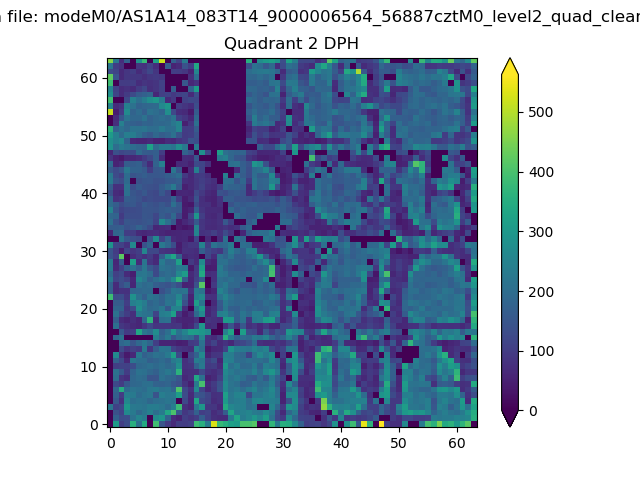 |
Quadrant C |
| Plot type | Count rate plots | Images |
|---|---|---|
| Comparison with Poisson distribution Blue bars denote a histogram of data divided into 1 sec bins. Red curve is a Poisson curve with rate = median count rate of data. |
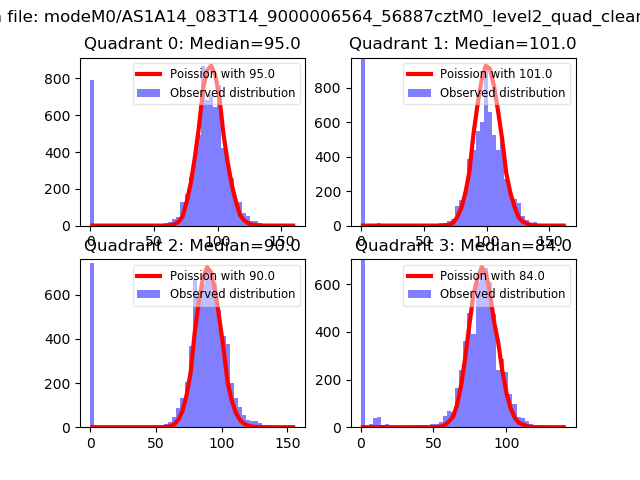 |
 |
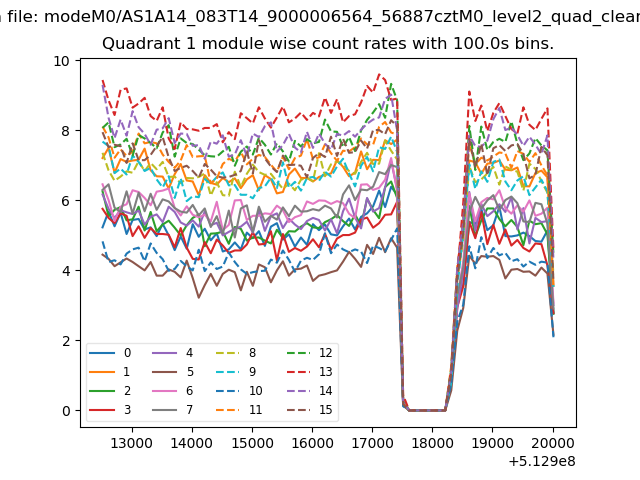
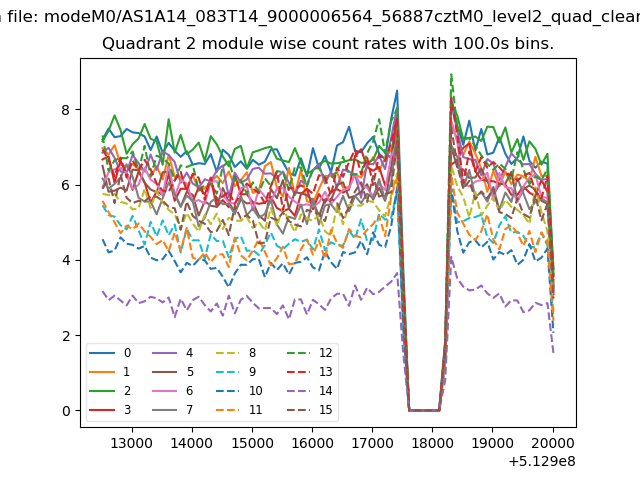
| Quadrant-wise count rates Data is divided into 100 sec bins |
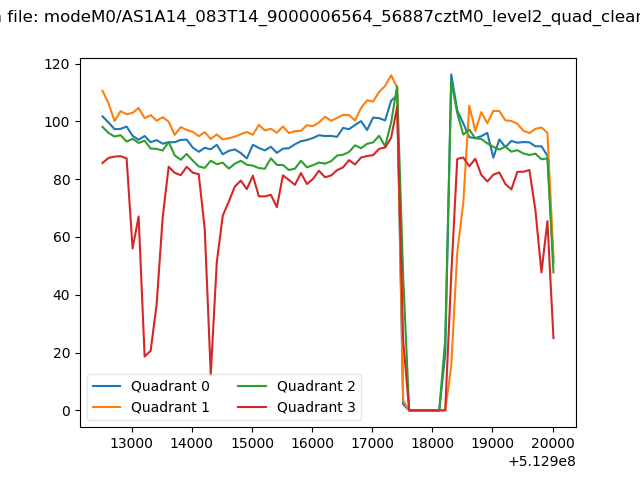 |
|
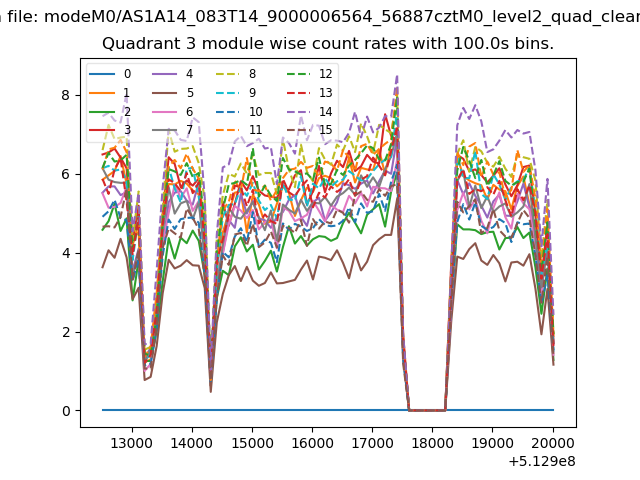
| Module-wise count rates for Quadrant A Data is divided into 100 sec bins |
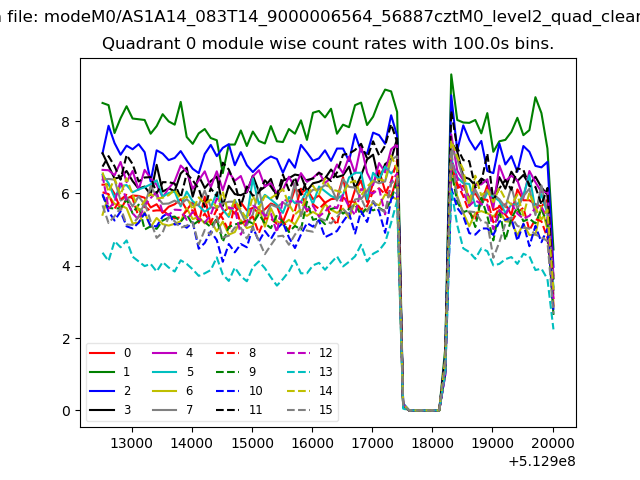 |
 |
| Module-wise count rates for Quadrant B Data is divided into 100 sec bins |
 |
 |
| Module-wise count rates for Quadrant C Data is divided into 100 sec bins |
 |
 |
| Module-wise count rates for Quadrant D Data is divided into 100 sec bins |
 |
 |
| Parameter | Plot |
|---|---|
| CZT HV Monitor | 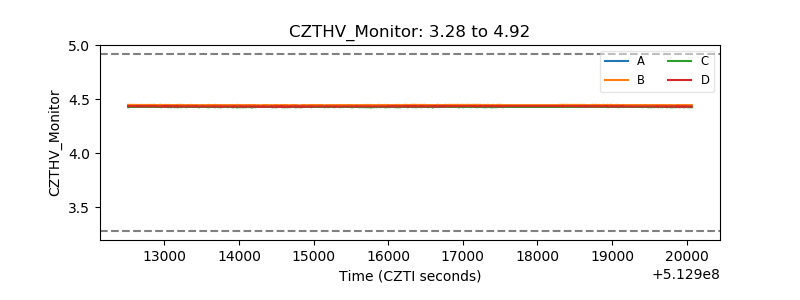 |
| D_VDD | 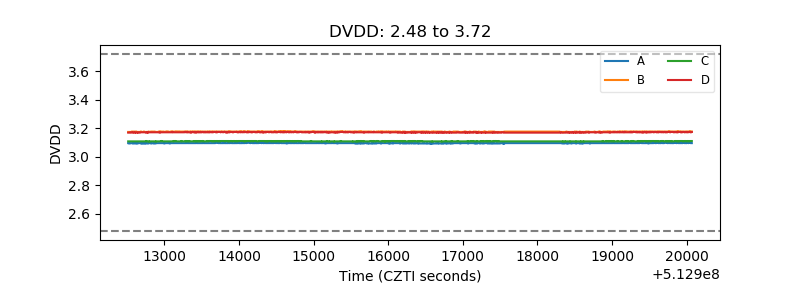 |
| Temperature 1 |  |
| Veto HV Monitor | 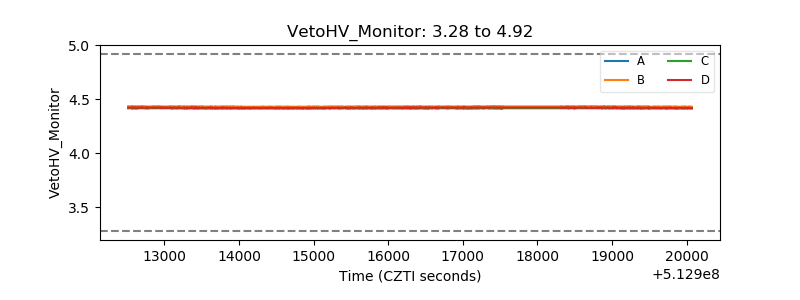 |
| Veto LLD | 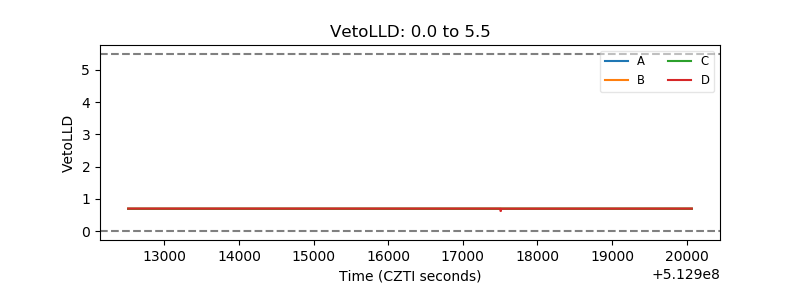 |
| Alpha Counter | 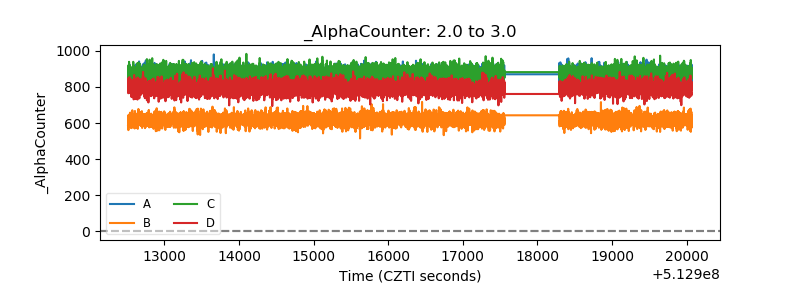 |
| _CPM_Rate | 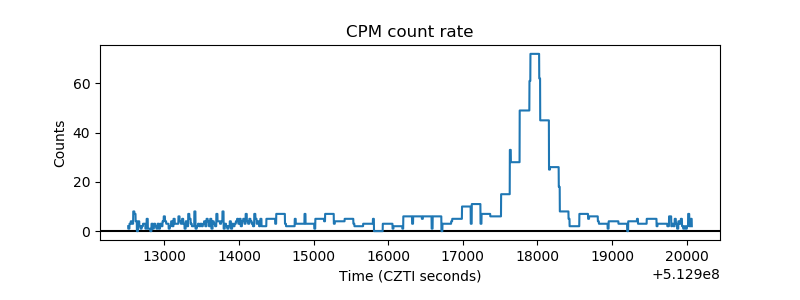 |
| CZT Counter | 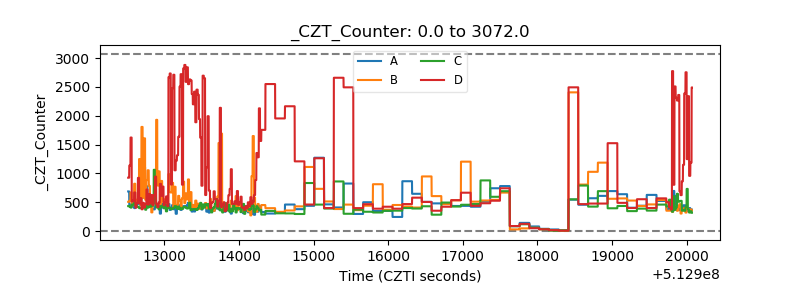 |
| +2.5 Volts monitor |  |
| +5 Volts monitor | 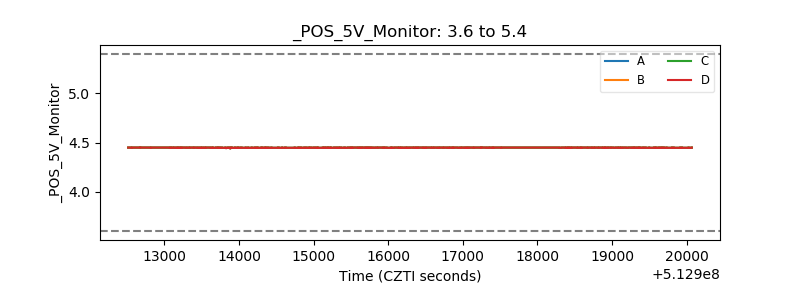 |
| _ROLL_ROT | 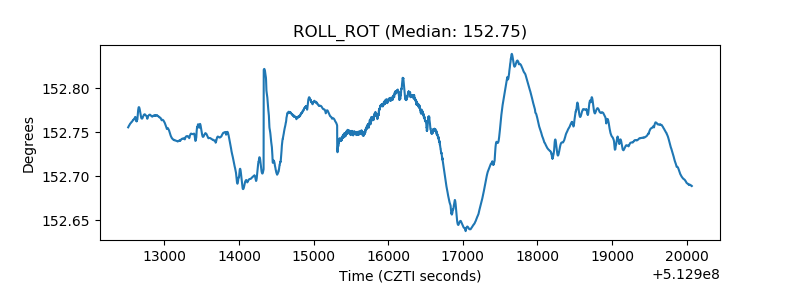 |
| _Roll_DEC | 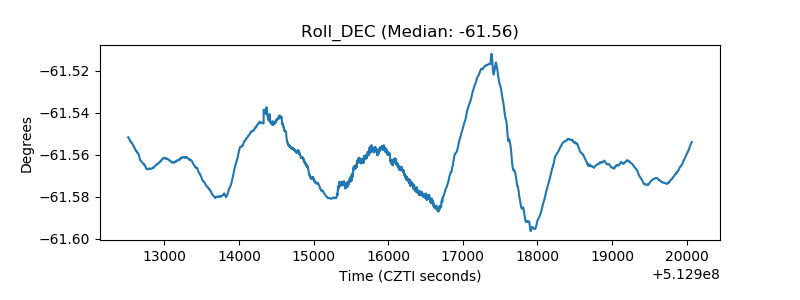 |
| _Roll_RA | 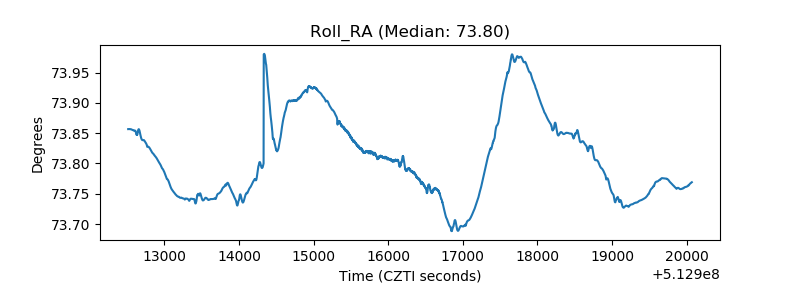 |
| Veto Counter | 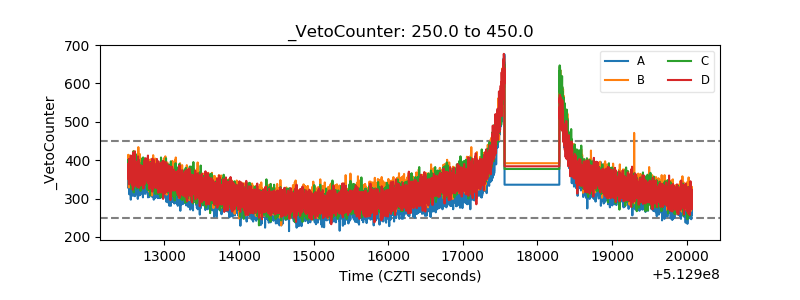 |