| Param | Original file | Final file |
|---|---|---|
| Filename | modeM0/AS1A14_083T14_9000006564_56888cztM0_level2.fits | modeM0/AS1A14_083T14_9000006564_56888cztM0_level2_quad_clean.evt |
| Size (bytes) | 488,900,160 | 109,632,960 |
| Size | 466.3 MB | 104.6 MB |
| Events in quadrant A | 3,451,131 | 732,127 |
| Events in quadrant B | 3,932,147 | 759,736 |
| Events in quadrant C | 3,957,280 | 696,810 |
| Events in quadrant D | 6,163,776 | 600,662 |
| Mode SS | |||
|---|---|---|---|
| Quadrant | BADHDUFLAG | Total packets | Discarded packets |
| A | 0 | 152 | 0 |
| B | 0 | 152 | 2 |
| C | 0 | 152 | 0 |
| D | 0 | 152 | 0 |
| Mode M0 | |||
|---|---|---|---|
| Quadrant | BADHDUFLAG | Total packets | Discarded packets |
| A | 0 | 16253 | 20 |
| B | 0 | 17412 | 16 |
| C | 0 | 17582 | 10 |
| D | 0 | 23824 | 53 |
| Quadrant | Total seconds | Saturated seconds | Saturation percentage |
|---|---|---|---|
| A | 7627 | 97 | 1.271798% |
| B | 7628 | 256 | 3.356057% |
| C | 7629 | 72 | 0.943767% |
| D | 7623 | 822 | 10.783156% |
Noise dominated data is calculated using 1-second bins in cleaned event files. If a bin has >2000 counts, and if more than 50% of those come from <1% of pixels, then it is considered to be noise-dominated and hence unusable.
| Quadrant | # 1 sec bins | Bins with >0 counts | Bins with >2000 counts | High rate bins dominated by noise | Noise dominated (total time) | Noise dominated (detector-on time) | Marked lightcurve |
|---|---|---|---|---|---|---|---|
| A | 7683 | 7635 | 18 | 18 | 0.23% | 0.24% | 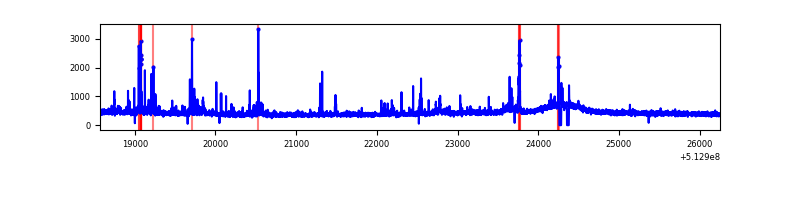 |
| B | 7683 | 7635 | 94 | 94 | 1.22% | 1.23% | 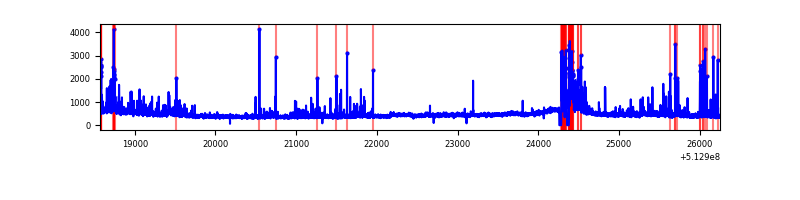 |
| C | 7683 | 7635 | 30 | 30 | 0.39% | 0.39% | 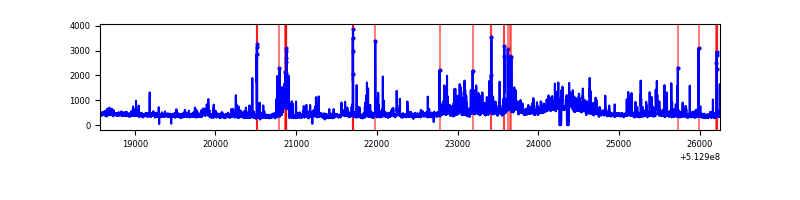 |
| D | 7683 | 7635 | 815 | 815 | 10.61% | 10.67% | 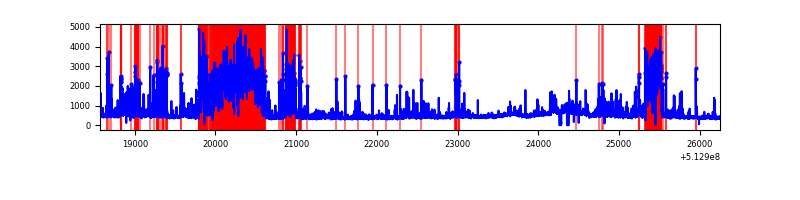 |
Top three noisy pixels from each quadrant. If the there are fewer than three noisy pixels in the level2.evt file, extra rows are filled as -1
| Pixel properties | Quadrant properties | ||||||
|---|---|---|---|---|---|---|---|
| Quadrant | DetID | PixID | Counts | Sigma | Mean | Median | Sigma |
| A | 3 | 14 | 87752 | 431.38 | 813 | 792 | 201.6 |
| A | 10 | 251 | 83425 | 409.92 | 813 | 792 | 201.6 |
| A | 8 | 249 | 73914 | 362.74 | 813 | 792 | 201.6 |
| B | 10 | 16 | 364226 | 2137.81 | 783 | 752 | 170.0 |
| B | 5 | 185 | 137103 | 801.96 | 783 | 752 | 170.0 |
| B | 10 | 247 | 71493 | 416.07 | 783 | 752 | 170.0 |
| C | 13 | 3 | 241993 | 1123.36 | 779 | 770 | 214.7 |
| C | 6 | 9 | 230214 | 1068.5 | 779 | 770 | 214.7 |
| C | 1 | 16 | 121551 | 562.47 | 779 | 770 | 214.7 |
| D | 2 | 249 | 2186592 | 10273.84 | 752 | 718 | 212.8 |
| D | 8 | 160 | 331479 | 1554.61 | 752 | 718 | 212.8 |
| D | 8 | 240 | 282791 | 1325.77 | 752 | 718 | 212.8 |
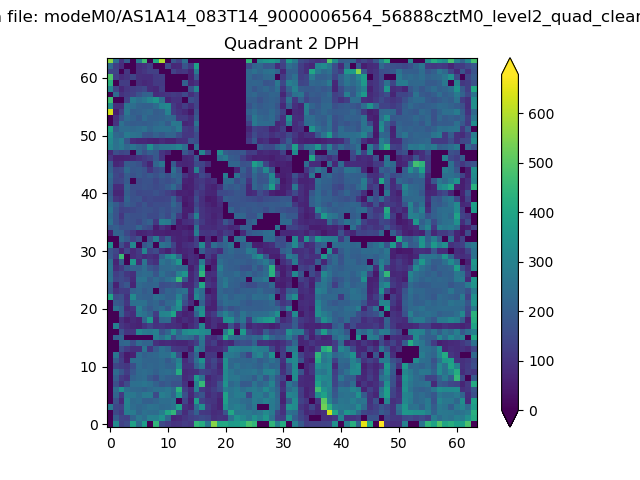
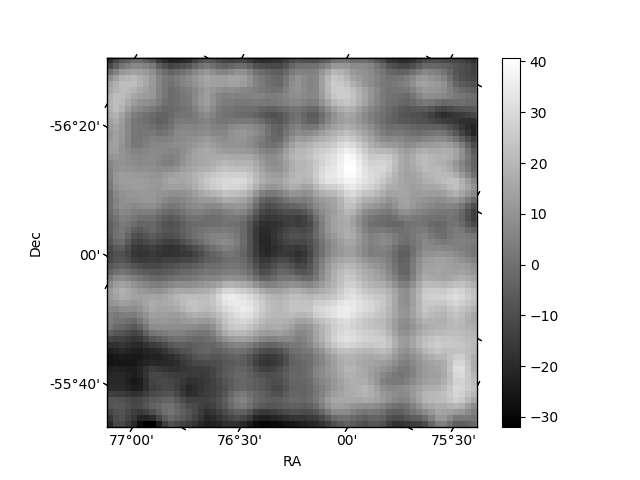
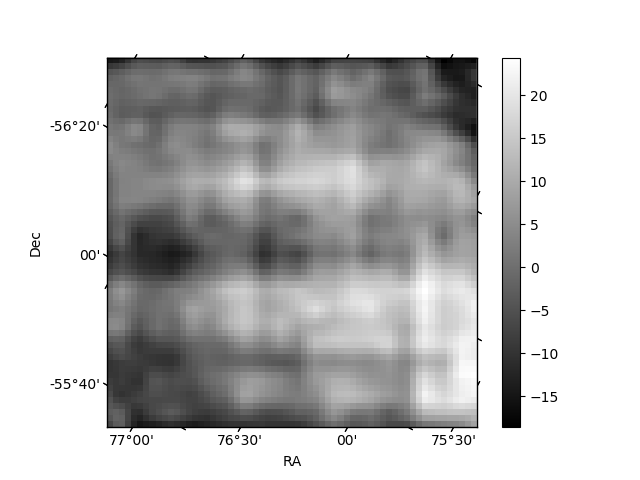
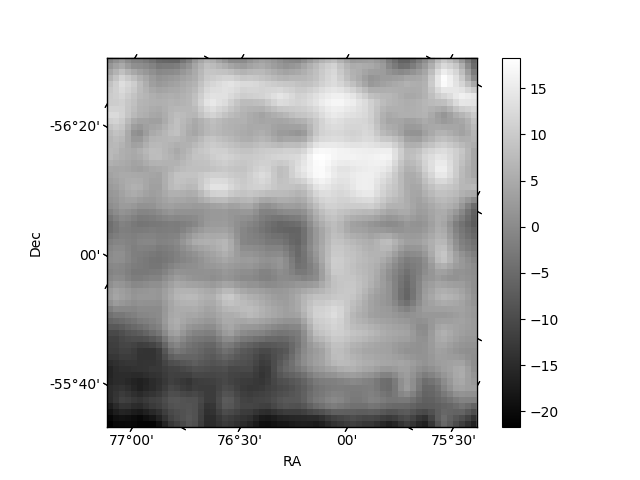
Histogram calculated using DETX and DETY for each event in the final _common_clean file
| Quadrant A | 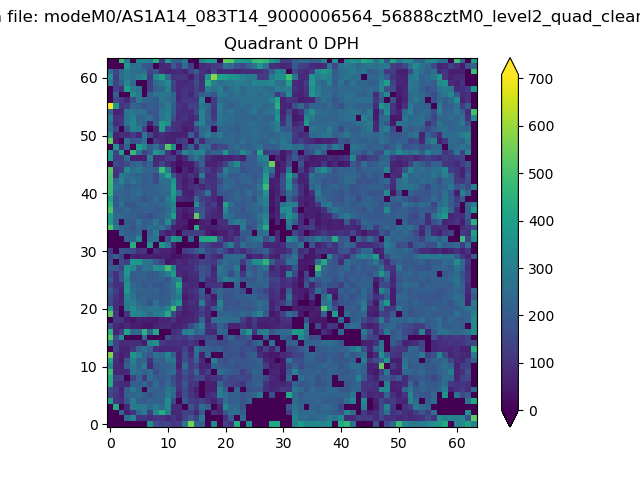 |
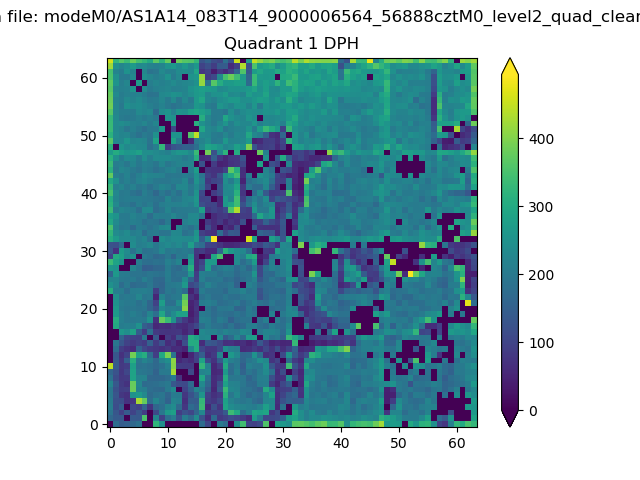 |
Quadrant B |
|---|---|---|---|
| Quadrant D | 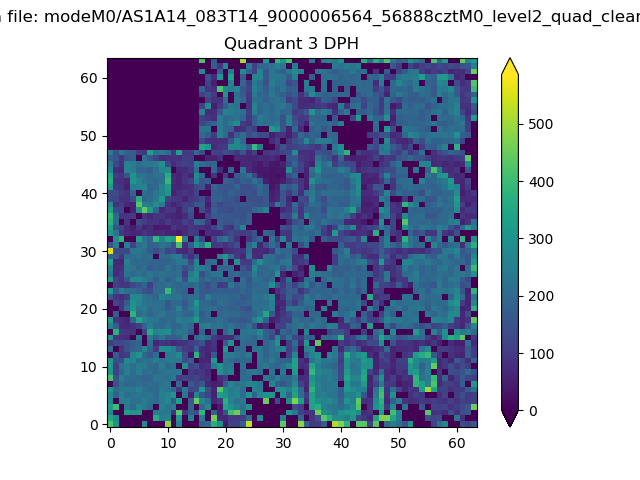 |
 |
Quadrant C |
| Plot type | Count rate plots | Images |
|---|---|---|
| Comparison with Poisson distribution Blue bars denote a histogram of data divided into 1 sec bins. Red curve is a Poisson curve with rate = median count rate of data. |
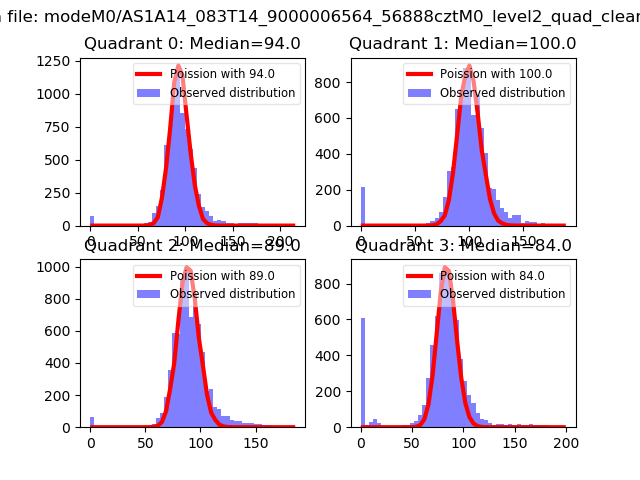 |
 |
| Quadrant-wise count rates Data is divided into 100 sec bins |
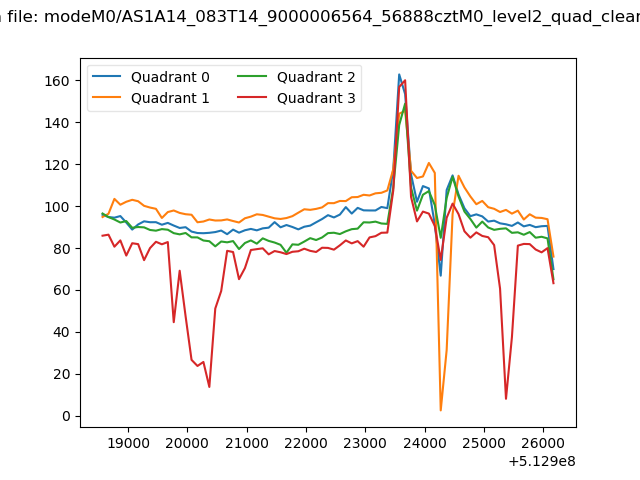 |
|
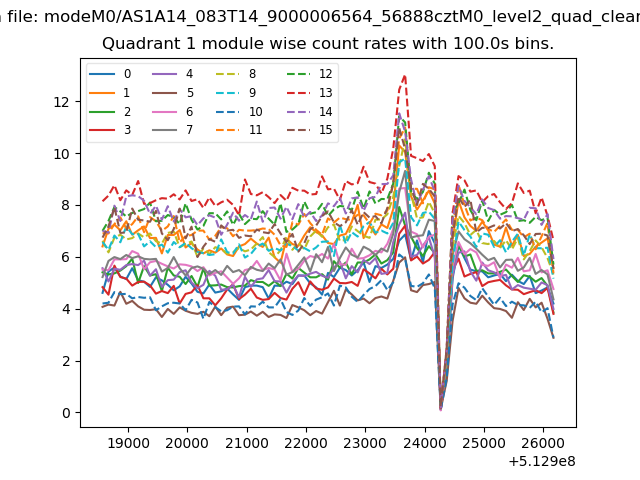
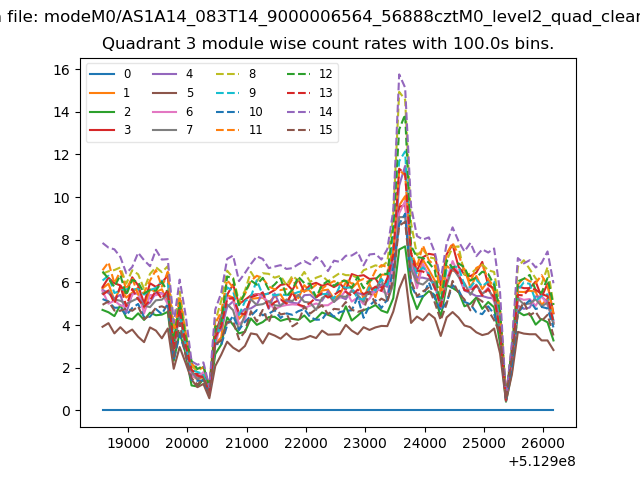
| Module-wise count rates for Quadrant A Data is divided into 100 sec bins |
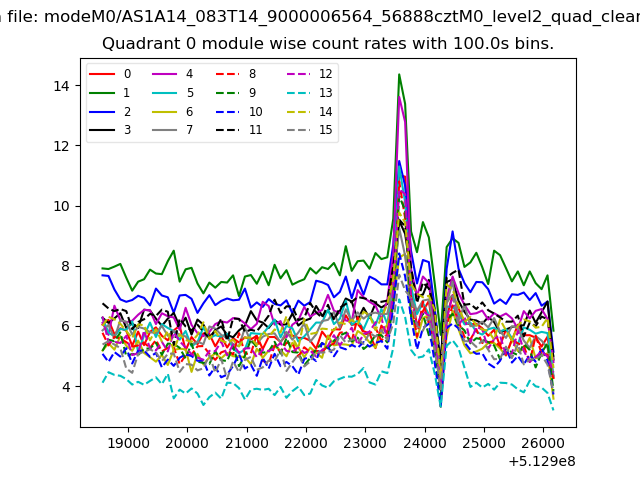 |
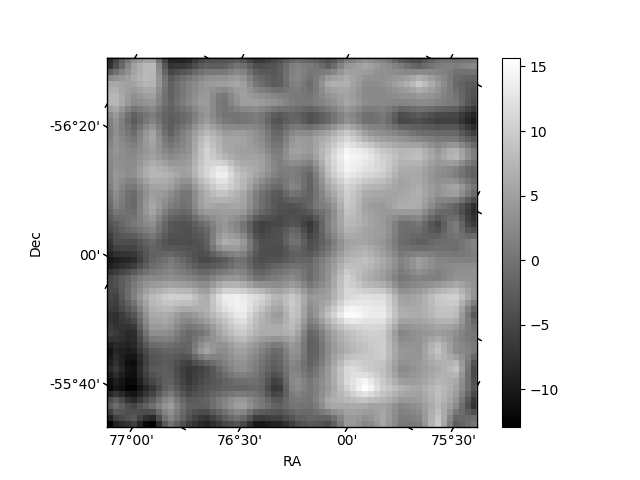 |
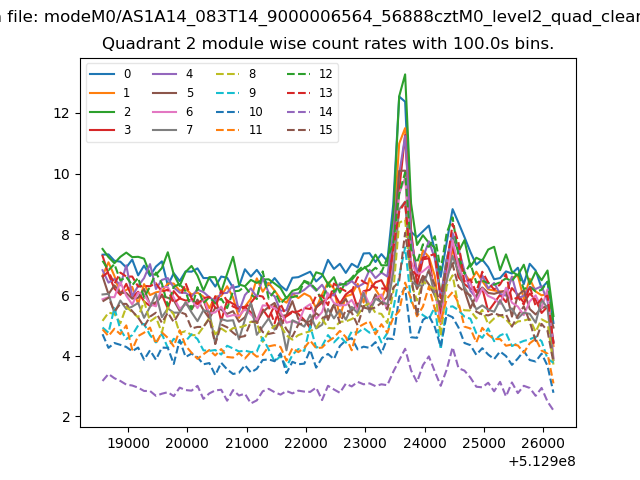
| Module-wise count rates for Quadrant B Data is divided into 100 sec bins |
 |
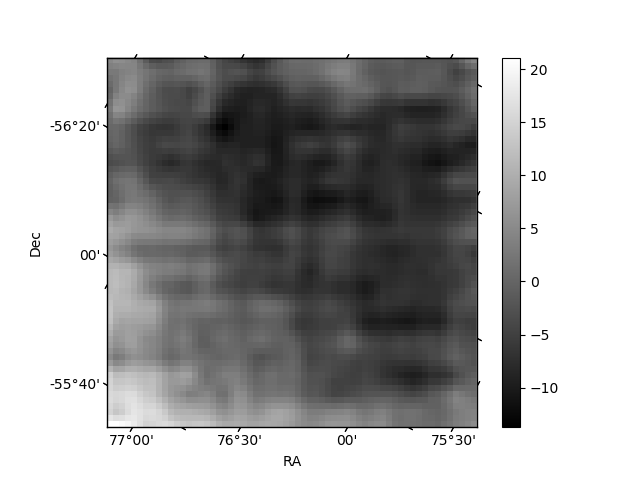 |
| Module-wise count rates for Quadrant C Data is divided into 100 sec bins |
 |
 |
| Module-wise count rates for Quadrant D Data is divided into 100 sec bins |
 |
 |
| Parameter | Plot |
|---|---|
| CZT HV Monitor | 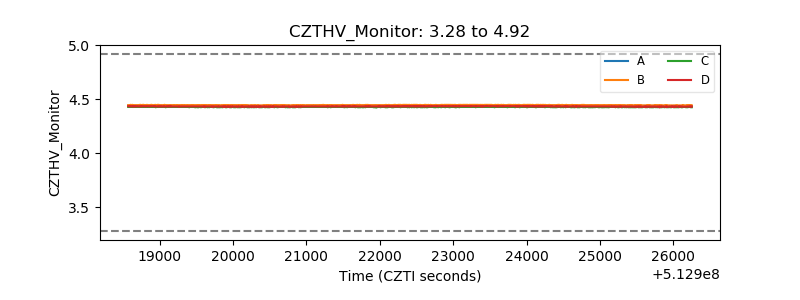 |
| D_VDD | 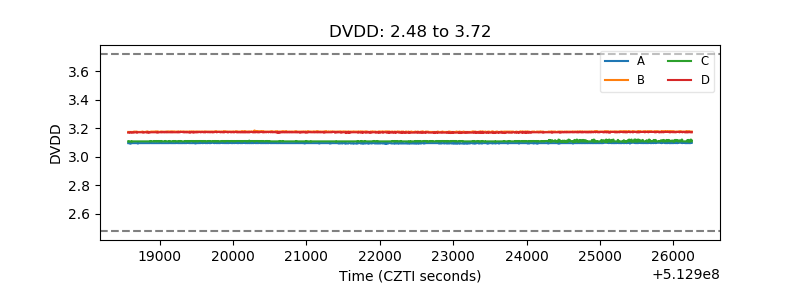 |
| Temperature 1 | 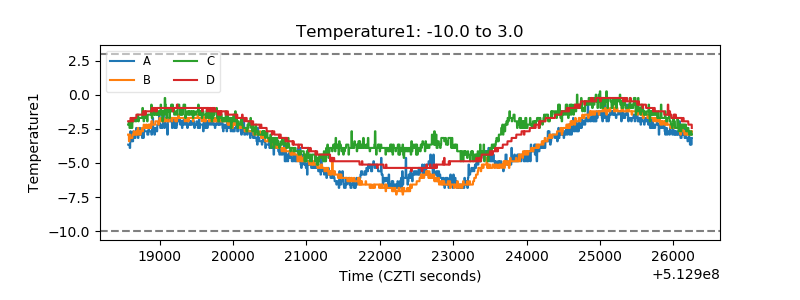 |
| Veto HV Monitor | 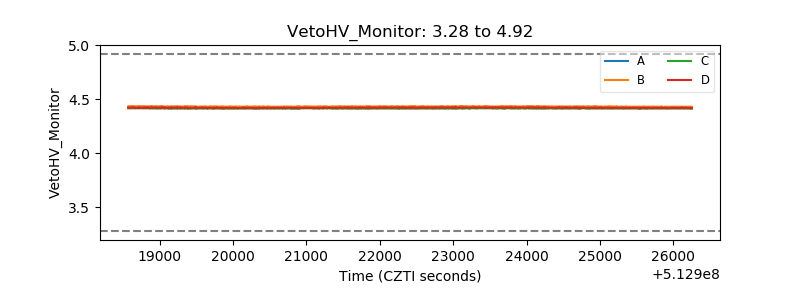 |
| Veto LLD | 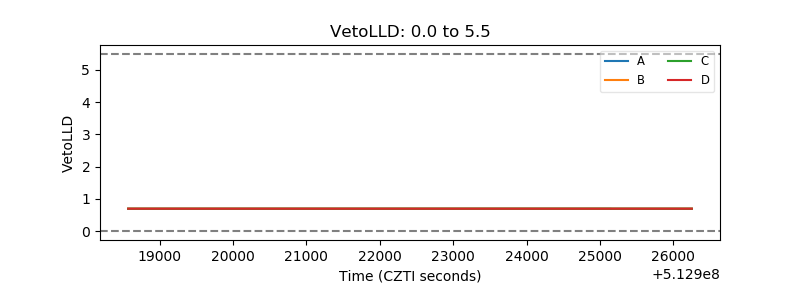 |
| Alpha Counter | 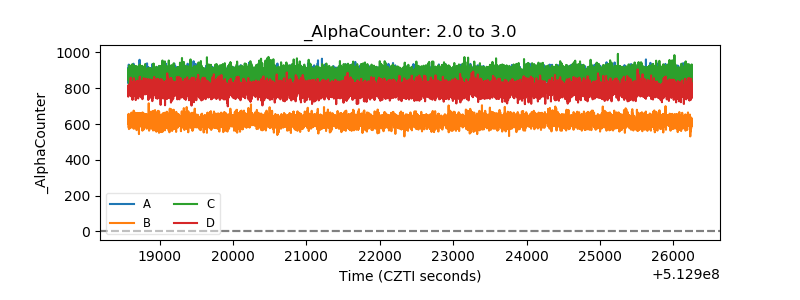 |
| _CPM_Rate | 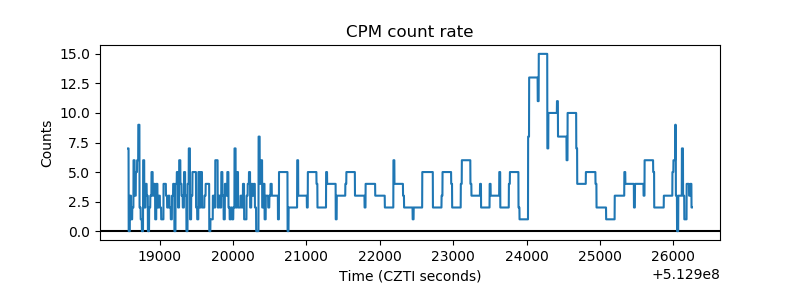 |
| CZT Counter | 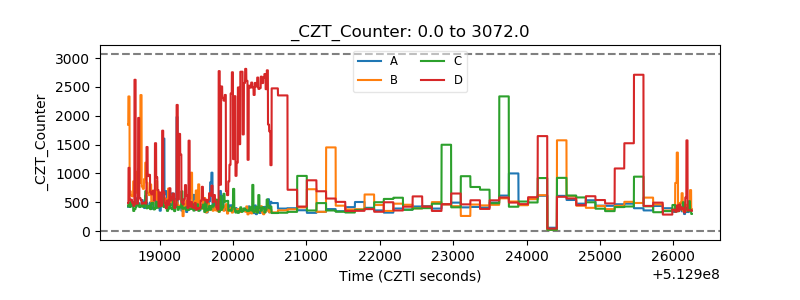 |
| +2.5 Volts monitor | 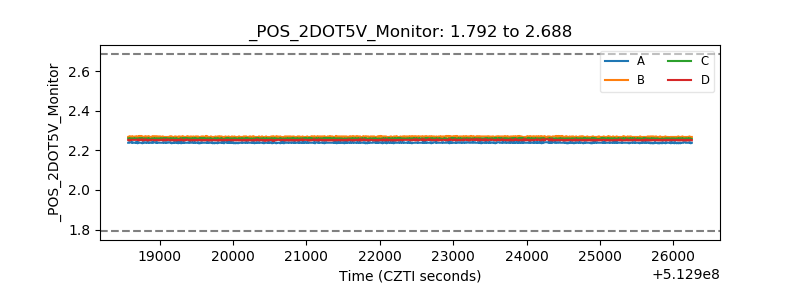 |
| +5 Volts monitor | 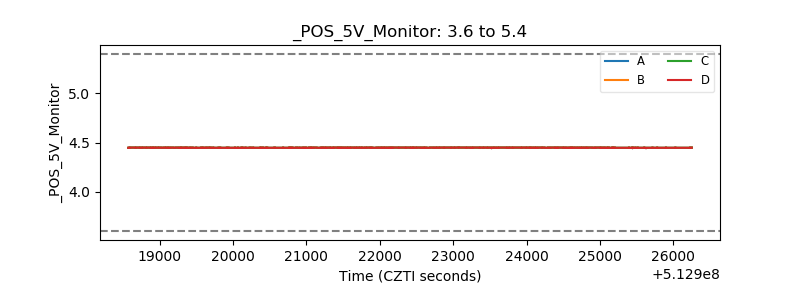 |
| _ROLL_ROT | 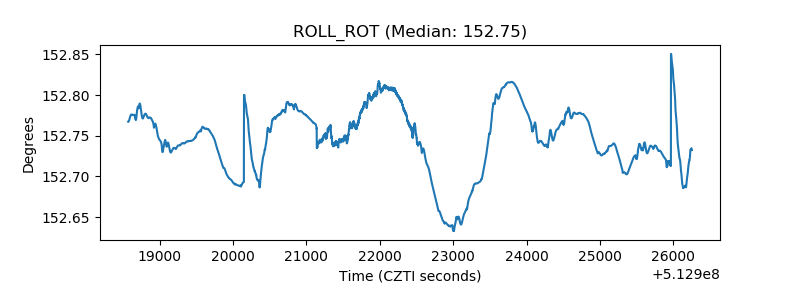 |
| _Roll_DEC | 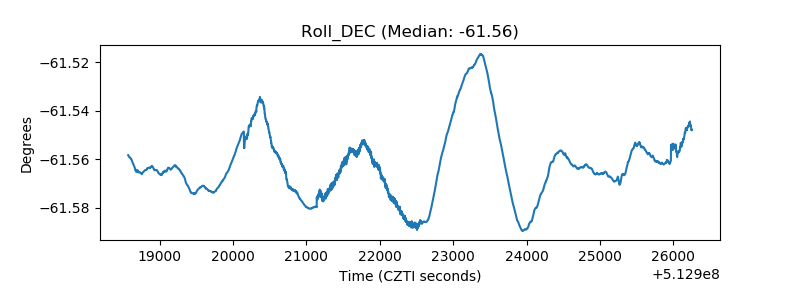 |
| _Roll_RA | 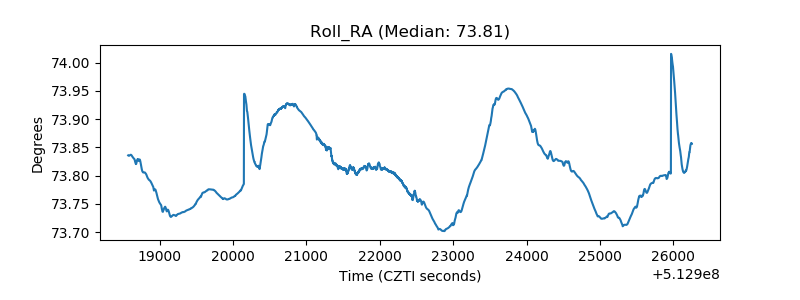 |
| Veto Counter | 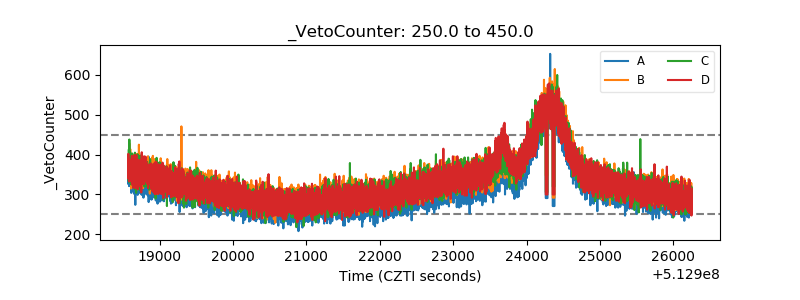 |