| Param | Original file | Final file |
|---|---|---|
| Filename | modeM0/AS1A14_083T14_9000006564_56889cztM0_level2.fits | modeM0/AS1A14_083T14_9000006564_56889cztM0_level2_quad_clean.evt |
| Size (bytes) | 403,462,080 | 97,341,120 |
| Size | 384.8 MB | 92.8 MB |
| Events in quadrant A | 3,053,401 | 638,852 |
| Events in quadrant B | 3,133,310 | 682,577 |
| Events in quadrant C | 3,438,126 | 601,599 |
| Events in quadrant D | 4,776,548 | 546,912 |
| Mode SS | |||
|---|---|---|---|
| Quadrant | BADHDUFLAG | Total packets | Discarded packets |
| A | 0 | 140 | 6 |
| B | 0 | 140 | 2 |
| C | 0 | 140 | 2 |
| D | 0 | 140 | 4 |
| Mode M0 | |||
|---|---|---|---|
| Quadrant | BADHDUFLAG | Total packets | Discarded packets |
| A | 0 | 14717 | 331 |
| B | 0 | 14764 | 290 |
| C | 0 | 15717 | 487 |
| D | 0 | 19544 | 538 |
| Quadrant | Total seconds | Saturated seconds | Saturation percentage |
|---|---|---|---|
| A | 6854 | 21 | 0.306390% |
| B | 6862 | 37 | 0.539201% |
| C | 6841 | 63 | 0.920918% |
| D | 6854 | 424 | 6.186169% |
Noise dominated data is calculated using 1-second bins in cleaned event files. If a bin has >2000 counts, and if more than 50% of those come from <1% of pixels, then it is considered to be noise-dominated and hence unusable.
| Quadrant | # 1 sec bins | Bins with >0 counts | Bins with >2000 counts | High rate bins dominated by noise | Noise dominated (total time) | Noise dominated (detector-on time) | Marked lightcurve |
|---|---|---|---|---|---|---|---|
| A | 7000 | 6935 | 17 | 17 | 0.24% | 0.25% | 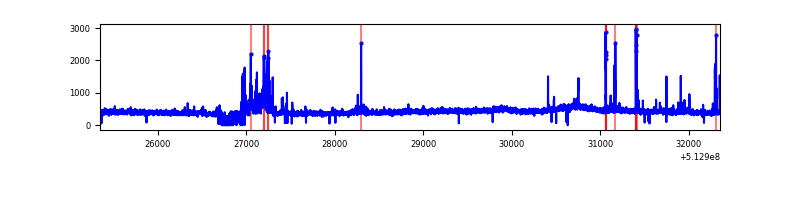 |
| B | 7000 | 6934 | 27 | 27 | 0.39% | 0.39% | 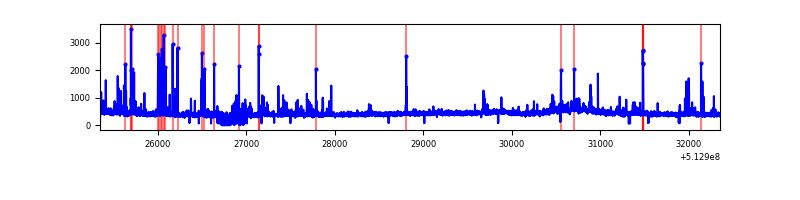 |
| C | 7001 | 6911 | 47 | 47 | 0.67% | 0.68% | 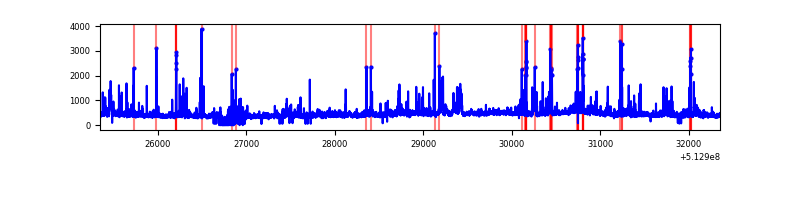 |
| D | 7001 | 6910 | 378 | 378 | 5.40% | 5.47% | 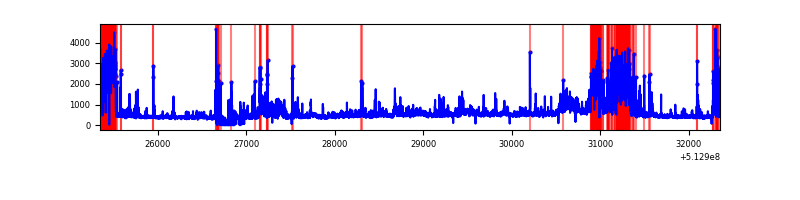 |
Top three noisy pixels from each quadrant. If the there are fewer than three noisy pixels in the level2.evt file, extra rows are filled as -1
| Pixel properties | Quadrant properties | ||||||
|---|---|---|---|---|---|---|---|
| Quadrant | DetID | PixID | Counts | Sigma | Mean | Median | Sigma |
| A | 12 | 3 | 149221 | 844.16 | 706 | 686 | 176.0 |
| A | 4 | 249 | 66157 | 372.09 | 706 | 686 | 176.0 |
| A | 12 | 194 | 28603 | 158.66 | 706 | 686 | 176.0 |
| B | 8 | 128 | 70763 | 469.49 | 700 | 673 | 149.3 |
| B | 5 | 185 | 61306 | 406.14 | 700 | 673 | 149.3 |
| B | 0 | 153 | 39210 | 258.13 | 700 | 673 | 149.3 |
| C | 13 | 3 | 238925 | 1271.21 | 677 | 670 | 187.4 |
| C | 12 | 249 | 138020 | 732.83 | 677 | 670 | 187.4 |
| C | 1 | 16 | 94781 | 502.13 | 677 | 670 | 187.4 |
| D | 2 | 249 | 1069336 | 5701.46 | 661 | 633 | 187.4 |
| D | 0 | 160 | 588866 | 3138.18 | 661 | 633 | 187.4 |
| D | 8 | 240 | 175878 | 934.92 | 661 | 633 | 187.4 |
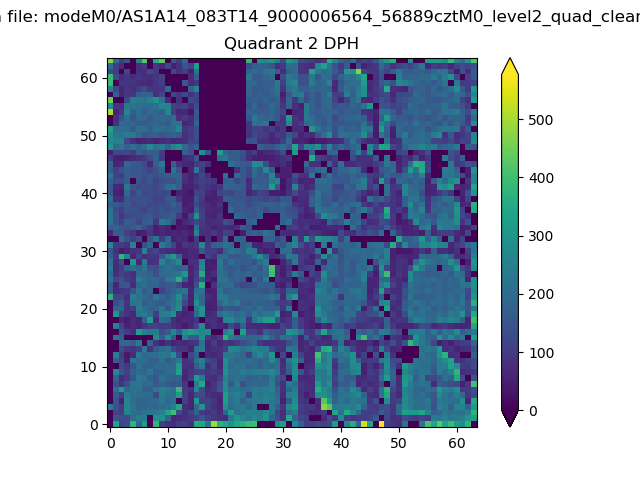
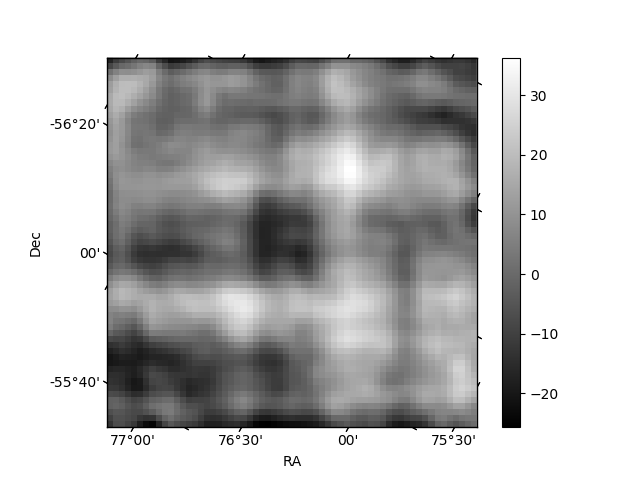
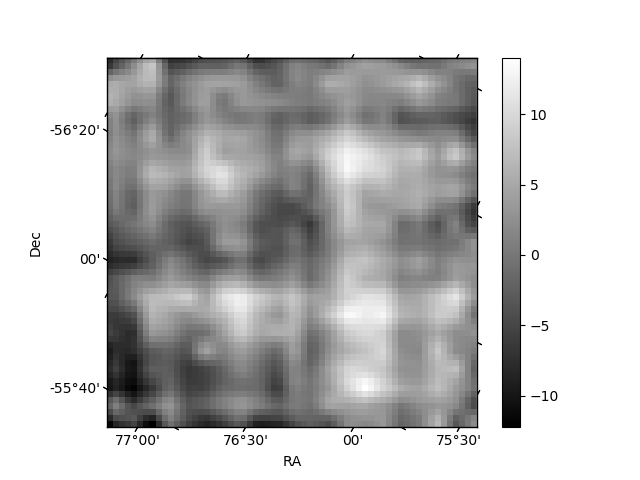
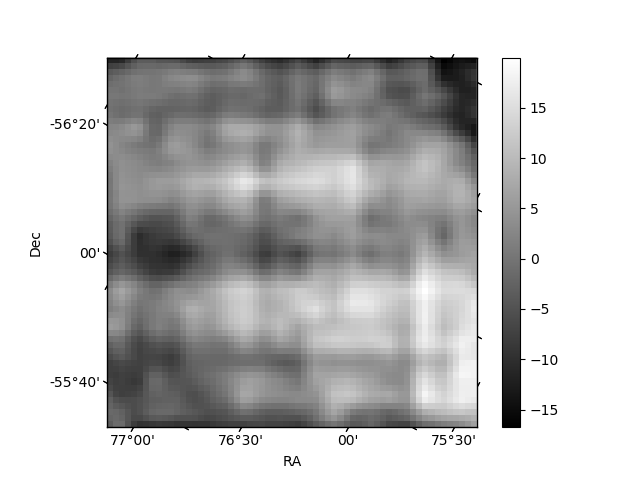
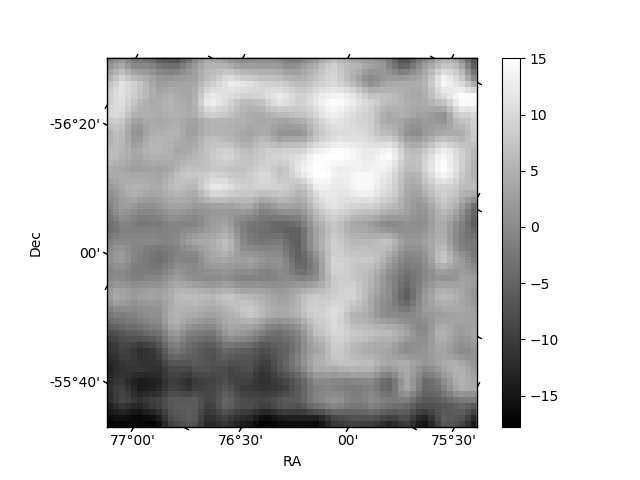
Histogram calculated using DETX and DETY for each event in the final _common_clean file
| Quadrant A | 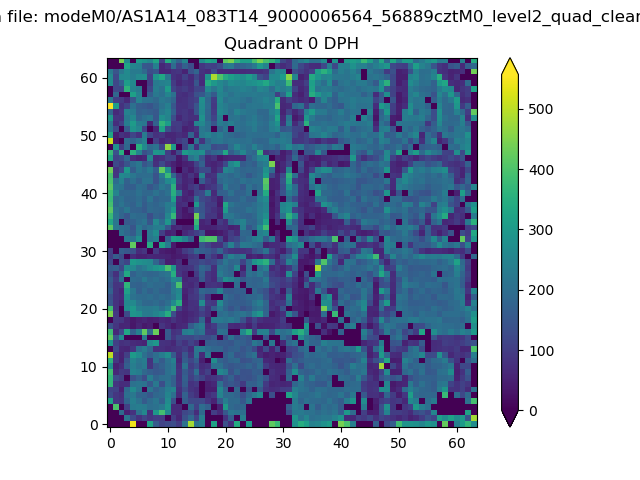 |
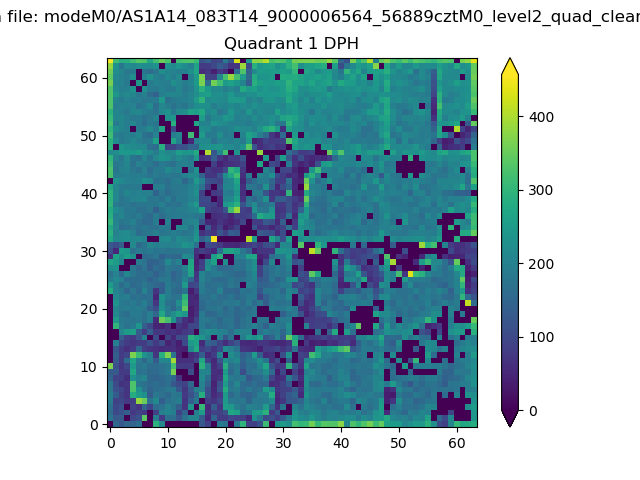 |
Quadrant B |
|---|---|---|---|
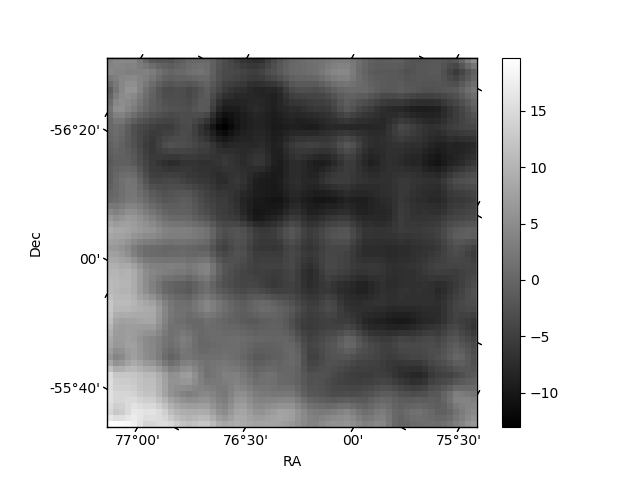
| Quadrant D | 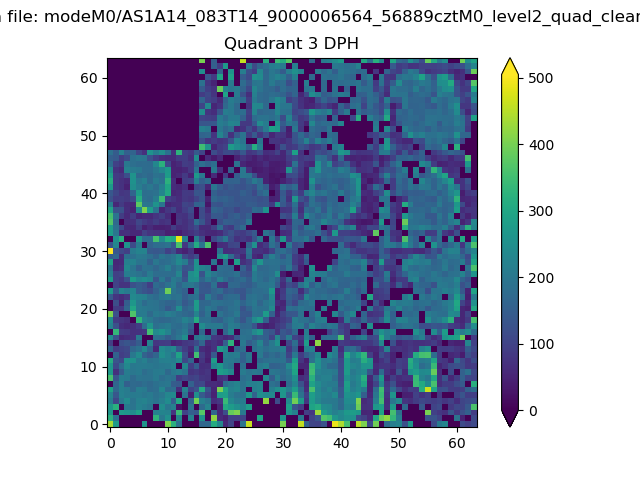 |
 |
Quadrant C |
| Plot type | Count rate plots | Images |
|---|---|---|
| Comparison with Poisson distribution Blue bars denote a histogram of data divided into 1 sec bins. Red curve is a Poisson curve with rate = median count rate of data. |
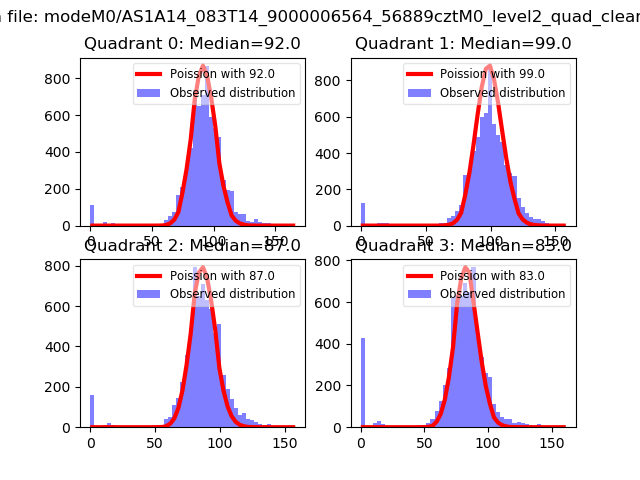 |
 |
| Quadrant-wise count rates Data is divided into 100 sec bins |
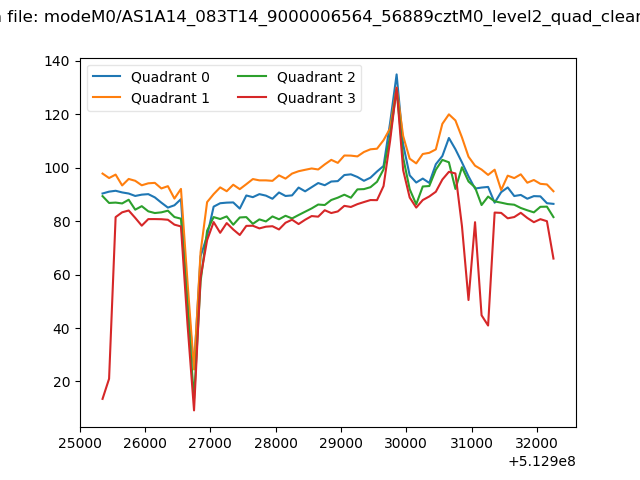 |
|
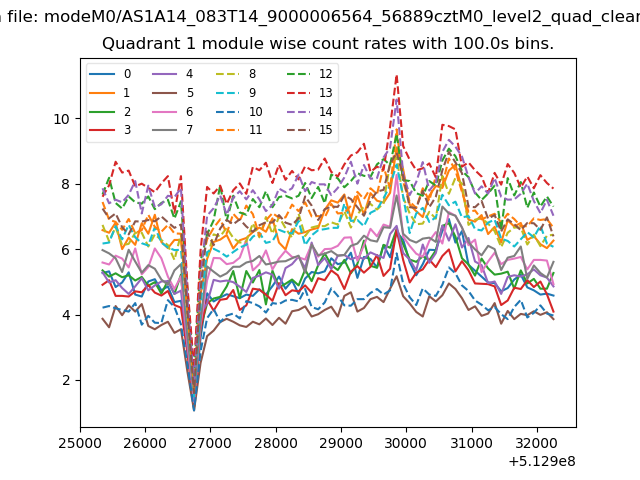
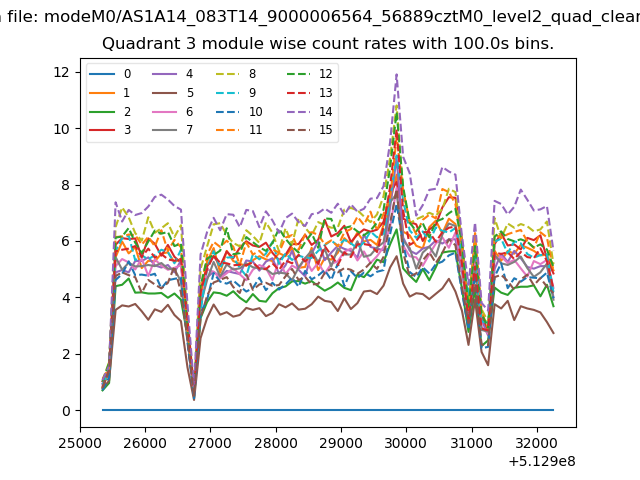
| Module-wise count rates for Quadrant A Data is divided into 100 sec bins |
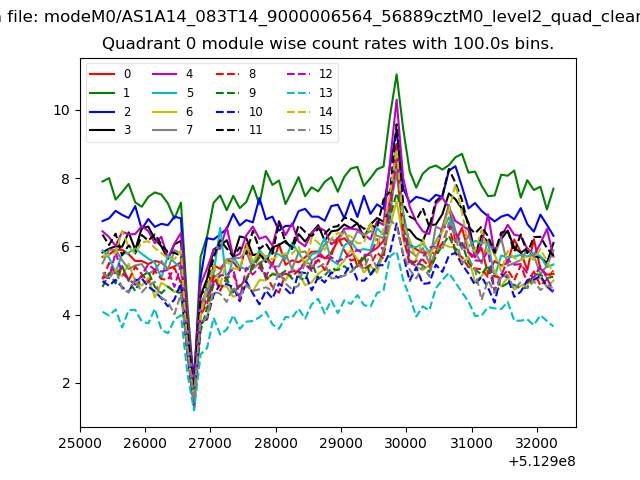 |
 |
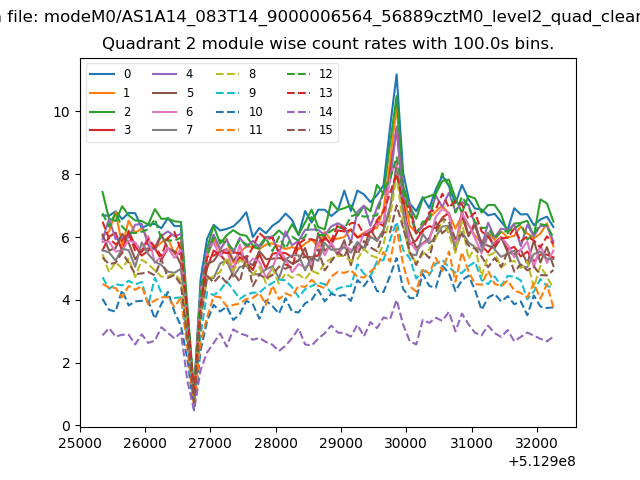
| Module-wise count rates for Quadrant B Data is divided into 100 sec bins |
 |
 |
| Module-wise count rates for Quadrant C Data is divided into 100 sec bins |
 |
 |
| Module-wise count rates for Quadrant D Data is divided into 100 sec bins |
 |
 |
| Parameter | Plot |
|---|---|
| CZT HV Monitor | 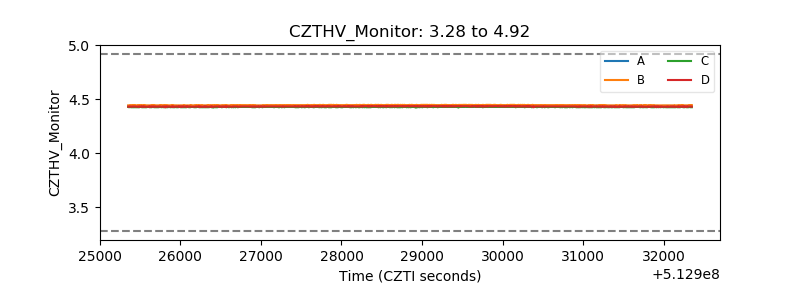 |
| D_VDD | 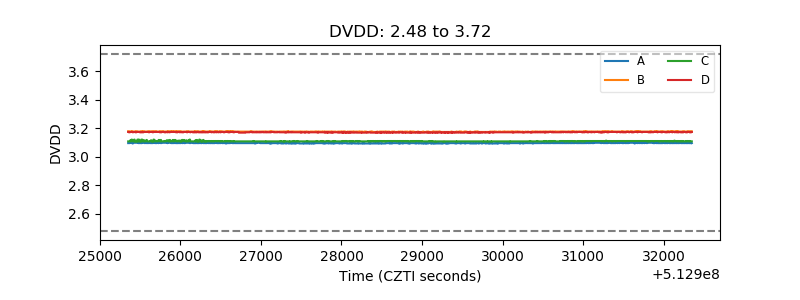 |
| Temperature 1 | 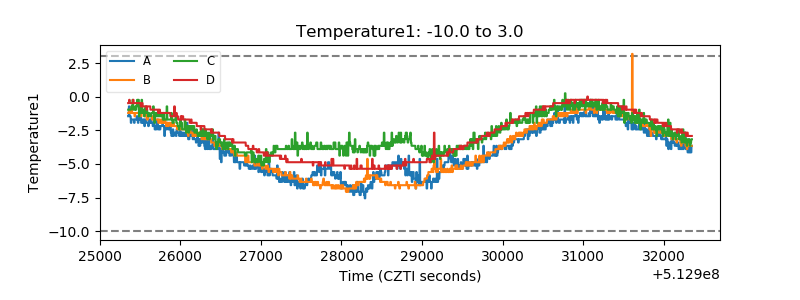 |
| Veto HV Monitor | 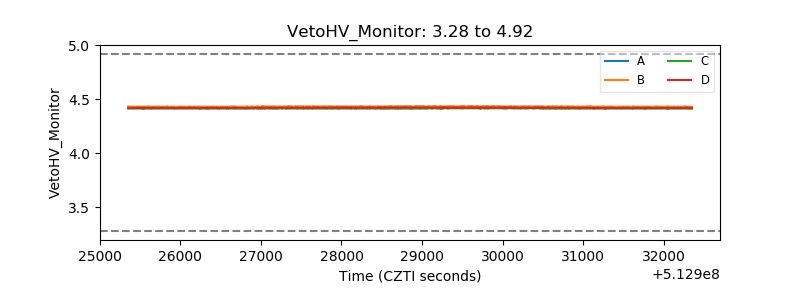 |
| Veto LLD | 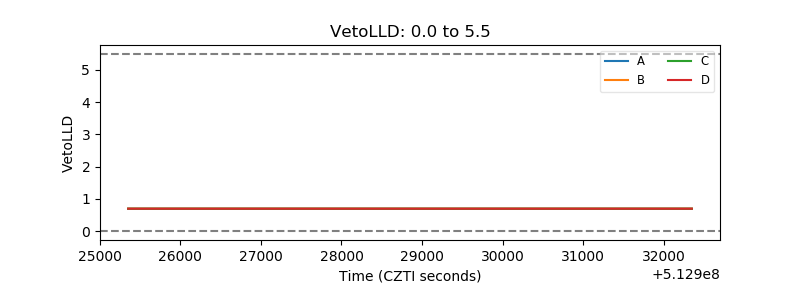 |
| Alpha Counter | 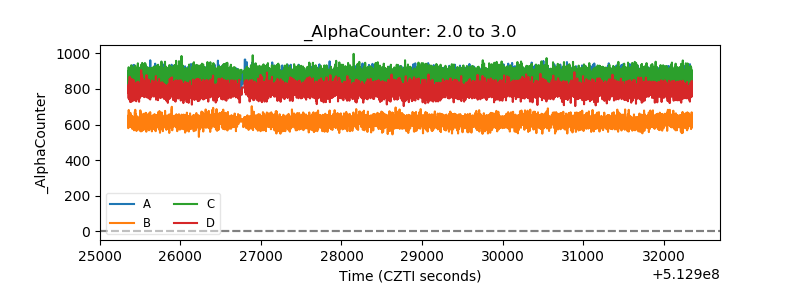 |
| _CPM_Rate | 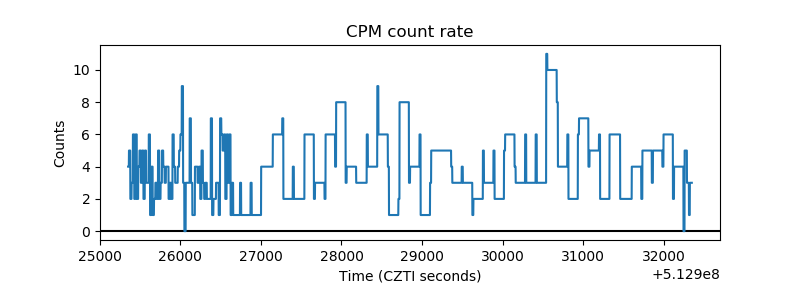 |
| CZT Counter | 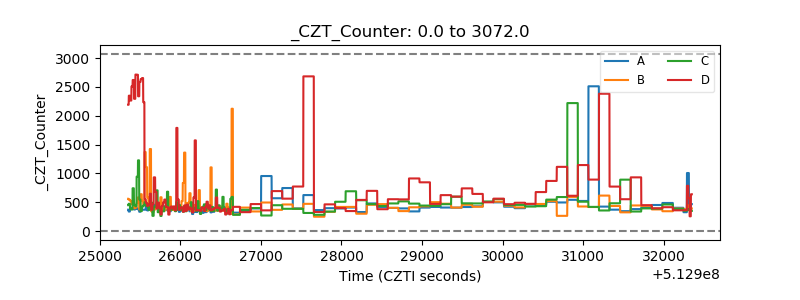 |
| +2.5 Volts monitor |  |
| +5 Volts monitor | 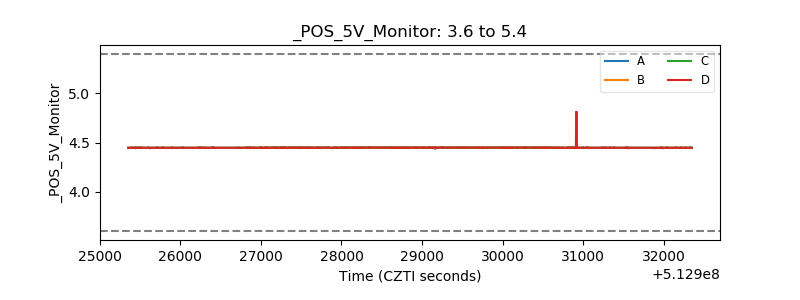 |
| _ROLL_ROT | 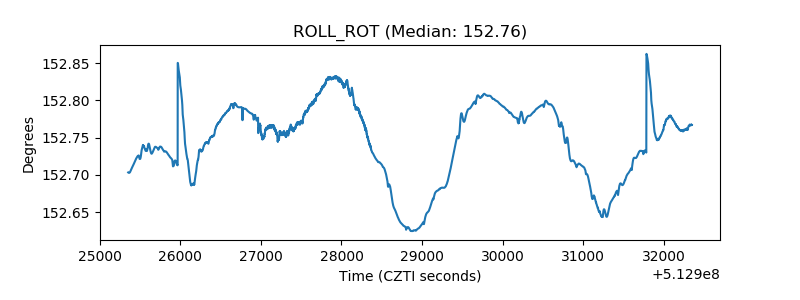 |
| _Roll_DEC | 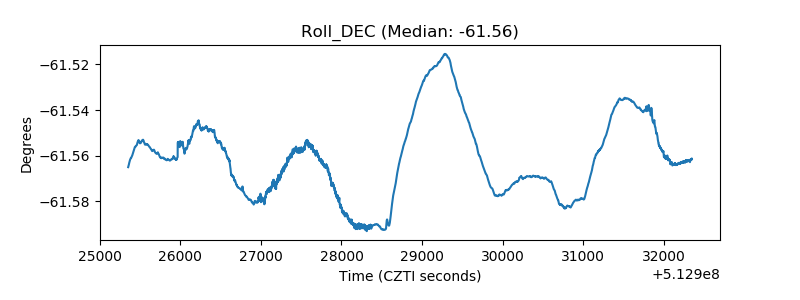 |
| _Roll_RA | 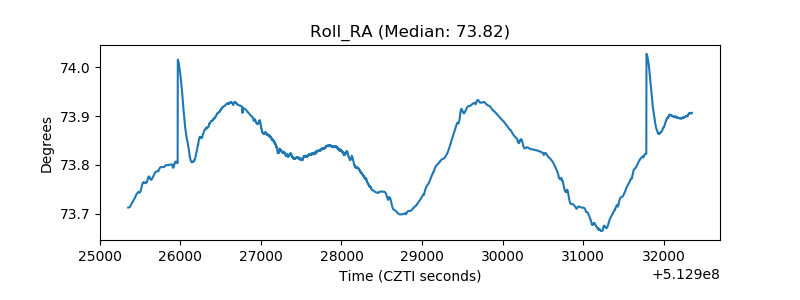 |
| Veto Counter | 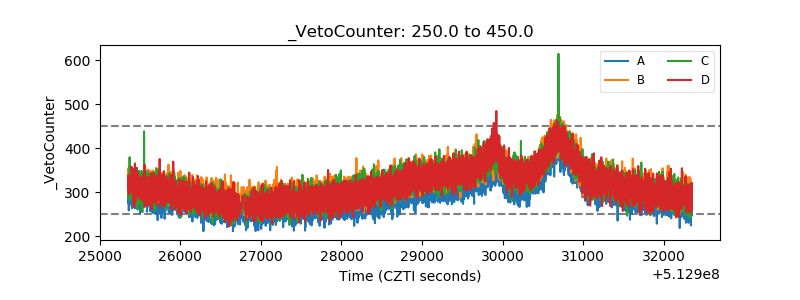 |