| Param | Original file | Final file |
|---|---|---|
| Filename | modeM0/AS1A14_083T14_9000006564_56890cztM0_level2.fits | modeM0/AS1A14_083T14_9000006564_56890cztM0_level2_quad_clean.evt |
| Size (bytes) | 519,888,960 | 113,267,520 |
| Size | 495.8 MB | 108.0 MB |
| Events in quadrant A | 3,946,220 | 754,026 |
| Events in quadrant B | 3,667,341 | 807,066 |
| Events in quadrant C | 4,123,023 | 704,229 |
| Events in quadrant D | 6,883,866 | 606,108 |
| Mode SS | |||
|---|---|---|---|
| Quadrant | BADHDUFLAG | Total packets | Discarded packets |
| A | 0 | 160 | 0 |
| B | 0 | 160 | 0 |
| C | 0 | 160 | 0 |
| D | 0 | 160 | 0 |
| Mode M0 | |||
|---|---|---|---|
| Quadrant | BADHDUFLAG | Total packets | Discarded packets |
| A | 0 | 17727 | 0 |
| B | 0 | 16829 | 0 |
| C | 0 | 18161 | 0 |
| D | 0 | 26162 | 5 |
| Quadrant | Total seconds | Saturated seconds | Saturation percentage |
|---|---|---|---|
| A | 8031 | 82 | 1.021043% |
| B | 8032 | 27 | 0.336155% |
| C | 8032 | 152 | 1.892430% |
| D | 8031 | 996 | 12.401942% |
Noise dominated data is calculated using 1-second bins in cleaned event files. If a bin has >2000 counts, and if more than 50% of those come from <1% of pixels, then it is considered to be noise-dominated and hence unusable.
| Quadrant | # 1 sec bins | Bins with >0 counts | Bins with >2000 counts | High rate bins dominated by noise | Noise dominated (total time) | Noise dominated (detector-on time) | Marked lightcurve |
|---|---|---|---|---|---|---|---|
| A | 8031 | 8031 | 78 | 78 | 0.97% | 0.97% | 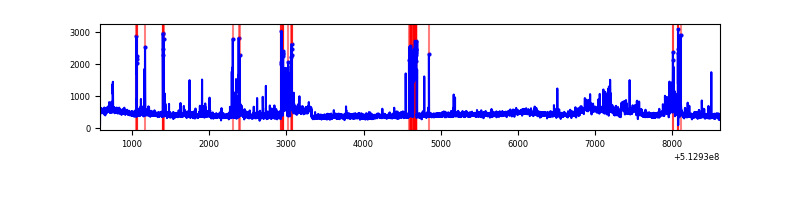 |
| B | 8032 | 8032 | 15 | 15 | 0.19% | 0.19% | 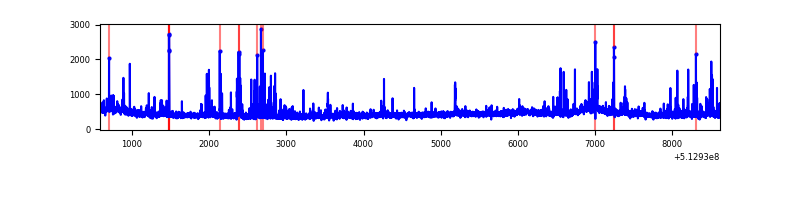 |
| C | 8032 | 8030 | 100 | 100 | 1.25% | 1.25% | 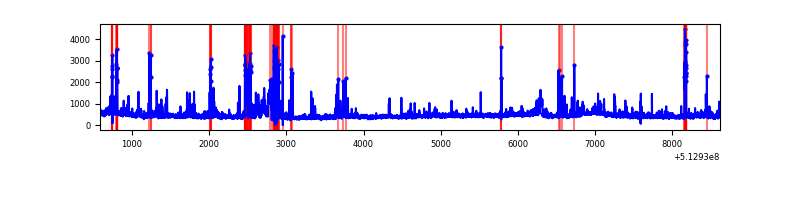 |
| D | 8031 | 8031 | 861 | 861 | 10.72% | 10.72% | 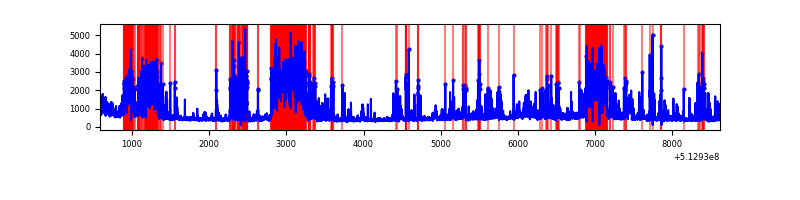 |
Top three noisy pixels from each quadrant. If the there are fewer than three noisy pixels in the level2.evt file, extra rows are filled as -1
| Pixel properties | Quadrant properties | ||||||
|---|---|---|---|---|---|---|---|
| Quadrant | DetID | PixID | Counts | Sigma | Mean | Median | Sigma |
| A | 4 | 249 | 353078 | 1686.04 | 839 | 819 | 208.9 |
| A | 12 | 3 | 155105 | 738.47 | 839 | 819 | 208.9 |
| A | 3 | 14 | 54542 | 257.14 | 839 | 819 | 208.9 |
| B | 10 | 247 | 71242 | 396.48 | 831 | 801 | 177.7 |
| B | 0 | 245 | 50586 | 280.22 | 831 | 801 | 177.7 |
| B | 0 | 153 | 34801 | 191.37 | 831 | 801 | 177.7 |
| C | 13 | 3 | 338343 | 1540.69 | 798 | 791 | 219.1 |
| C | 12 | 249 | 266208 | 1211.45 | 798 | 791 | 219.1 |
| C | 1 | 16 | 116841 | 529.69 | 798 | 791 | 219.1 |
| D | 8 | 240 | 1389492 | 6381.61 | 760 | 723 | 217.6 |
| D | 2 | 249 | 1346575 | 6184.4 | 760 | 723 | 217.6 |
| D | 0 | 160 | 253408 | 1161.13 | 760 | 723 | 217.6 |
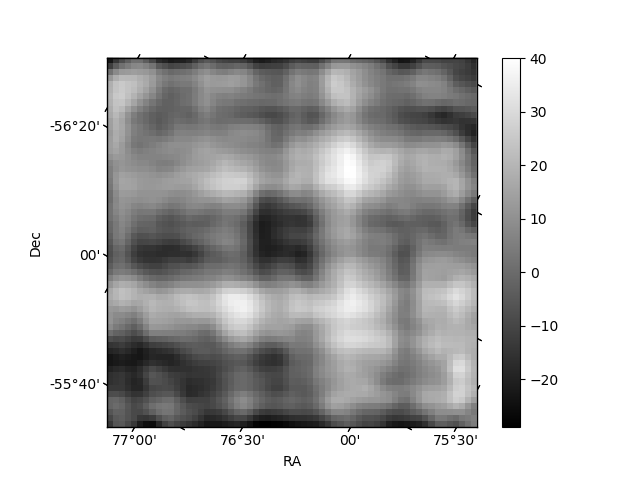
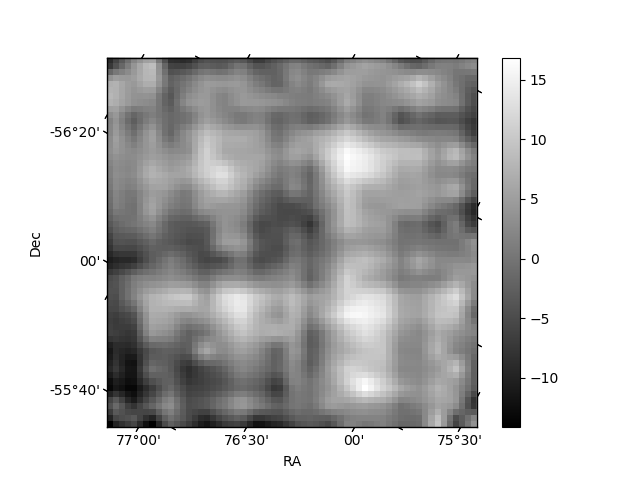
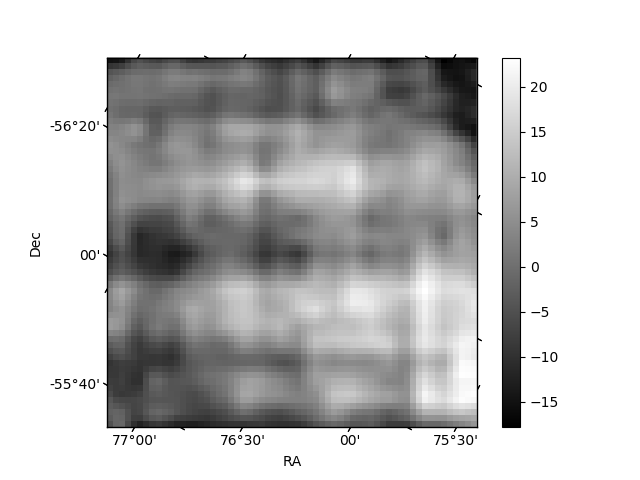
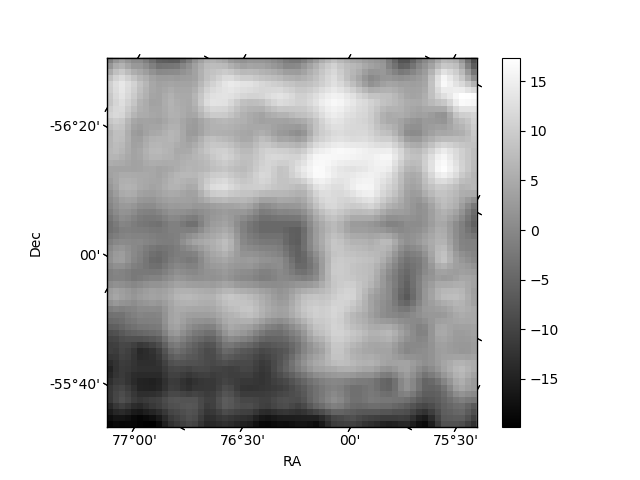
Histogram calculated using DETX and DETY for each event in the final _common_clean file
| Quadrant A | 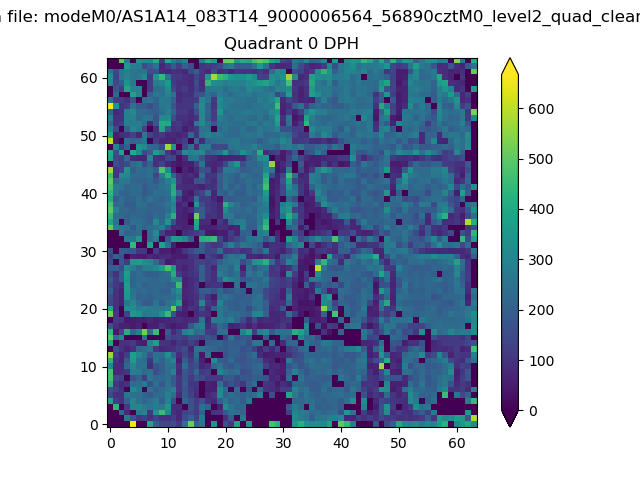 |
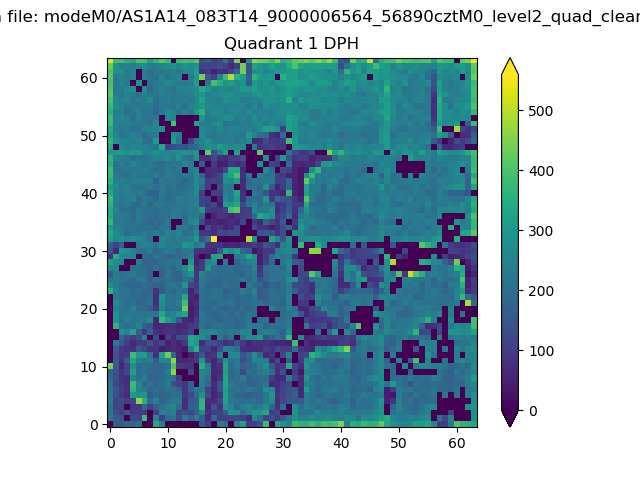 |
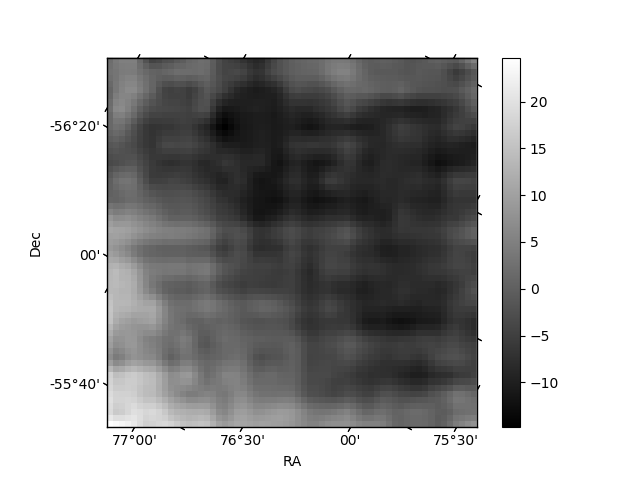
Quadrant B |
|---|---|---|---|
| Quadrant D | 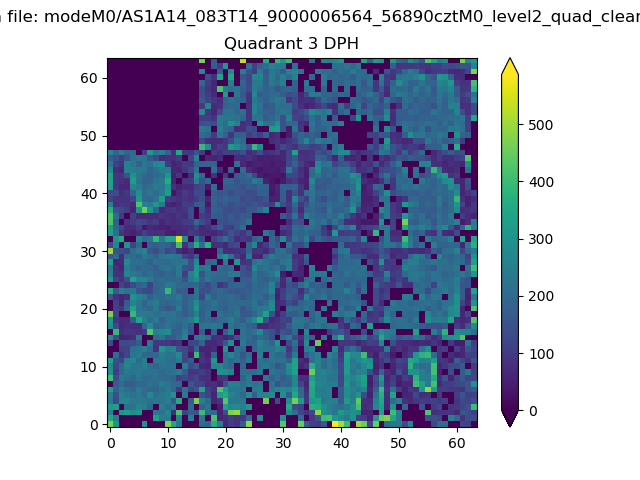 |
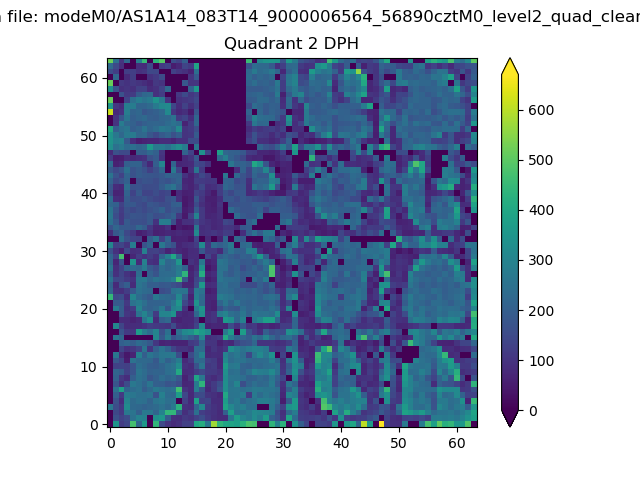 |
Quadrant C |
| Plot type | Count rate plots | Images |
|---|---|---|
| Comparison with Poisson distribution Blue bars denote a histogram of data divided into 1 sec bins. Red curve is a Poisson curve with rate = median count rate of data. |
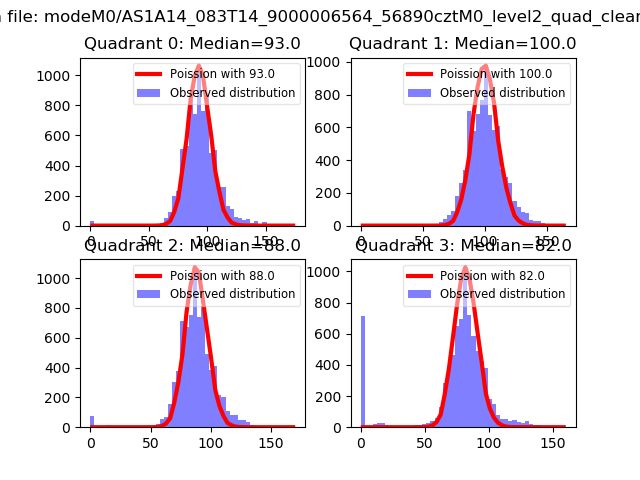 |
 |
| Quadrant-wise count rates Data is divided into 100 sec bins |
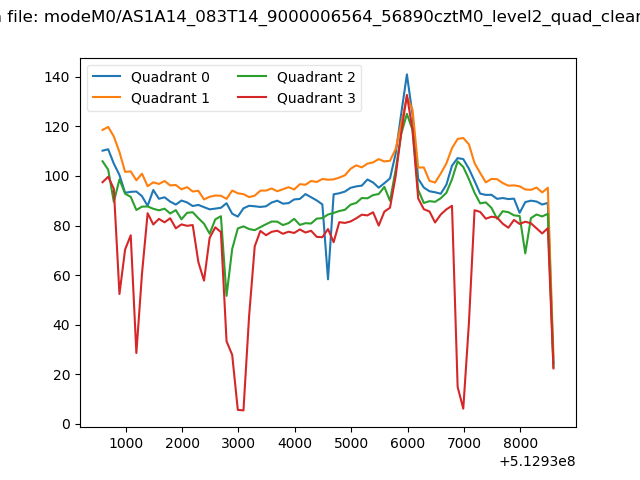 |
|
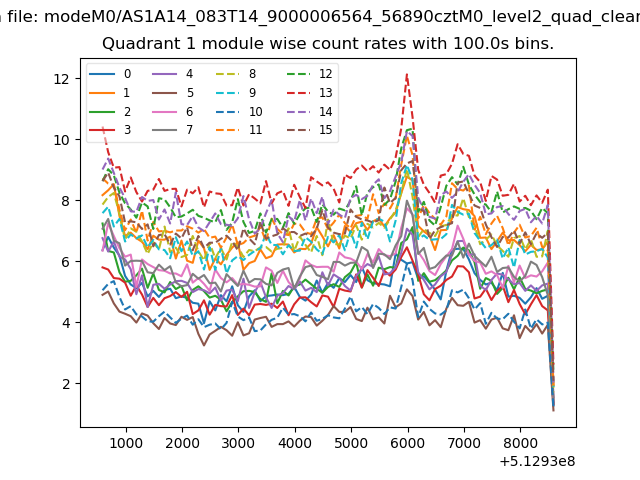
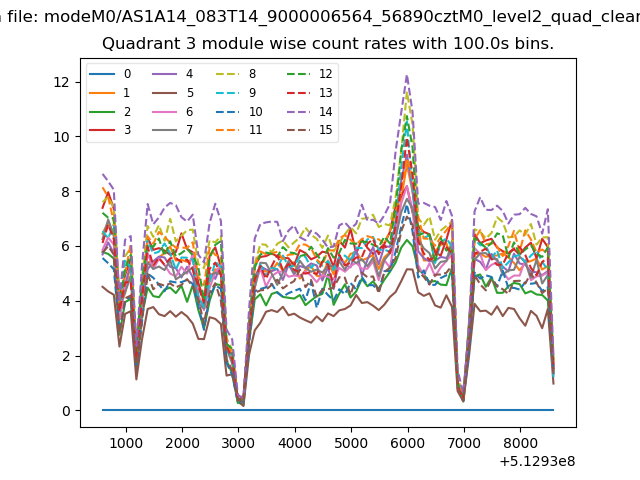
| Module-wise count rates for Quadrant A Data is divided into 100 sec bins |
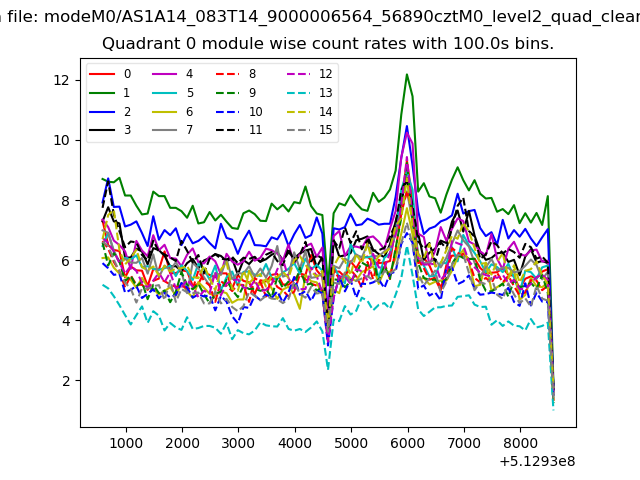 |
 |
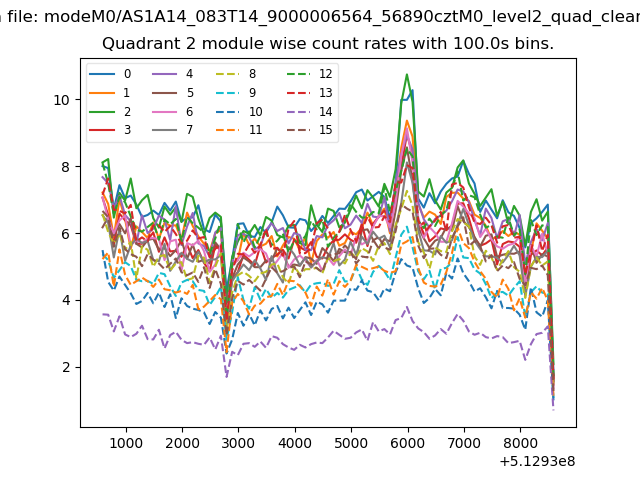
| Module-wise count rates for Quadrant B Data is divided into 100 sec bins |
 |
 |
| Module-wise count rates for Quadrant C Data is divided into 100 sec bins |
 |
 |
| Module-wise count rates for Quadrant D Data is divided into 100 sec bins |
 |
 |
| Parameter | Plot |
|---|---|
| CZT HV Monitor | 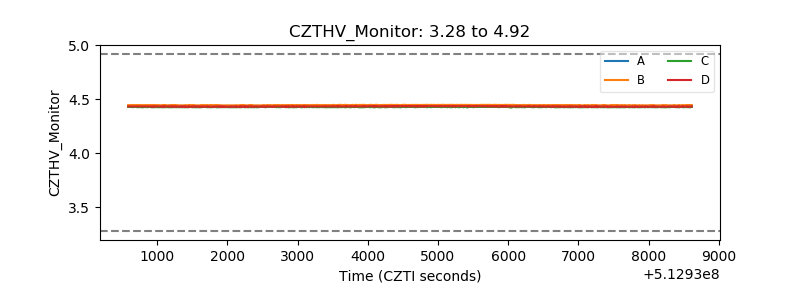 |
| D_VDD | 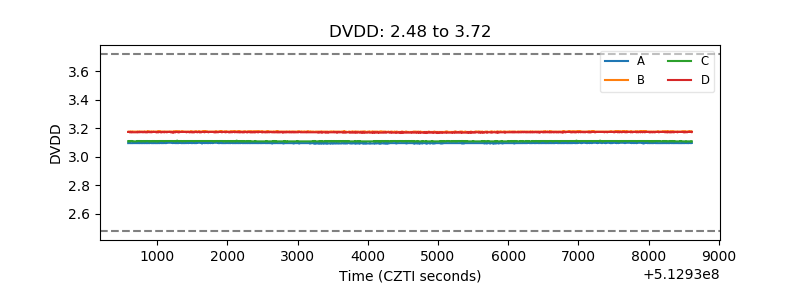 |
| Temperature 1 | 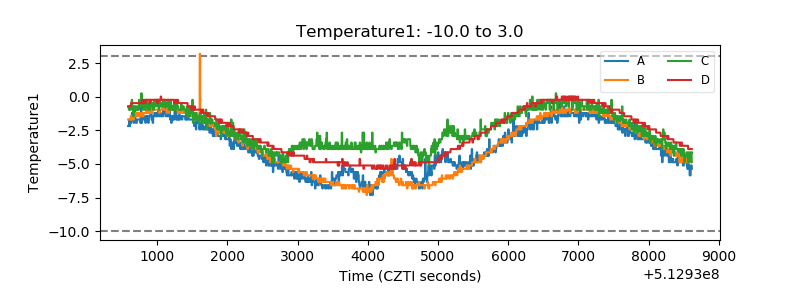 |
| Veto HV Monitor | 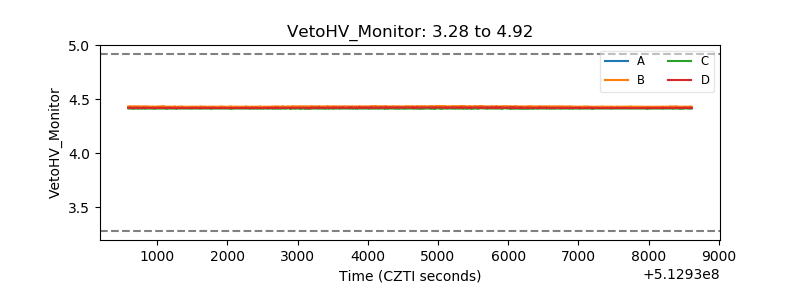 |
| Veto LLD | 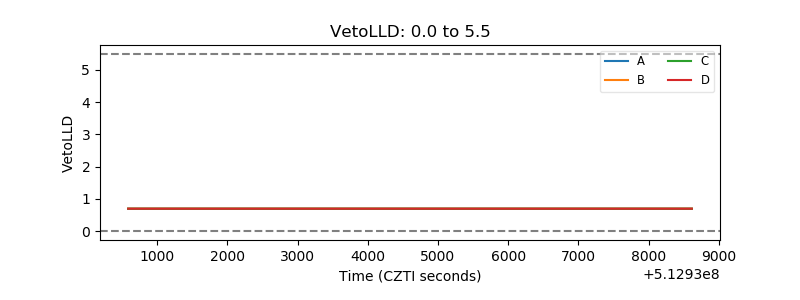 |
| Alpha Counter | 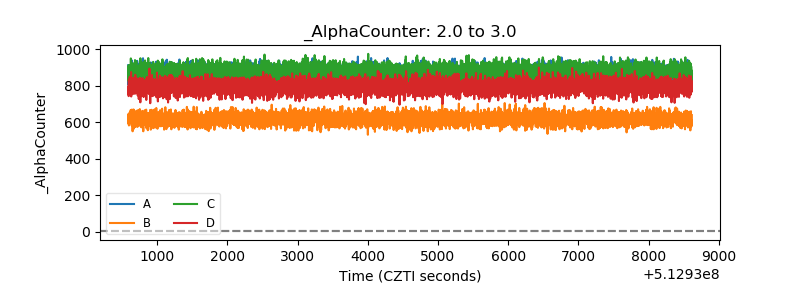 |
| _CPM_Rate | 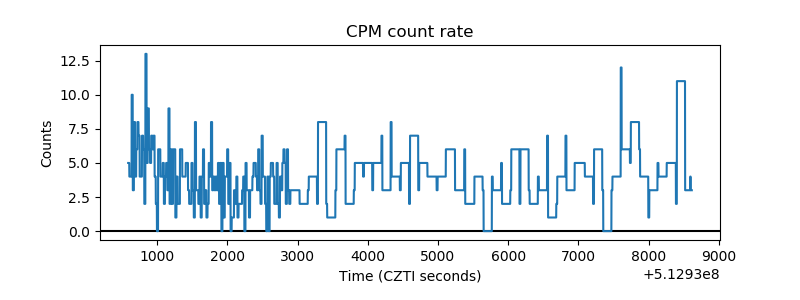 |
| CZT Counter | 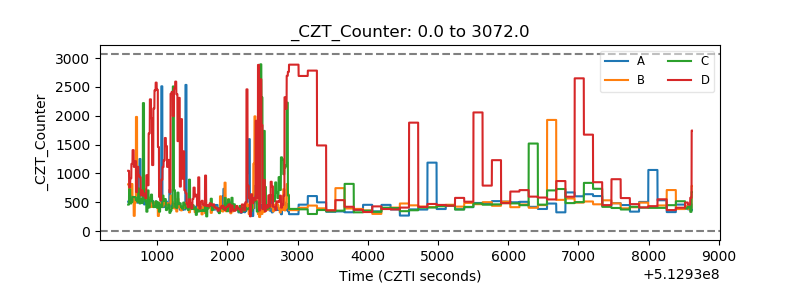 |
| +2.5 Volts monitor |  |
| +5 Volts monitor | 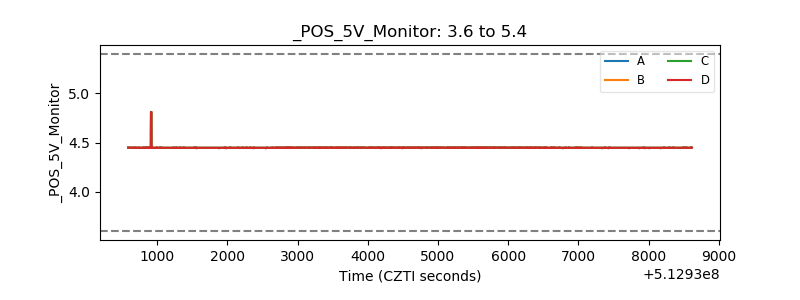 |
| _ROLL_ROT | 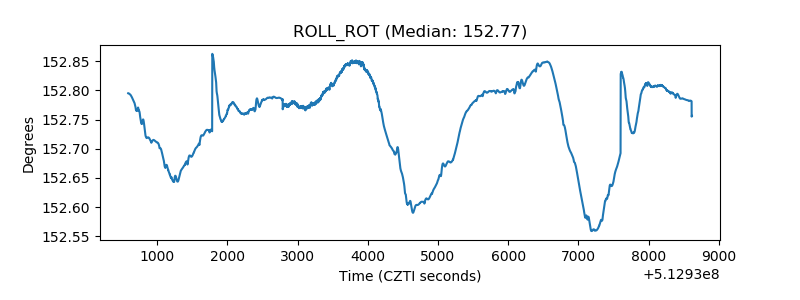 |
| _Roll_DEC | 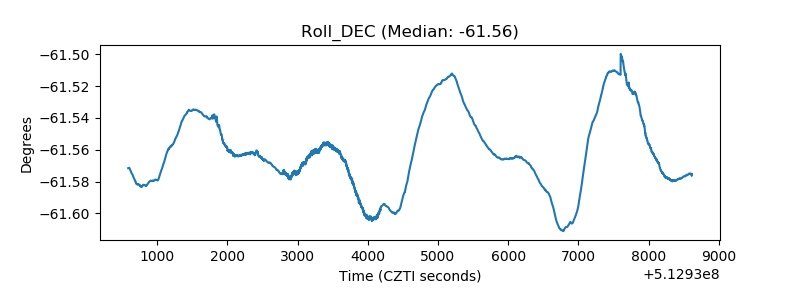 |
| _Roll_RA | 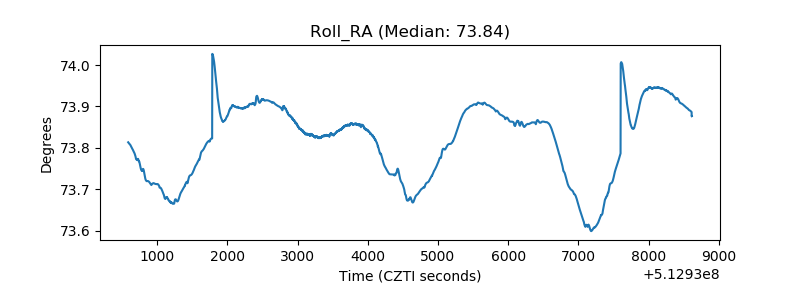 |
| Veto Counter | 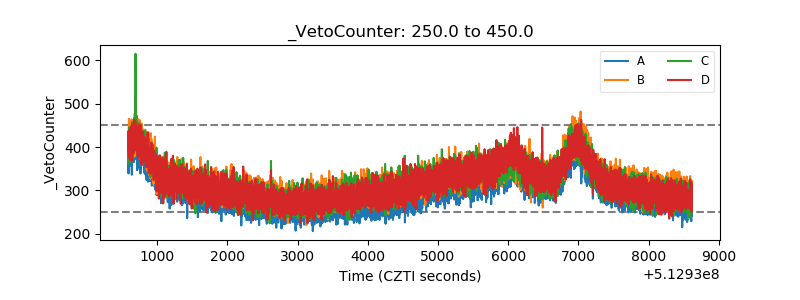 |