| Param | Original file | Final file |
|---|---|---|
| Filename | modeM0/AS1A14_083T14_9000006564_56893cztM0_level2.fits | modeM0/AS1A14_083T14_9000006564_56893cztM0_level2_quad_clean.evt |
| Size (bytes) | 1,261,241,280 | 266,051,520 |
| Size | 1.2 GB | 253.7 MB |
| Events in quadrant A | 9,132,563 | 1,788,038 |
| Events in quadrant B | 10,395,138 | 1,843,967 |
| Events in quadrant C | 12,812,259 | 1,554,394 |
| Events in quadrant D | 12,867,664 | 1,551,945 |
| Mode SS | |||
|---|---|---|---|
| Quadrant | BADHDUFLAG | Total packets | Discarded packets |
| A | 0 | 390 | 0 |
| B | 0 | 390 | 0 |
| C | 0 | 390 | 0 |
| D | 0 | 390 | 0 |
| Mode M9 | |||
|---|---|---|---|
| Quadrant | BADHDUFLAG | Total packets | Discarded packets |
| A | 0 | 11 | 0 |
| B | 0 | 11 | 0 |
| C | 0 | 11 | 0 |
| D | 0 | 11 | 0 |
| Mode M0 | |||
|---|---|---|---|
| Quadrant | BADHDUFLAG | Total packets | Discarded packets |
| A | 0 | 42049 | 3 |
| B | 0 | 44719 | 6 |
| C | 0 | 51974 | 3 |
| D | 0 | 52026 | 3 |
| Quadrant | Total seconds | Saturated seconds | Saturation percentage |
|---|---|---|---|
| A | 19108 | 291 | 1.522922% |
| B | 19105 | 605 | 3.166710% |
| C | 19107 | 1190 | 6.228084% |
| D | 19108 | 902 | 4.720536% |
Noise dominated data is calculated using 1-second bins in cleaned event files. If a bin has >2000 counts, and if more than 50% of those come from <1% of pixels, then it is considered to be noise-dominated and hence unusable.
| Quadrant | # 1 sec bins | Bins with >0 counts | Bins with >2000 counts | High rate bins dominated by noise | Noise dominated (total time) | Noise dominated (detector-on time) | Marked lightcurve |
|---|---|---|---|---|---|---|---|
| A | 20288 | 19111 | 159 | 159 | 0.78% | 0.83% | 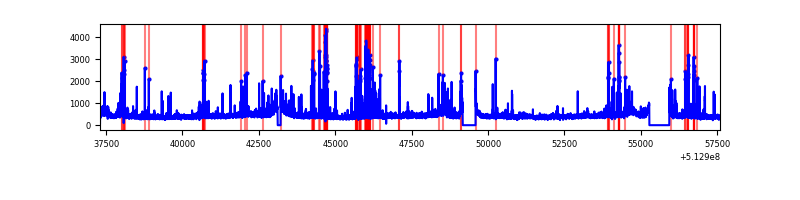 |
| B | 20287 | 19109 | 310 | 310 | 1.53% | 1.62% | 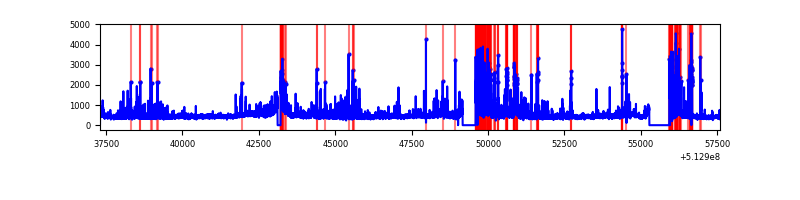 |
| C | 20287 | 19110 | 1010 | 1010 | 4.98% | 5.29% |  |
| D | 20288 | 19111 | 727 | 727 | 3.58% | 3.80% | 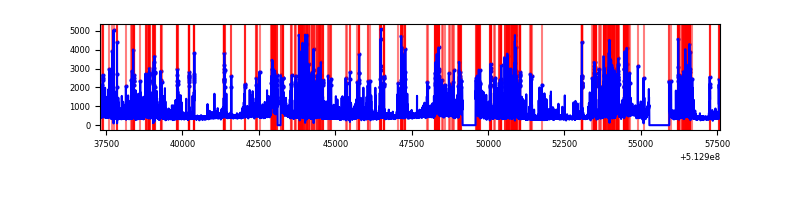 |
Top three noisy pixels from each quadrant. If the there are fewer than three noisy pixels in the level2.evt file, extra rows are filled as -1
| Pixel properties | Quadrant properties | ||||||
|---|---|---|---|---|---|---|---|
| Quadrant | DetID | PixID | Counts | Sigma | Mean | Median | Sigma |
| A | 4 | 13 | 680776 | 1377.84 | 1976 | 1927 | 492.7 |
| A | 7 | 64 | 150414 | 301.38 | 1976 | 1927 | 492.7 |
| A | 4 | 249 | 127949 | 255.78 | 1976 | 1927 | 492.7 |
| B | 10 | 16 | 1458063 | 3593.84 | 1914 | 1851 | 405.2 |
| B | 7 | 0 | 248566 | 608.88 | 1914 | 1851 | 405.2 |
| B | 10 | 247 | 196899 | 481.37 | 1914 | 1851 | 405.2 |
| C | 13 | 3 | 3520489 | 6935.13 | 1838 | 1820 | 507.4 |
| C | 1 | 16 | 952949 | 1874.63 | 1838 | 1820 | 507.4 |
| C | 12 | 241 | 250505 | 490.15 | 1838 | 1820 | 507.4 |
| D | 8 | 240 | 1134936 | 2146.68 | 1870 | 1788 | 527.9 |
| D | 2 | 249 | 1087794 | 2057.38 | 1870 | 1788 | 527.9 |
| D | 3 | 12 | 947112 | 1790.86 | 1870 | 1788 | 527.9 |
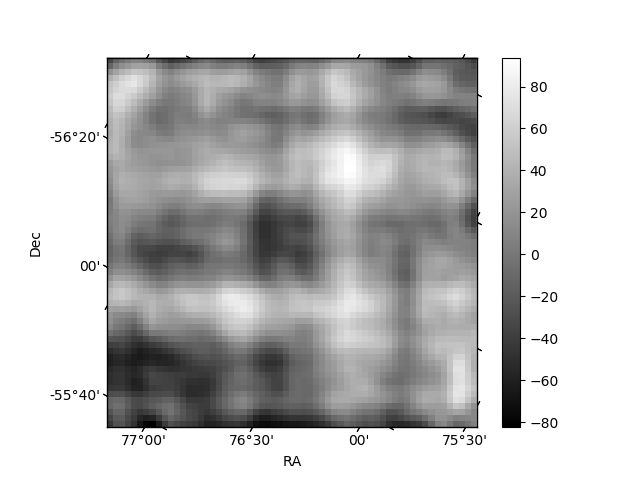
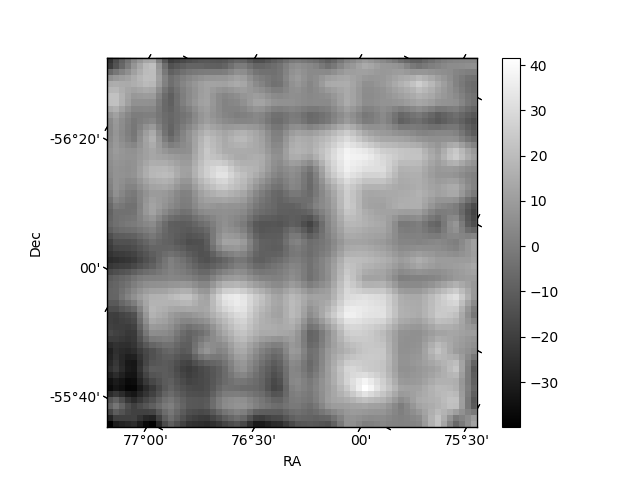
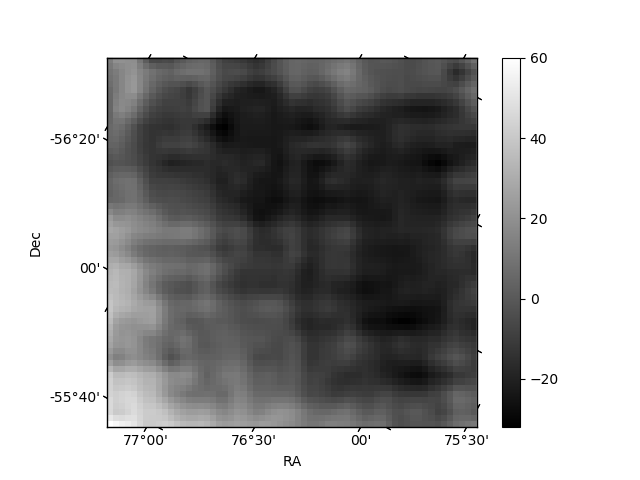
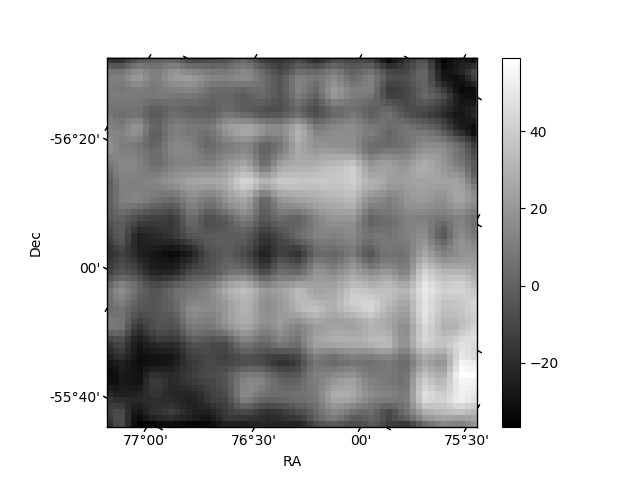
Histogram calculated using DETX and DETY for each event in the final _common_clean file
| Quadrant A | 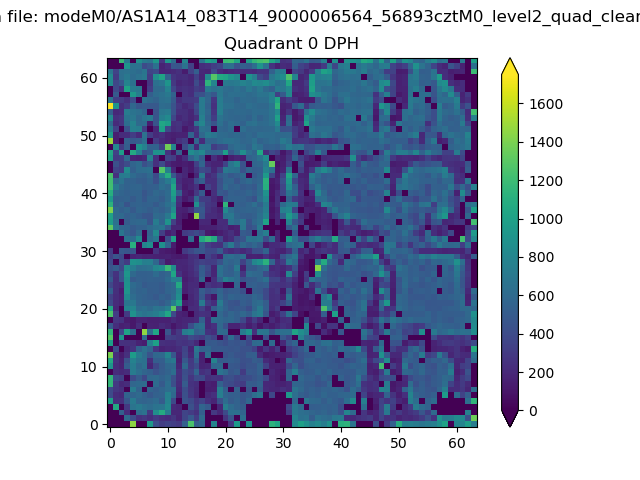 |
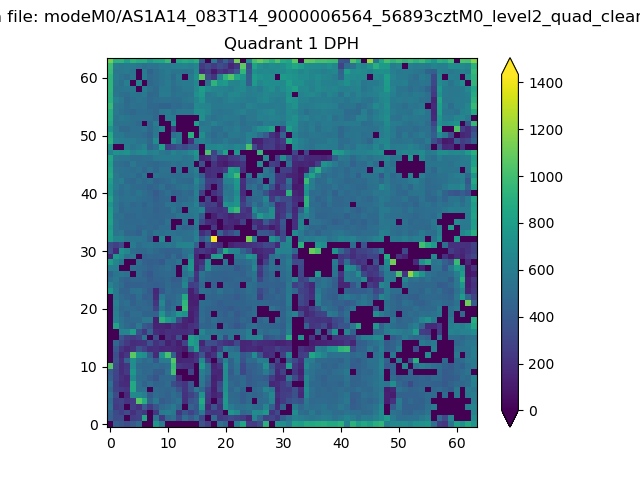 |
Quadrant B |
|---|---|---|---|
| Quadrant D | 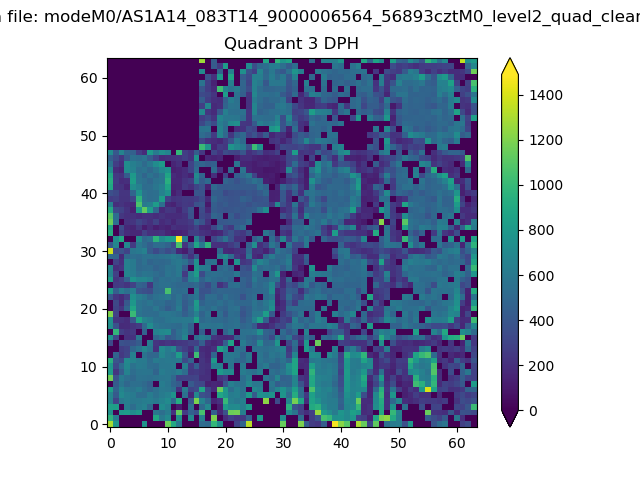 |
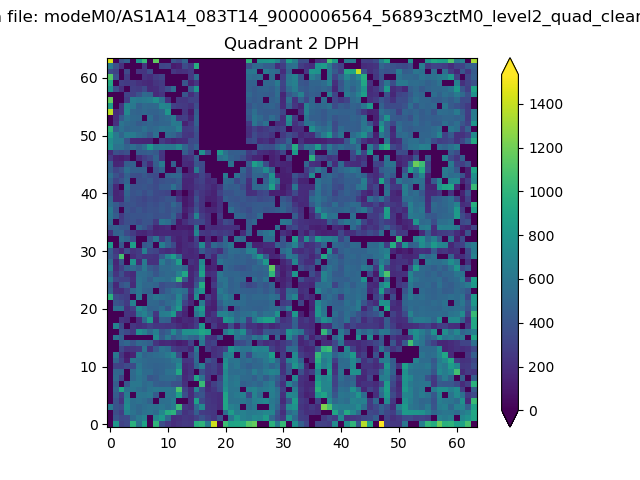 |
Quadrant C |
| Plot type | Count rate plots | Images |
|---|---|---|
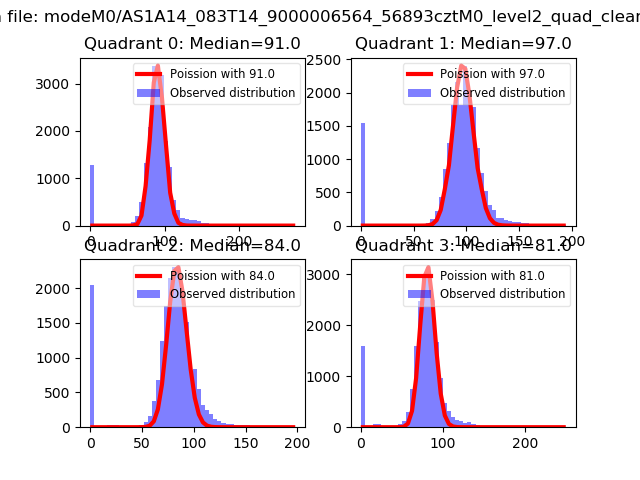
| Comparison with Poisson distribution Blue bars denote a histogram of data divided into 1 sec bins. Red curve is a Poisson curve with rate = median count rate of data. |
 |
 |
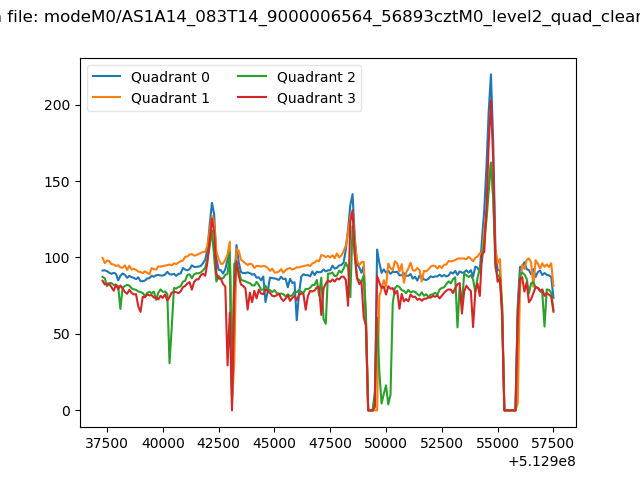
| Quadrant-wise count rates Data is divided into 100 sec bins |
 |
|
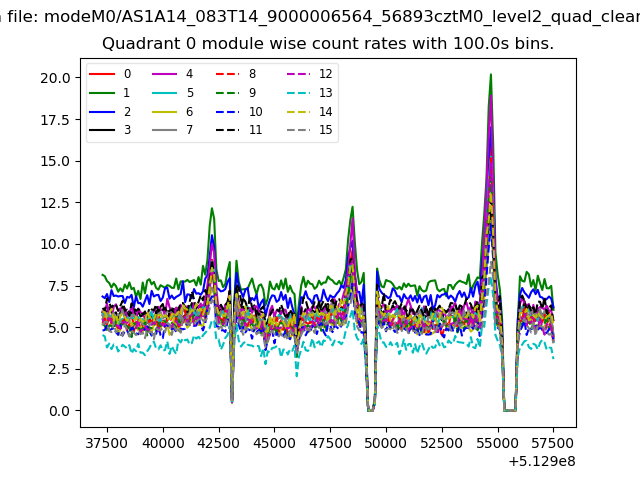
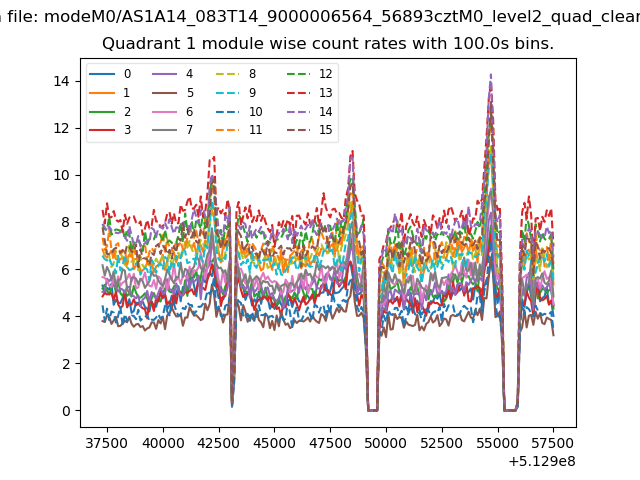
| Module-wise count rates for Quadrant A Data is divided into 100 sec bins |
 |
 |
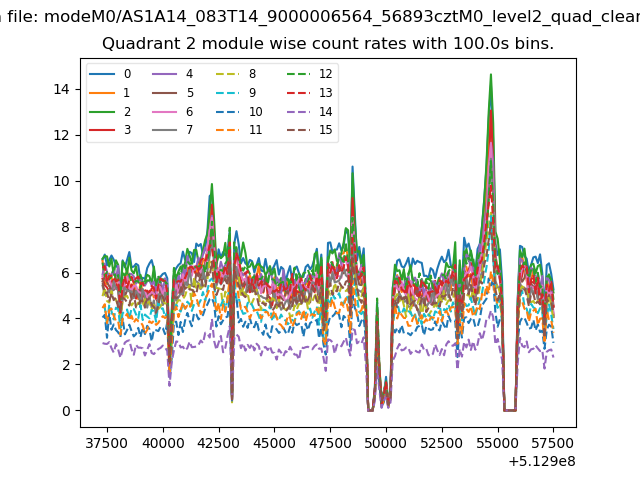
| Module-wise count rates for Quadrant B Data is divided into 100 sec bins |
 |
 |
| Module-wise count rates for Quadrant C Data is divided into 100 sec bins |
 |
 |
| Module-wise count rates for Quadrant D Data is divided into 100 sec bins |
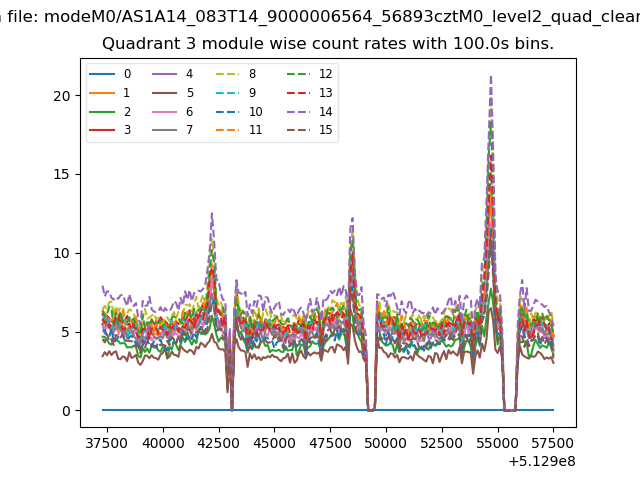 |
 |
| Parameter | Plot |
|---|---|
| CZT HV Monitor | 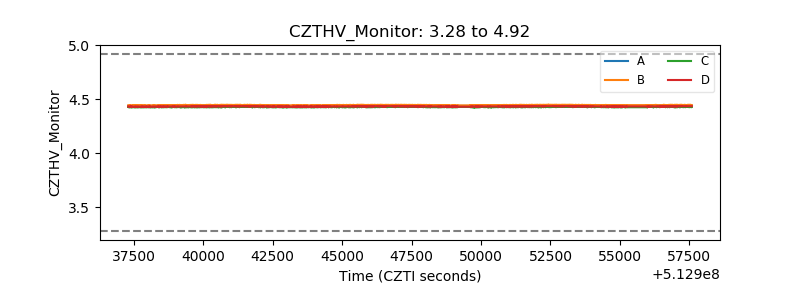 |
| D_VDD | 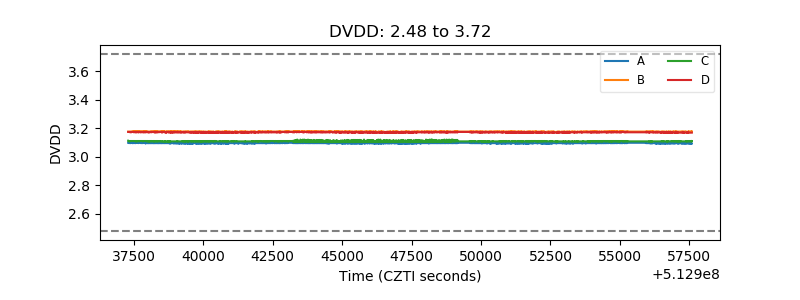 |
| Temperature 1 | 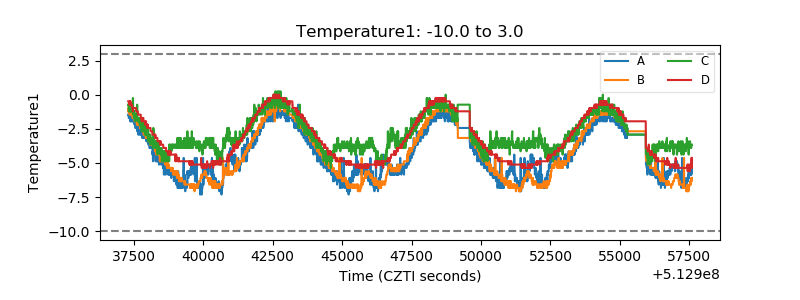 |
| Veto HV Monitor | 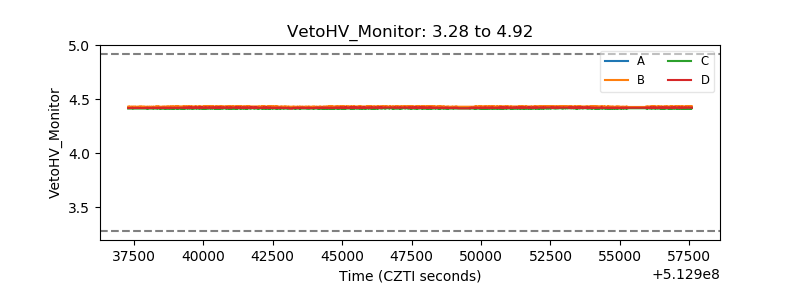 |
| Veto LLD | 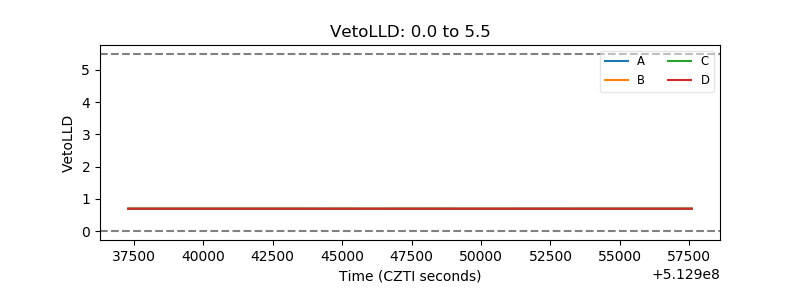 |
| Alpha Counter | 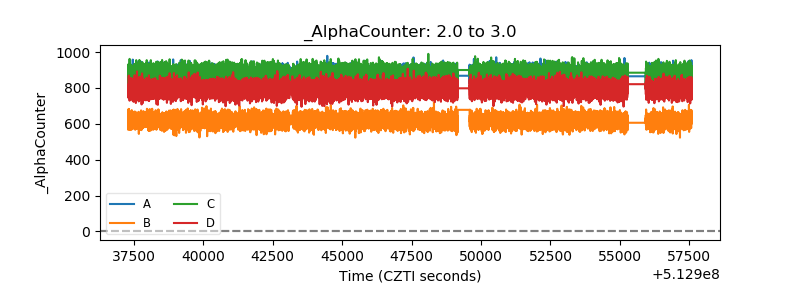 |
| _CPM_Rate | 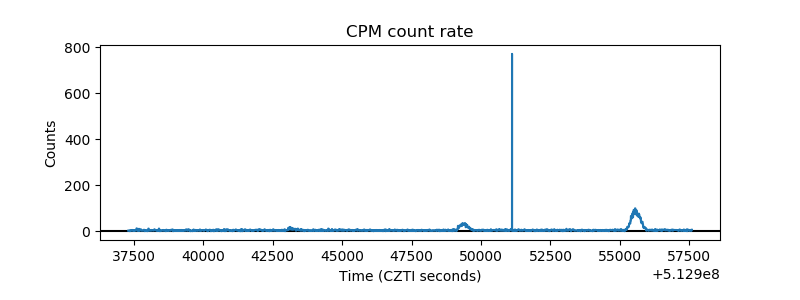 |
| CZT Counter | 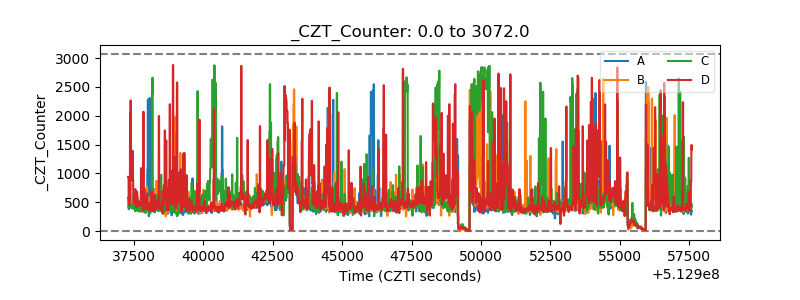 |
| +2.5 Volts monitor |  |
| +5 Volts monitor | 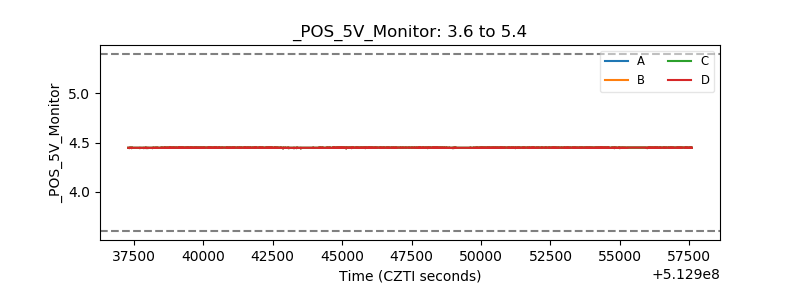 |
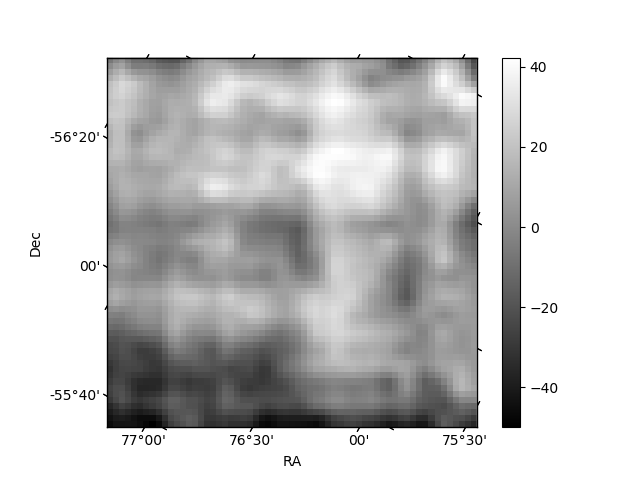
| _ROLL_ROT | 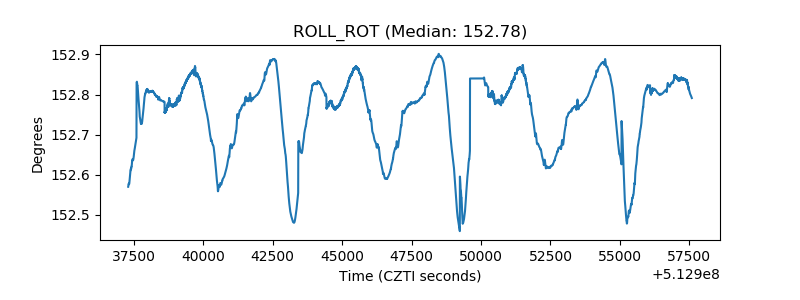 |
| _Roll_DEC | 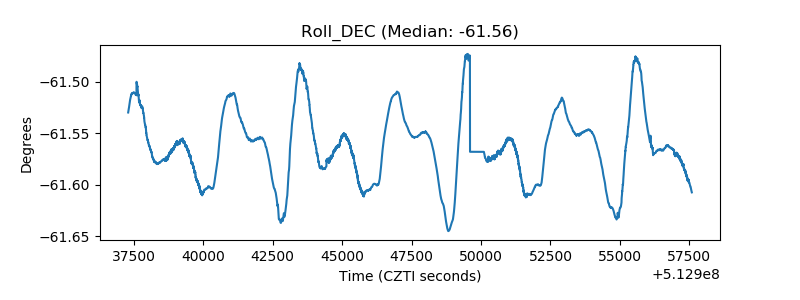 |
| _Roll_RA | 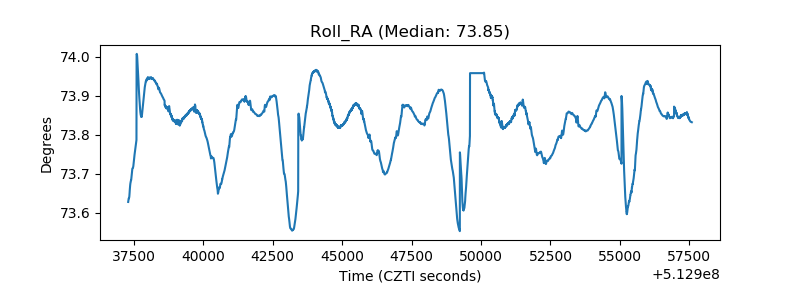 |
| Veto Counter | 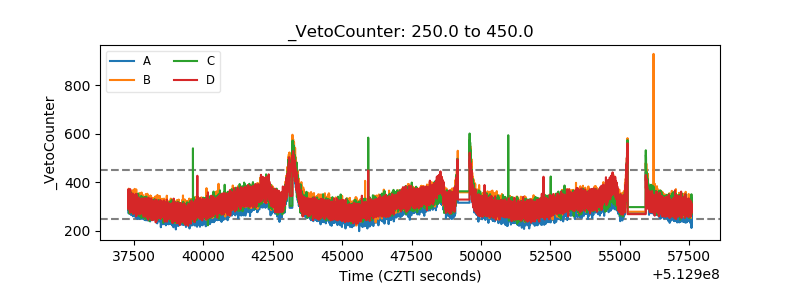 |