| Param | Original file | Final file |
|---|---|---|
| Filename | modeM0/AS1A14_083T14_9000006564_56894cztM0_level2.fits | modeM0/AS1A14_083T14_9000006564_56894cztM0_level2_quad_clean.evt |
| Size (bytes) | 478,800,000 | 103,426,560 |
| Size | 456.6 MB | 98.6 MB |
| Events in quadrant A | 3,290,825 | 696,292 |
| Events in quadrant B | 4,346,468 | 686,173 |
| Events in quadrant C | 4,534,385 | 636,332 |
| Events in quadrant D | 4,979,492 | 599,752 |
| Mode SS | |||
|---|---|---|---|
| Quadrant | BADHDUFLAG | Total packets | Discarded packets |
| A | 0 | 154 | 0 |
| B | 0 | 154 | 0 |
| C | 0 | 154 | 0 |
| D | 0 | 154 | 0 |
| Mode M9 | |||
|---|---|---|---|
| Quadrant | BADHDUFLAG | Total packets | Discarded packets |
| A | 0 | 14 | 0 |
| B | 0 | 14 | 0 |
| C | 0 | 14 | 0 |
| D | 0 | 14 | 0 |
| Mode M0 | |||
|---|---|---|---|
| Quadrant | BADHDUFLAG | Total packets | Discarded packets |
| A | 0 | 15583 | 2 |
| B | 0 | 18372 | 2 |
| C | 0 | 18870 | 2 |
| D | 0 | 20292 | 2 |
| Quadrant | Total seconds | Saturated seconds | Saturation percentage |
|---|---|---|---|
| A | 7360 | 71 | 0.964674% |
| B | 7360 | 534 | 7.255435% |
| C | 7361 | 308 | 4.184214% |
| D | 7361 | 376 | 5.108002% |
Noise dominated data is calculated using 1-second bins in cleaned event files. If a bin has >2000 counts, and if more than 50% of those come from <1% of pixels, then it is considered to be noise-dominated and hence unusable.
| Quadrant | # 1 sec bins | Bins with >0 counts | Bins with >2000 counts | High rate bins dominated by noise | Noise dominated (total time) | Noise dominated (detector-on time) | Marked lightcurve |
|---|---|---|---|---|---|---|---|
| A | 8810 | 7362 | 18 | 18 | 0.20% | 0.24% | 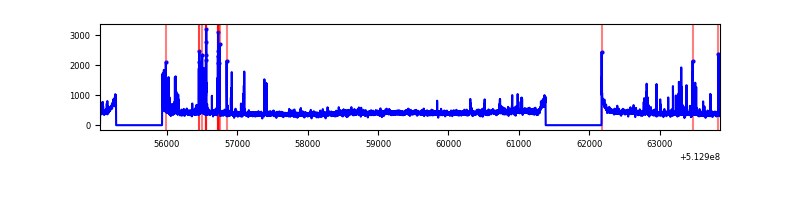 |
| B | 8810 | 7362 | 276 | 276 | 3.13% | 3.75% | 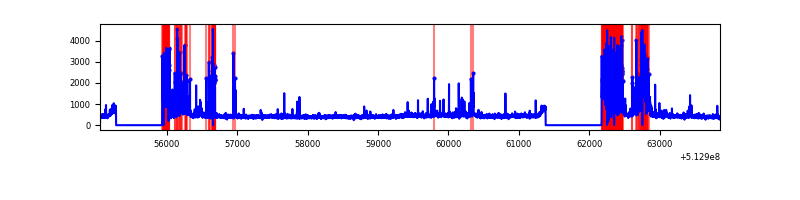 |
| C | 8811 | 7362 | 222 | 222 | 2.52% | 3.02% | 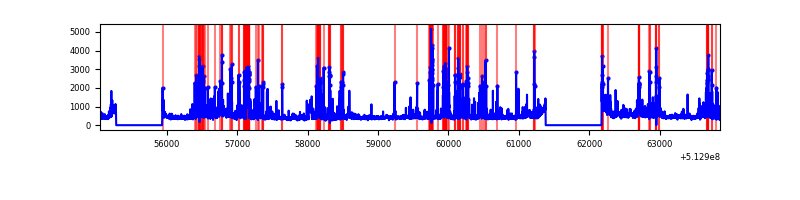 |
| D | 8811 | 7363 | 304 | 304 | 3.45% | 4.13% | 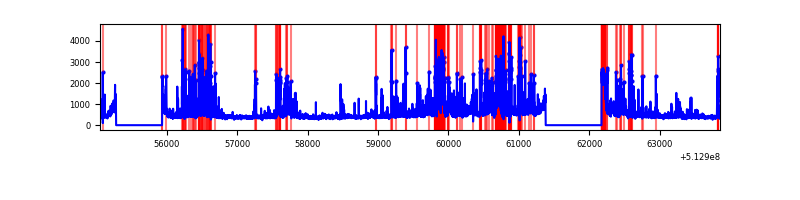 |
Top three noisy pixels from each quadrant. If the there are fewer than three noisy pixels in the level2.evt file, extra rows are filled as -1
| Pixel properties | Quadrant properties | ||||||
|---|---|---|---|---|---|---|---|
| Quadrant | DetID | PixID | Counts | Sigma | Mean | Median | Sigma |
| A | 4 | 13 | 164769 | 858.65 | 764 | 744 | 191.0 |
| A | 4 | 78 | 32342 | 165.41 | 764 | 744 | 191.0 |
| A | 11 | 31 | 31436 | 160.67 | 764 | 744 | 191.0 |
| B | 10 | 16 | 1147311 | 7375.03 | 722 | 694 | 155.5 |
| B | 5 | 185 | 70950 | 451.88 | 722 | 694 | 155.5 |
| B | 10 | 32 | 67415 | 429.15 | 722 | 694 | 155.5 |
| C | 13 | 3 | 980428 | 4853.86 | 734 | 727 | 201.8 |
| C | 6 | 223 | 223103 | 1101.74 | 734 | 727 | 201.8 |
| C | 12 | 241 | 150944 | 744.24 | 734 | 727 | 201.8 |
| D | 8 | 240 | 916649 | 4401.22 | 727 | 696 | 208.1 |
| D | 8 | 160 | 269011 | 1289.27 | 727 | 696 | 208.1 |
| D | 2 | 249 | 261263 | 1252.04 | 727 | 696 | 208.1 |
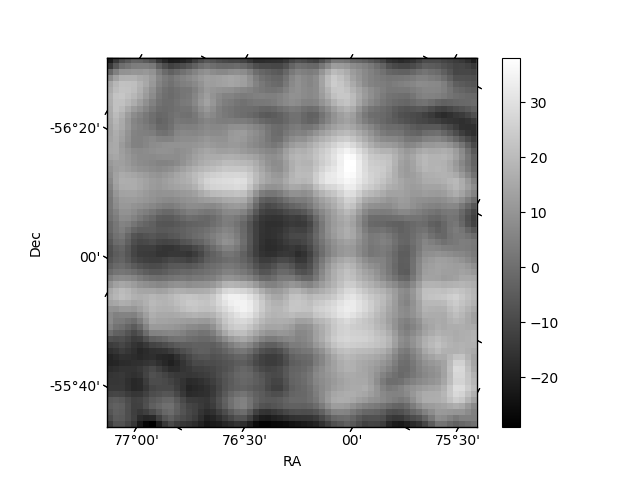
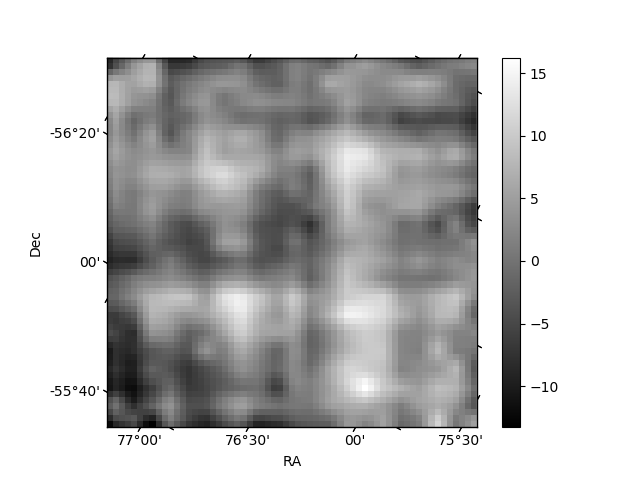
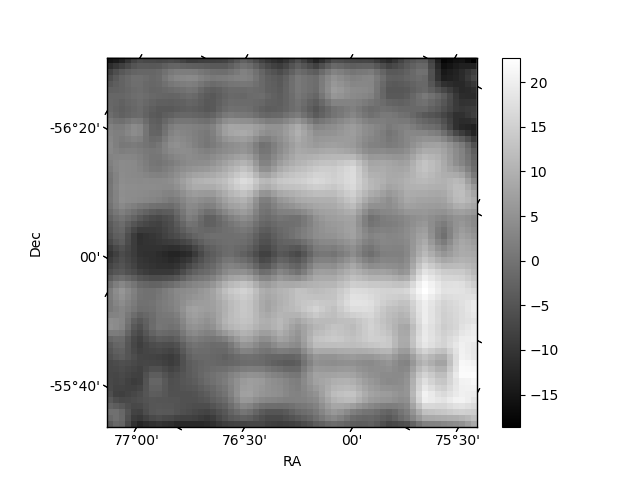
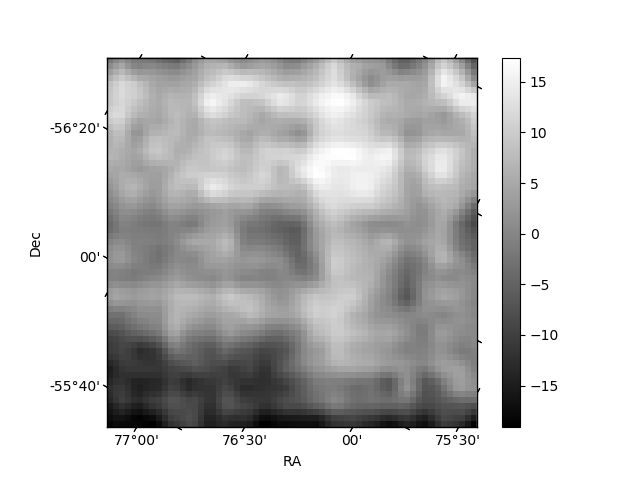
Histogram calculated using DETX and DETY for each event in the final _common_clean file
| Quadrant A | 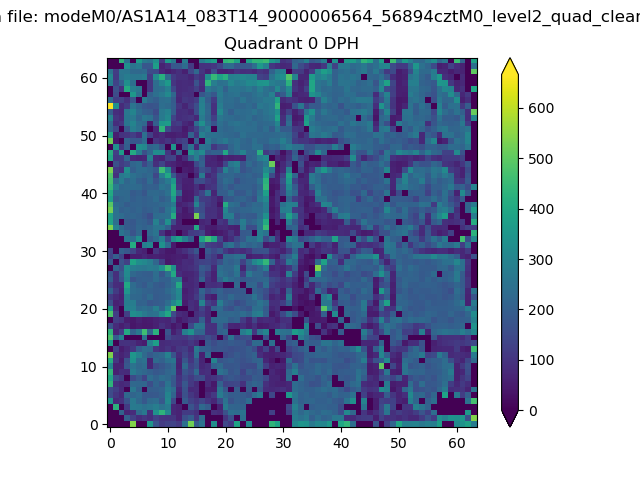 |
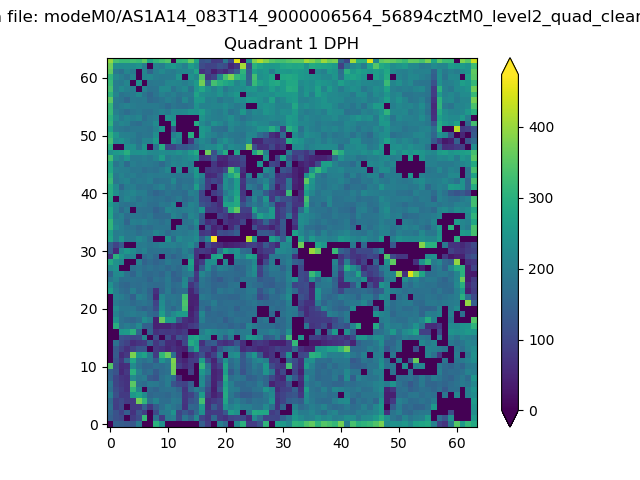 |
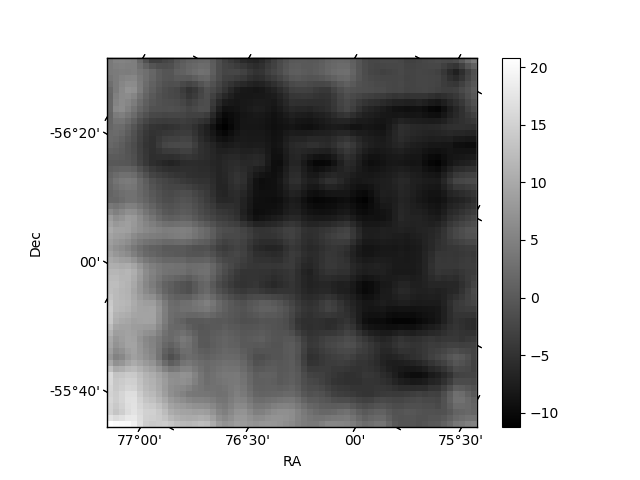
Quadrant B |
|---|---|---|---|
| Quadrant D | 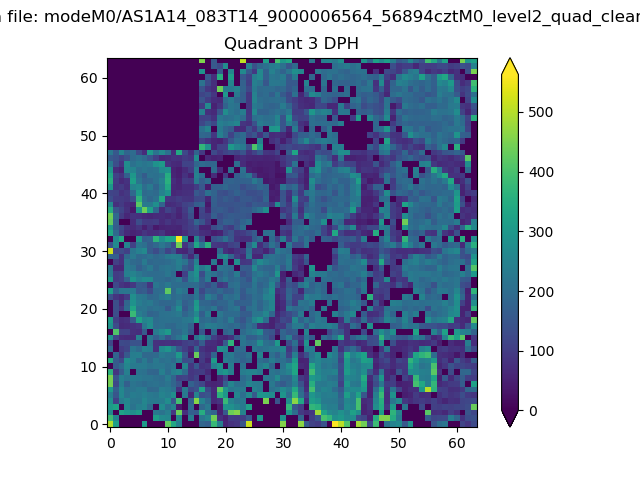 |
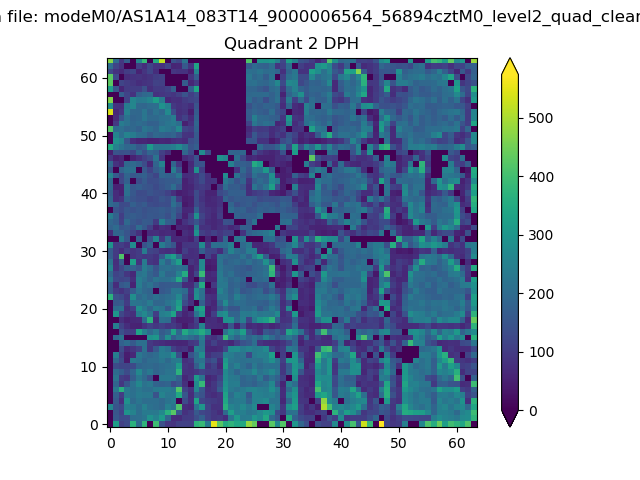 |
Quadrant C |
| Plot type | Count rate plots | Images |
|---|---|---|
| Comparison with Poisson distribution Blue bars denote a histogram of data divided into 1 sec bins. Red curve is a Poisson curve with rate = median count rate of data. |
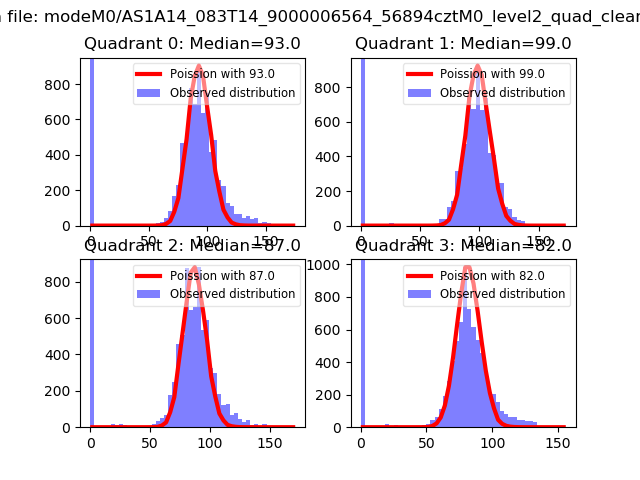 |
 |
| Quadrant-wise count rates Data is divided into 100 sec bins |
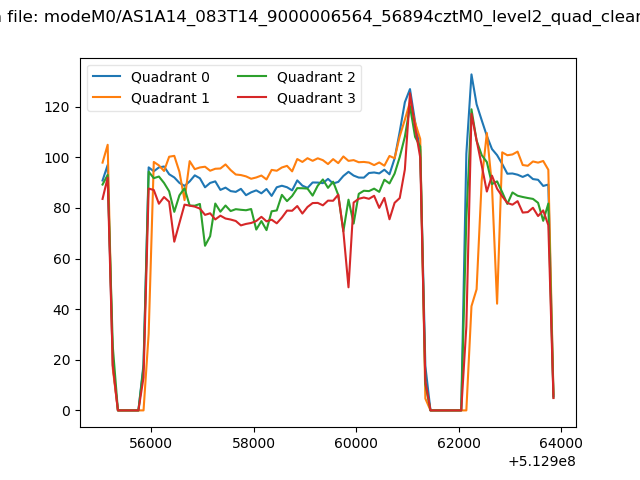 |
|
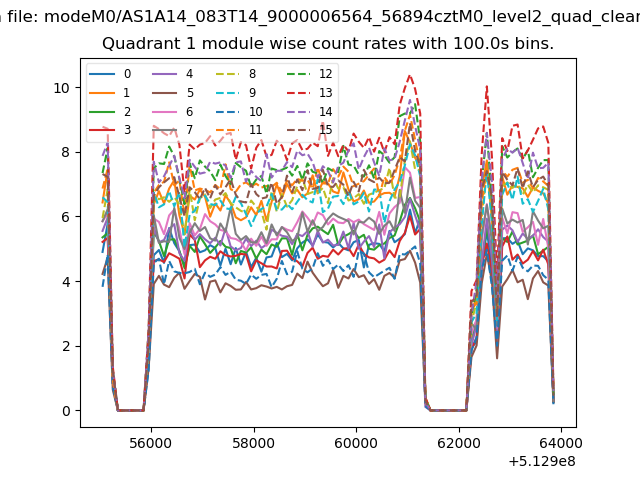
| Module-wise count rates for Quadrant A Data is divided into 100 sec bins |
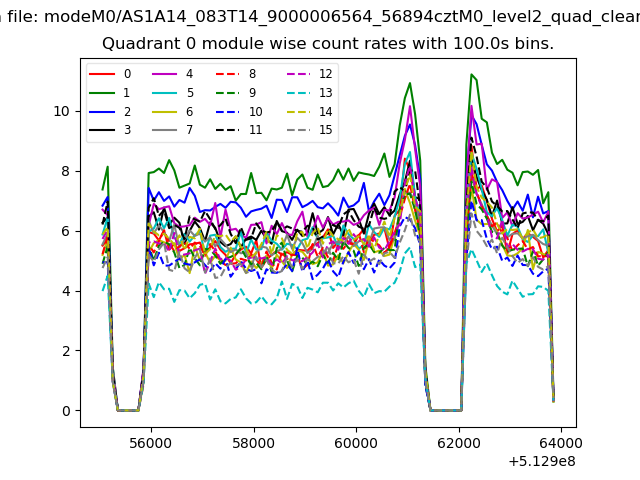 |
 |
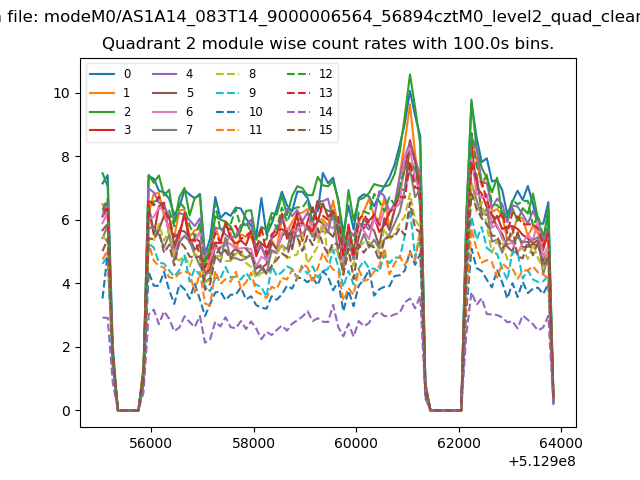
| Module-wise count rates for Quadrant B Data is divided into 100 sec bins |
 |
 |
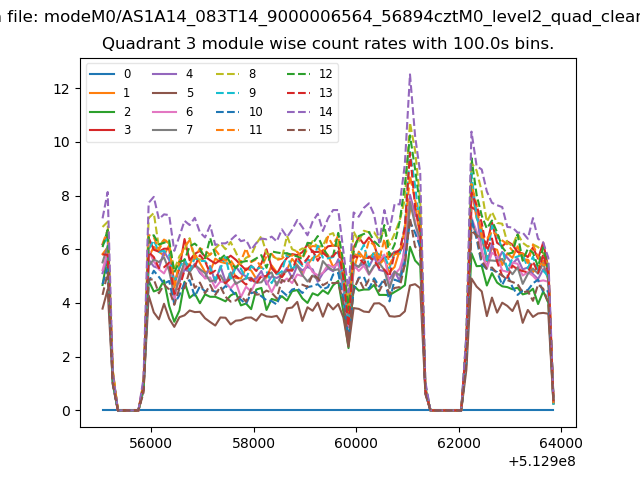
| Module-wise count rates for Quadrant C Data is divided into 100 sec bins |
 |
 |
| Module-wise count rates for Quadrant D Data is divided into 100 sec bins |
 |
 |
| Parameter | Plot |
|---|---|
| CZT HV Monitor | 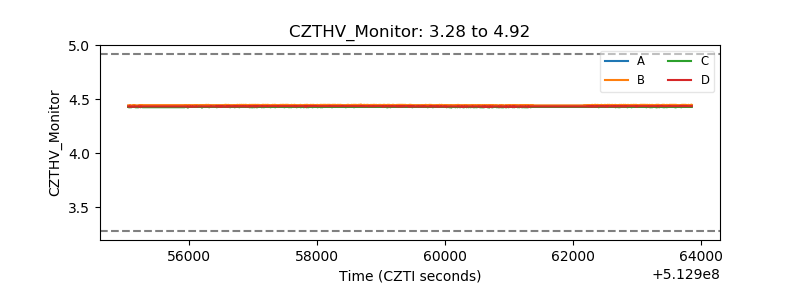 |
| D_VDD | 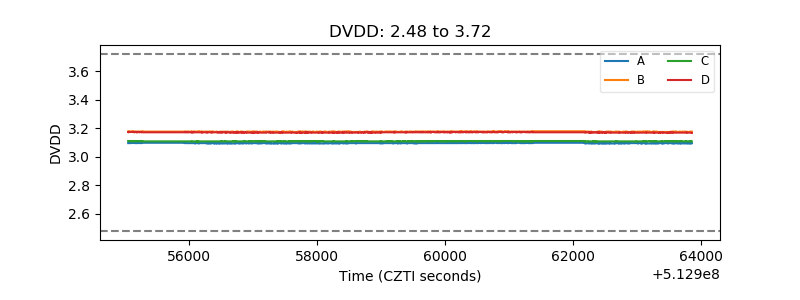 |
| Temperature 1 | 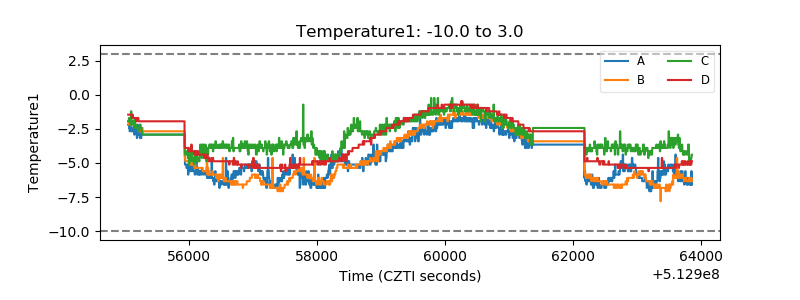 |
| Veto HV Monitor | 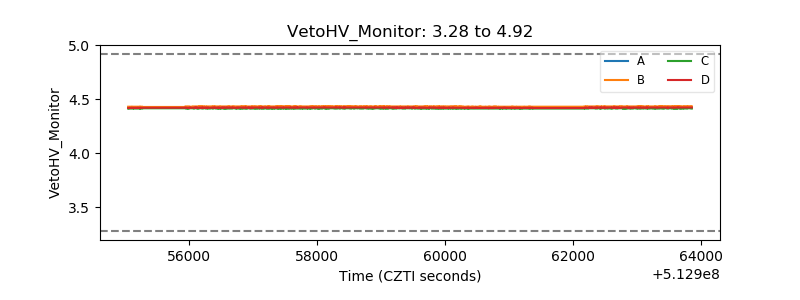 |
| Veto LLD | 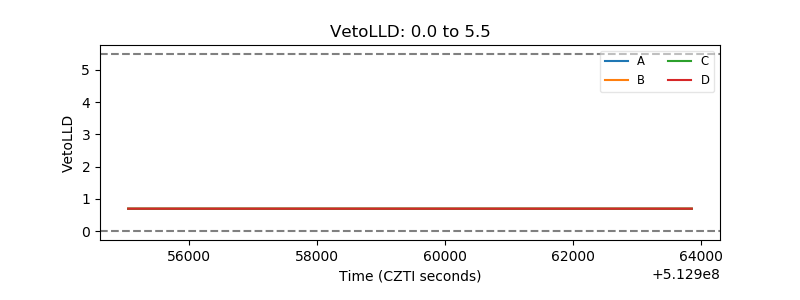 |
| Alpha Counter | 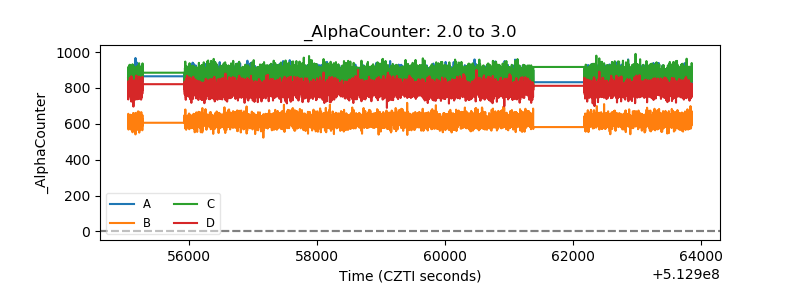 |
| _CPM_Rate | 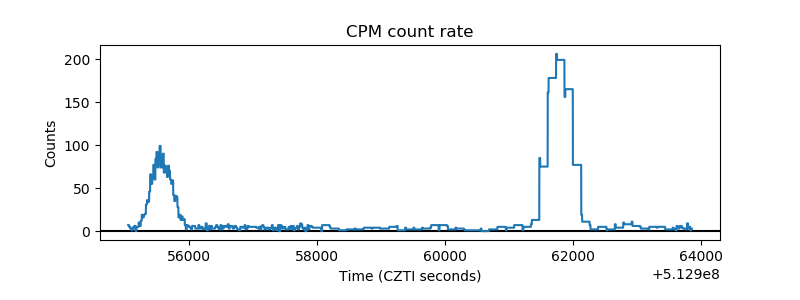 |
| CZT Counter | 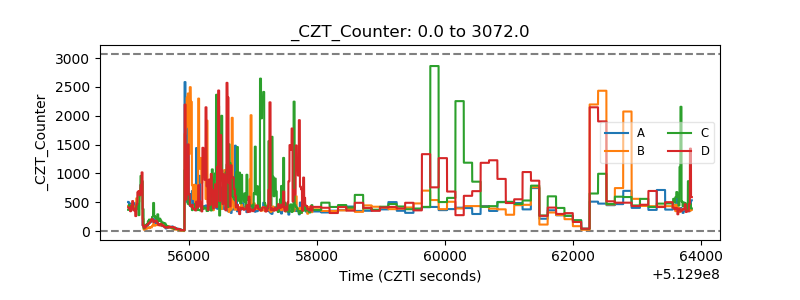 |
| +2.5 Volts monitor | 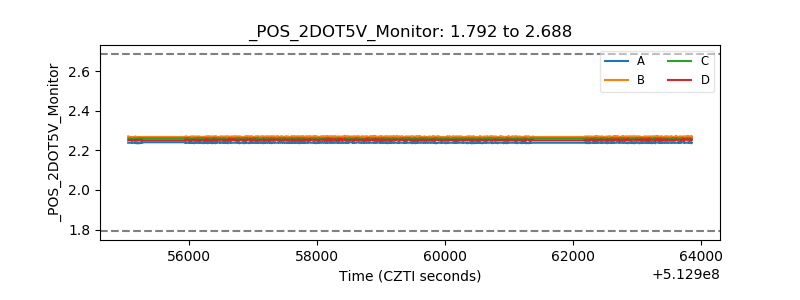 |
| +5 Volts monitor | 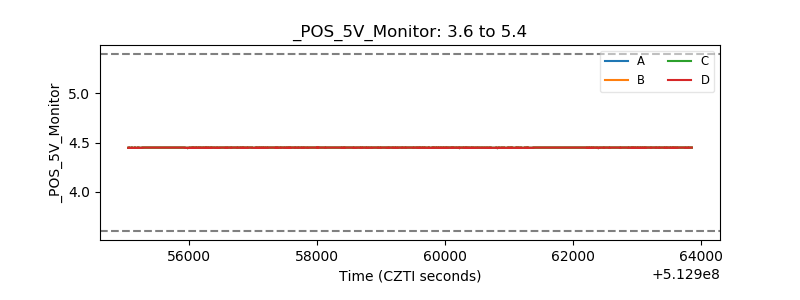 |
| _ROLL_ROT | 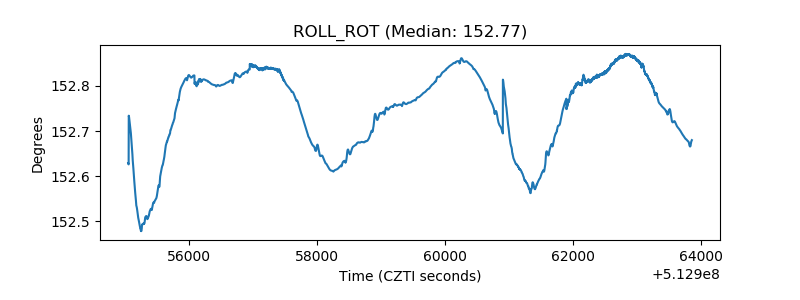 |
| _Roll_DEC | 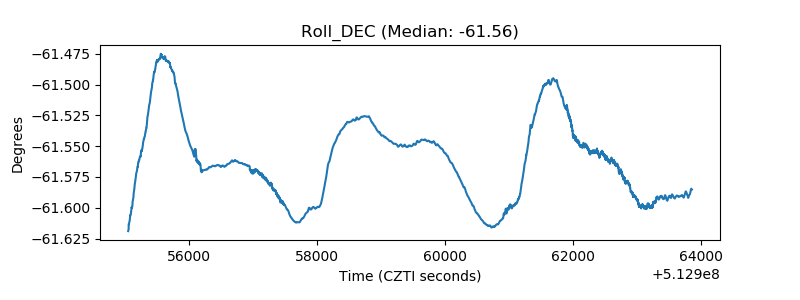 |
| _Roll_RA | 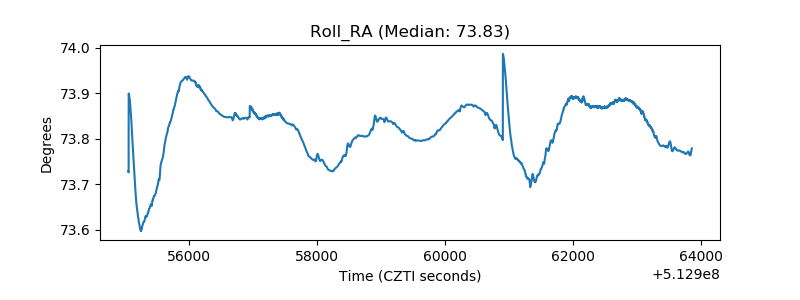 |
| Veto Counter | 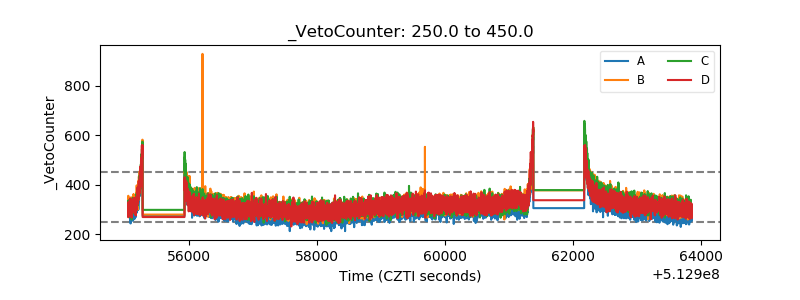 |